. 2019 Oct 25;9(1):15329.
doi: 10.1038/s41598-019-51778-6.

Small extracellular vesicles convey the stress-induced adaptive responses of melanoma cells

Affiliations

Small extracellular vesicles convey the stress-induced adaptive responses of melanoma cells

Maria Harmati et al. Sci Rep. .

Abstract

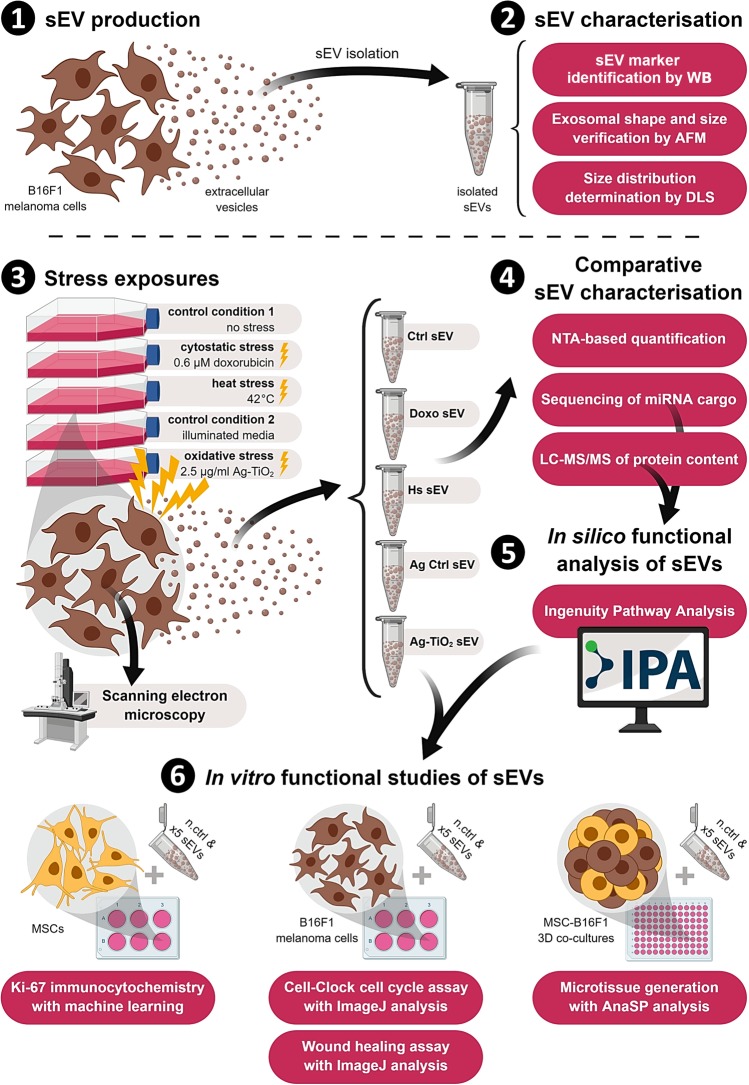
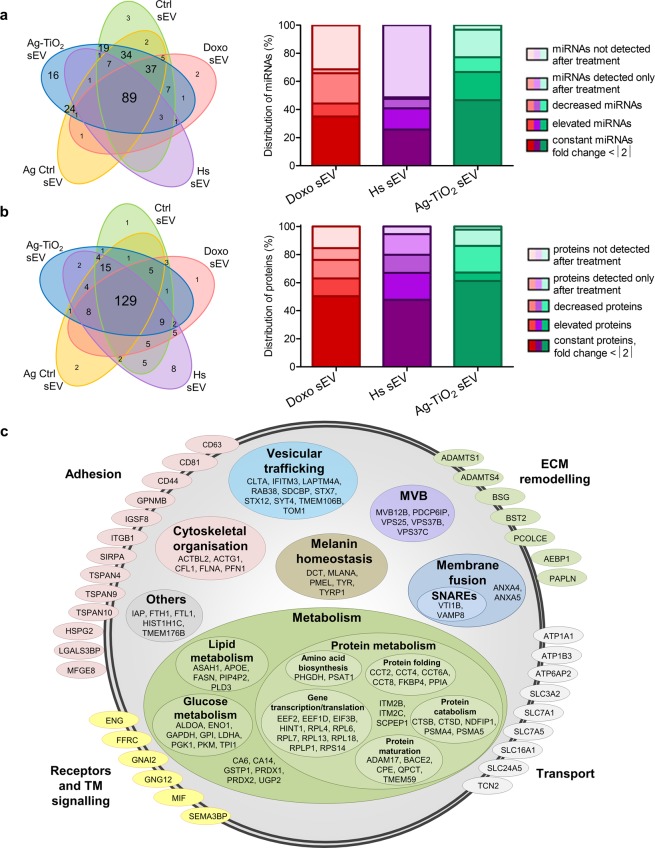
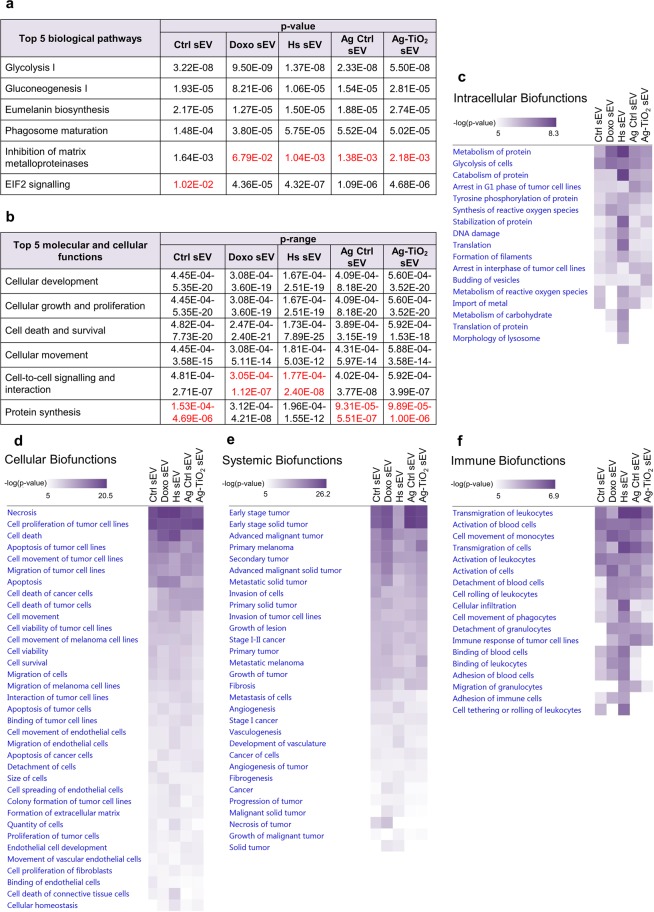
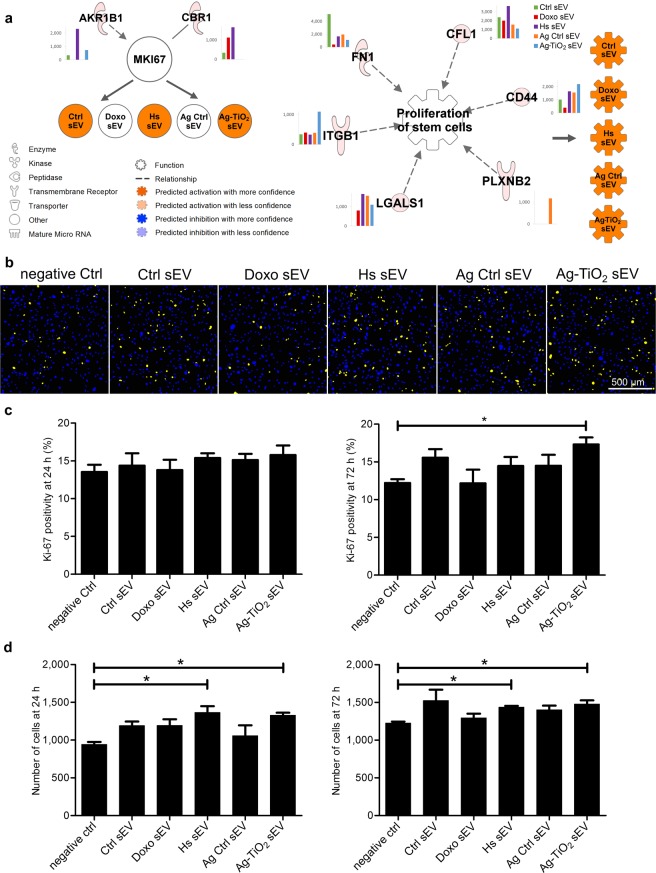
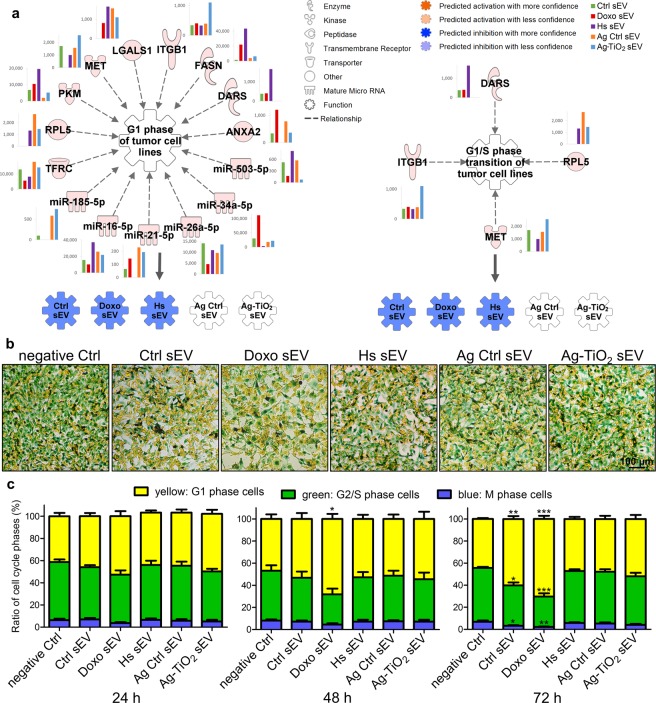
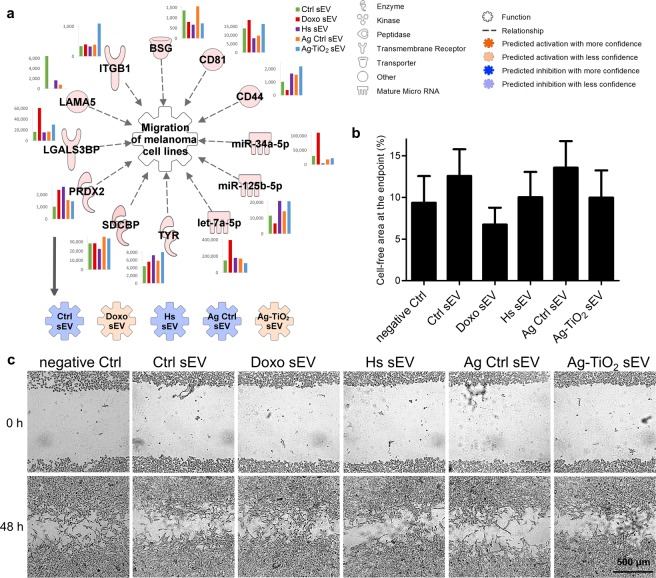
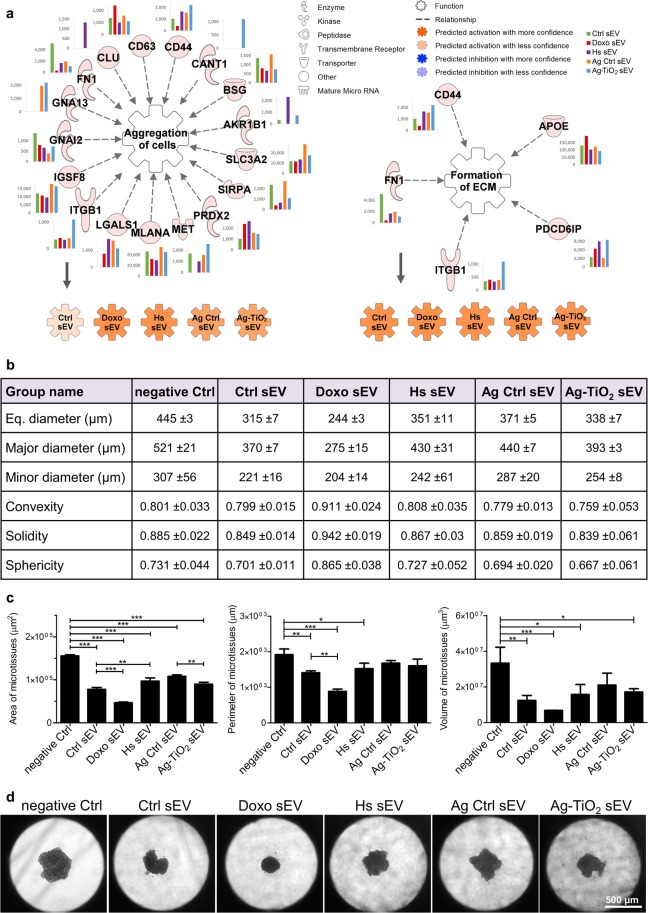
Exosomes are small extracellular vesicles (sEVs), playing a crucial role in the intercellular communication in physiological as well as pathological processes. Here, we aimed to study whether the melanoma-derived sEV-mediated communication could adapt to microenvironmental stresses. We compared B16F1 cell-derived sEVs released under normal and stress conditions, including cytostatic, heat and oxidative stress. The miRNome and proteome showed substantial differences across the sEV groups and bioinformatics analysis of the obtained data by the Ingenuity Pathway Analysis also revealed significant functional differences. The in silico predicted functional alterations of sEVs were validated by in vitro assays. For instance, melanoma-derived sEVs elicited by oxidative stress increased Ki-67 expression of mesenchymal stem cells (MSCs); cytostatic stress-resulted sEVs facilitated melanoma cell migration; all sEV groups supported microtissue generation of MSC-B16F1 co-cultures in a 3D tumour matrix model. Based on this study, we concluded that (i) molecular patterns of tumour-derived sEVs, dictated by the microenvironmental conditions, resulted in specific response patterns in the recipient cells; (ii) in silico analyses could be useful tools to predict different stress responses; (iii) alteration of the sEV-mediated communication of tumour cells might be a therapy-induced host response, with a potential influence on treatment efficacy.


Conflict of interest statement

The authors declare no competing interests.

Figures

Figure 1
Figure 1
Schematic illustration of the experimental workflow in six steps. B16F1 mouse melanoma cell-derived sEVs were isolated and characterised by Western Blot (WB), atomic force microscopy (AFM) and dynamic light scattering (DLS). Then B16F1 cultures were treated in five different ways, and 72 h supernatants were harvested for sEV isolation. Vesicle samples were then analysed by nanoparticle tracking analysis (NTA) to determine the number of released sEVs, sequencing and LC-MS/MS to describe their miRNome and proteome. Ingenuity Pathway Analysis (IPA) was used to analyse data and predict the functional differences between sEV groups. This in silico predictions were tested in vitro on mesenchymal stem cell (MSC) and melanoma cell cultures and MSC-B16F1 3D co-cultures as well using Ki-67-specific immunocytochemistry, Cell-Clock cell cycle assay, wound healing assay, and 3D hanging drop technology. Abbreviation: n.ctrl-negative control. Figure was created with BioRender.com.
Figure 2
Figure 2
Microenvironmental stress factors resulted in morphological changes and elevated vesicle production of melanoma cells. (a) Scanning electron micrograph of the differently treated melanoma cells. The top row of pictures was taken in 1,500 × magnification showing the different cell morphology after 24 h treatments. The bottom row of pictures was taken in 20,000 × magnification showing the distinct cell surface structures. (b) The number of counted exosome-sized vesicles on the surface of cells using ImageJ (n = 5). (c) Number of released vesicles/cell based on NanoSight measurements (n = 3). Each bar represents mean + SD; *p < 0.05, **p < 0.01 and ***p < 0.001 indicate statistical significance.
Figure 3
Figure 3
Stress factors caused unique molecular patterns of the melanoma-derived sEVs. (a,b) Results of the miRNA sequencing and whole proteome analysis by LC-MS/MS. Venn diagrams show the number of common and unique molecules of the different sEVs. Stacked bar graphs show the distribution of sEV molecules based on their changes compared to the appropriate control. (c) Classification of the common proteins for each sEV group based on their function and localisation in vesicles.
Figure 4
Figure 4
IPA showed that sEVs may influence many biological pathways and functions with different significance via their miRNA and protein content. (a) ‘Top 5 canonical pathways’ for each sEV group. Red values label the significance of pathways, which were not included in the Top 5. (b) ‘Top 5 molecular and cellular functions’ for each sEV group. Red values label the significance ranges of functions, which were not included in the Top 5. (cf) Heatmaps from the ‘Comparison analysis’ of the molecular content of vesicles. Relevant ‘Biofunctions’ with -log(p-value) > 5 were organised into four groups, namely intracellular, cellular, systemic and immune processes.
Figure 5
Figure 5
Stress-exposed melanoma cell-derived vesicles affected the proliferation of MSCs. (a) IPA predictions for the regulatory effects of sEV molecules on Ki-67 expression and ‘Proliferation of stem cells’. Networks show every upstream regulator proteins accompanied by a bar graph, which represents the normalised expression values of the molecule for each sEV group. Coloured symbols, named as the sEV groups, display the expected regulation changes of the analysed ‘Molecule’ and ‘Biofunction’ upon exposure to the vesicles. (b,c) Evaluation of the Ki-67-specific immunocytochemistry using an image analysis and machine learning software. (b) Images are representatives of the classified ones. Yellow and blue dots show the Ki-67 positive and negative nuclei, respectively. (c) Bar graphs show percentages of the Ki-67 positive cells 24 h (left panel) and 72 h (right panel) after sEV exposures. Each bar represents mean + SD (n = 4). (d) Cell numbers of the sEV-exposed cells after 24 h and 72 h incubation time. Bar graphs represent mean + SD values (n = 3), *p < 0.05 indicates statistical significance.
Figure 6
Figure 6
Ctrl and Doxo sEVs caused an arrest in G1 phase of melanoma cells. (a) IPA predictions for the regulatory effects of sEV molecules on the ‘G1 phase of tumour cell lines’ and ‘G1/S phase transition of tumour cell lines’. Networks show every upstream regulator proteins and miRNAs accompanied by a bar graph, which represents the normalised expression values of the molecule for each sEV group. Coloured symbols, named as the sEV groups, display the expected regulation changes of the analysed ‘Biofunctions’ upon exposure to the vesicles. (b,c) Cell-Clock cell cycle assay of sEV-exposed B16F1 cell cultures. (b) Representative images of the cell clock dye-labelled cultures. (c) Distribution of the yellow, green and blue cells in the cell cultures, which labels the G1, G2/S and M phase cells, respectively. Each bar represents mean + SD (n = 4), *p < 0.05, **p < 0.01 and ***p < 0.001 indicate statistical significance.
Figure 7
Figure 7
Doxo sEVs enhanced the migration of melanoma cells. (a) IPA predictions for the regulatory effects of sEV molecules on the ‘Migration of melanoma cell lines’. Network shows every upstream regulator proteins and miRNAs accompanied by a bar graph, which represents the normalised expression values of the molecule for each sEV group. Coloured symbols, named as the sEV groups, display the expected regulation changes of the analysed ‘Biofunction’ upon exposure to the vesicles. (b,c) Wound healing assay of sEV-exposed B16F1 cell cultures. (b) The bar graph shows the result of the analysis of wound closures by the ImageJ wound healing tool. It represents mean + SD values (n = 8). (c) Representative images of the wounds after 48 h of sEV exposures.
Figure 8
Figure 8
All sEV groups facilitated microtissue generation. (a) IPA predictions for the regulatory effects of sEV molecules on the ‘Aggregation of cells’ and the ‘Formation of extracellular matrix’. Networks show every upstream regulator proteins and miRNAs accompanied by a bar graph, which represents the normalised expression values of the molecule for each sEV group. Coloured symbols, named as the sEV groups, display the expected regulation changes of the analysed ‘Biofunctions’ upon exposure to the vesicles. (b,c) Descriptive statistics of the 72 h B16F1-MSC microtissues resulted from image analysis using the AnaSP software. Eq. diameter means equivalent diameter, major and minor diameters are measured through centroid. Table contains mean ± SD values. Bar graphs show the area, perimeter and volume statistics of the generated microtissues (mean + SD, n = 3). Statistical evaluation was performed by Welch’s ANOVA test with Tukey’s HSD post-hoc test; *p < 0.05, **p < 0.01 and ***p < 0.001 indicate statistical significance. (d) Representative images of the generated microtissues after 72 h of sEV exposures.

References

    1. Kotrbová A, et al. TEM Exosome Analyzer: a computer-assisted software tool for quantitative evaluation of extracellular vesicles in transmission electron microscopy images. J Extracell Vesicles. 2019;8:1560808. doi: 10.1080/20013078.2018.1560808. - DOI - PMC - PubMed
    1. Yáñez-Mó M, et al. Biological properties of extracellular vesicles and their physiological functions. J Extracell Vesicles. 2015;4:27066. doi: 10.3402/jev.v4.27066. - DOI - PMC - PubMed
    1. Kolenda T, et al. Tumor microenvironment - Unknown niche with powerful therapeutic potential. Rep Pract Oncol Radiother. 2018;23:143–153. doi: 10.1016/j.rpor.2018.01.004. - DOI - PMC - PubMed
    1. Meehan K, Vella LJ. The contribution of tumour-derived exosomes to the hallmarks of cancer. Crit Rev Clin Lab Sci. 2016;53:121–131. doi: 10.3109/10408363.2015.1092496. - DOI - PubMed
    1. Javeed N, Mukhopadhyay D. Exosomes and their role in the micro-/macro-environment: a comprehensive review. J Biomed Res. 2017;31:386–394. doi: 10.7555/JBR.30.20150162. - DOI - PMC - PubMed

Publication types

MeSH terms