. 2019 Oct 25;9(1):15331.
doi: 10.1038/s41598-019-51857-8.

A Recent Systematic Increase in Vapor Pressure Deficit over Tropical South America

Affiliations

A Recent Systematic Increase in Vapor Pressure Deficit over Tropical South America

Armineh Barkhordarian et al. Sci Rep. .

Abstract

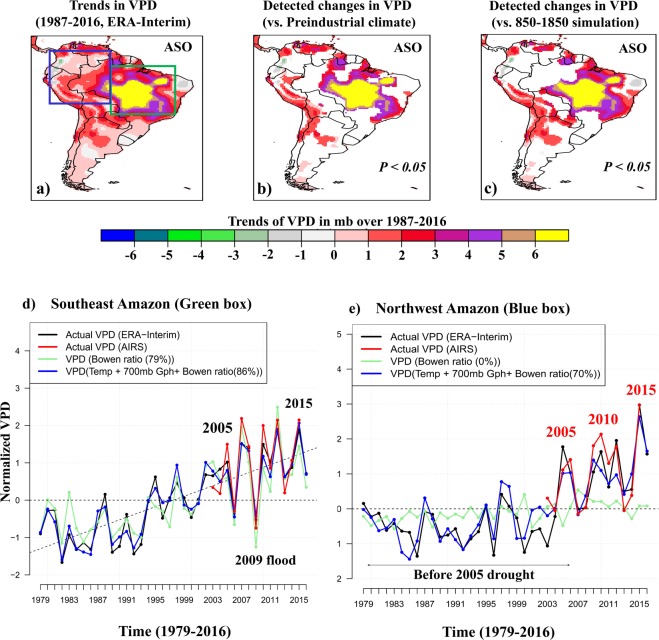
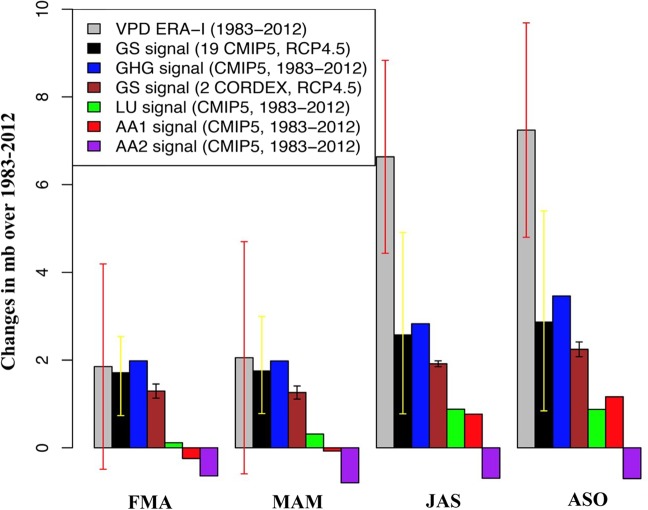
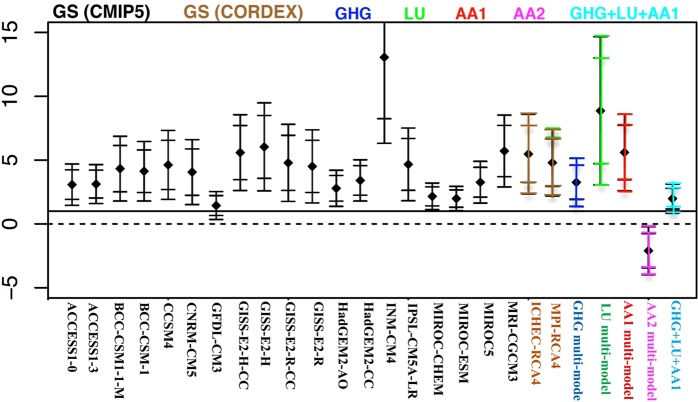
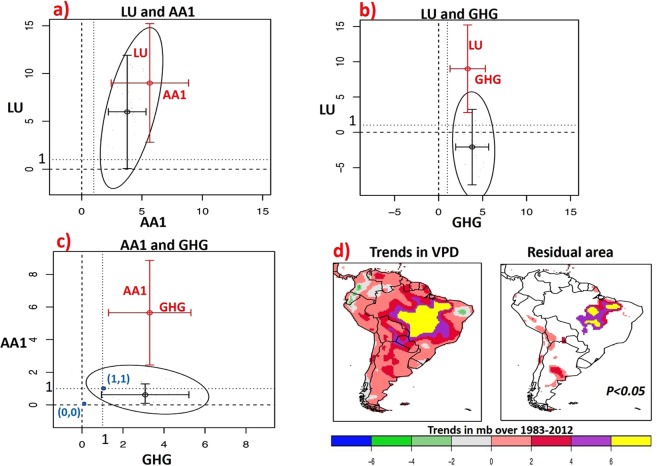
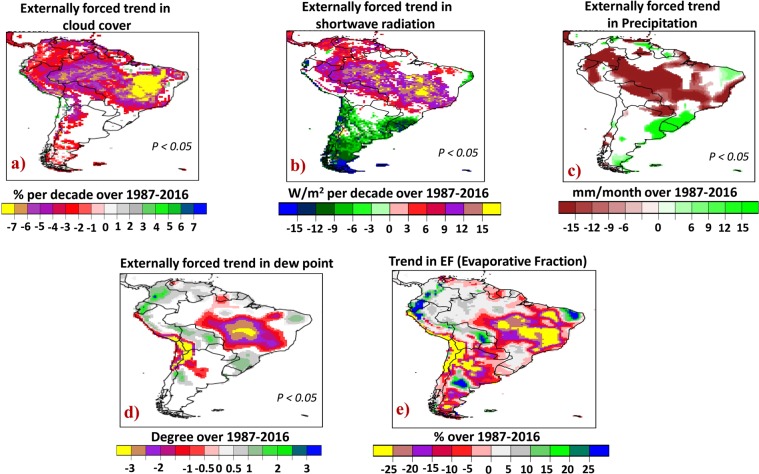
We show a recent increasing trend in Vapor Pressure Deficit (VPD) over tropical South America in dry months with values well beyond the range of trends due to natural variability of the climate system defined in both the undisturbed Preindustrial climate and the climate over 850-1850 perturbed with natural external forcing. This trend is systematic in the southeast Amazon but driven by episodic droughts (2005, 2010, 2015) in the northwest, with the highest recoded VPD since 1979 for the 2015 drought. The univariant detection analysis shows that the observed increase in VPD cannot be explained by greenhouse-gas-induced (GHG) radiative warming alone. The bivariate attribution analysis demonstrates that forcing by elevated GHG levels and biomass burning aerosols are attributed as key causes for the observed VPD increase. We further show that There is a negative trend in evaporative fraction in the southeast Amazon, where lack of atmospheric moisture, reduced precipitation together with higher incoming solar radiation (~7% decade-1 cloud-cover reduction) influences the partitioning of surface energy fluxes towards less evapotranspiration. The VPD increase combined with the decrease in evaporative fraction are the first indications of positive climate feedback mechanisms, which we show that will continue and intensify in the course of unfolding anthropogenic climate change.


Conflict of interest statement

The authors declare no competing interests.

Figures

Figure 1
Figure 1
Top: Detection of externally forced changes in VPD trends. Bottom: The effects of land surface and atmospheric conditions on VPD. (a) Trends in VPD derived from ERA-I during 1987–2016 in dry (ASO) months. (b) Regions where externally forced changes of VPD are detectable (in compare with 400 pseudo-realizations of unforced trends derived from 12,000-year Pre-industrial simulations). (c) Regions where anthropogenically forced changes of VPD are detectable (P < 0.05) in ASO (in comparison with 30 pseudo-realizations of naturally forced trends derived from 850–1850 simulations). Bottom: The time series of actual normalized VPD (i.e., minus mean and divided by the standard deviation) in ASO based on ERA-I reanalysis data (1979–2016, black), AIRS satellite data (2003–2016, red), and reconstructed VPD via linear regression model (d) over the southeast Amazon, (e) the northwest Amazon. The linear regression model is based on the Bowen ratio (proxy for energy partitioning), temperature (proxy for warming) and 700-mb geopotential height (proxy for large scale moisture transport). The percent variance explained by the regression model is noted.
Figure 2
Figure 2
Area mean change of VPD over southeast Amazon (green box in Fig. 1a) in comparison with the response of VPD to external climate drivers. Observed 30-year trends in VPD over southeast Amazon from 1983 to 2012 (mb over 30-years) for sliding 3-month windows (grey bars) in comparison with GS signal (RCP4.5 scenario) derived from 19 GCMs of CMIP5 (black bars), GS signal (RCP4.5 scenario) derived from 2 RCMs of CORDEX (brown bars), historical greenhouse-gas signal derived from multi-model ensemble mean (GHG, blue bars), Land-use change signal (LU, green bars), aerosols signal with (AA1, red bars), and without (AA2, purple bars) the “cloud lifetime effect” of aerosols. The red whiskers indicate the 95%-tile uncertainly range, derived from model-based estimate of natural (internal) variability (400 pseudo-realizations of unforced trends derived from 12,000-year Pre-industrial simulations). The whiskers on the black and brown bars show spread of trends of 19 GCMs and 2 RCMs, respectively. The blue, green, red and purple bars are derived from multi-model ensemble mean single forcing experiments. Externally forced changes are detectable in observed VPD trend (grey bars) where the red whiskers exclude zero.
Figure 3
Figure 3
One-dimensional (univariant) attribution over southeast Amazon. Scaling factors of observed VPD changes in ASO against 19 global GS signals (CMIP5) based on the RCP4.5 scenario (black bars), the regional GS signal derived from CORDEX (brown bars), the historical greenhouse-gas signal (GHG, blue bars), the land-use change signal (LU, green bar), the aerosols signal with (AA1, red bar) and without (AA2, purple bar) the “cloud-lifetime effect”, the combined signal from GHG, AA and LU (light blue bar). The whiskers show the 95th %-tile range of internal variability-generated uncertainties associated with scaling factors for the raw and double the model variance, derived from 12,000-year control simulations. Attribution is claimed in cases where the scaling factors are inconsistent with zero but consistent with one.
Figure 4
Figure 4
Two-dimensional (bivariant) attribution over the southeast Amazon and Residual area (incomplete attribution). The ellipses display the 90% of the estimated joint distribution of scaling factors for the (a) AA1&LU, (b) GHG&LU, (c) GHG&AA1 signals when observed data are regressed onto two signals simultaneously during 1983–2012. The black and red whiskers indicate the bivariate and univariate 1-dimensional 95th %-tile intervals of the internal variability-generated uncertainty for the two signals, respectively. Bivariant attribution is claimed in cases where the ellipse excludes the origin (0, 0) but the point (1, 1) lies inside the ellipse. (d) Residual area (incomplete attribution): Regions in Brazil’s “arc of deforestation” where externally forced changes are still detectable after removing the effect of GHG, LU and AA1 forcing (at 5% level).
Figure 5
Figure 5
Long-term trend in surface fluxes and parameters over 1987–2016. (a) Externally forced trend in total could cover in comparison with 400 pseudo-realizations of unforced trends derived from 12,000-year Pre-industrial simulations, (b) in downwelling shortwave radiation, (c) in precipitation and (d) in dew point. The trend detection is with less than 5% risk of error. (e) Trends in Evaporative Fraction (EF) over 1987–2016.

References

    1. Malhi Y, et al. Climate change, deforestation, and the fate of the Amazon. Science. 2008;319(5860):169–172. doi: 10.1126/science.1146961. - DOI - PubMed
    1. Cox PM, et al. Sensitivity of tropical carbon to climate change constrained by carbon dioxide variability. Nature. 2013;494(7437):341. doi: 10.1038/nature11882. - DOI - PubMed
    1. IPCC Climate Change 2013: The Physical Science Basis (eds Stocker, T. F. et al.) (Cambridge Univ. Press, 2013).
    1. Marengo J, et al. Two contrasting severe seasonal extremes in tropical South America in 2012: flood in Amazonia and drought in northeast Brazil. Journal of climate. 2013;26(22):9137–9154. doi: 10.1175/JCLI-D-12-00642.1. - DOI
    1. Cox PM, et al. Increasing risk of Amazonian drought due to decreasing aerosol pollution. Nature. 2009;453:212–215. doi: 10.1038/nature06960. - DOI - PubMed

Publication types