. 2020 May;27(5):1520-1538.
doi: 10.1038/s41418-019-0433-3. Epub 2019 Oct 25.

Autologous micrograft accelerates endogenous wound healing response through ERK-induced cell migration

Affiliations

Autologous micrograft accelerates endogenous wound healing response through ERK-induced cell migration

Martina Balli et al. Cell Death Differ. 2020 May.

Abstract

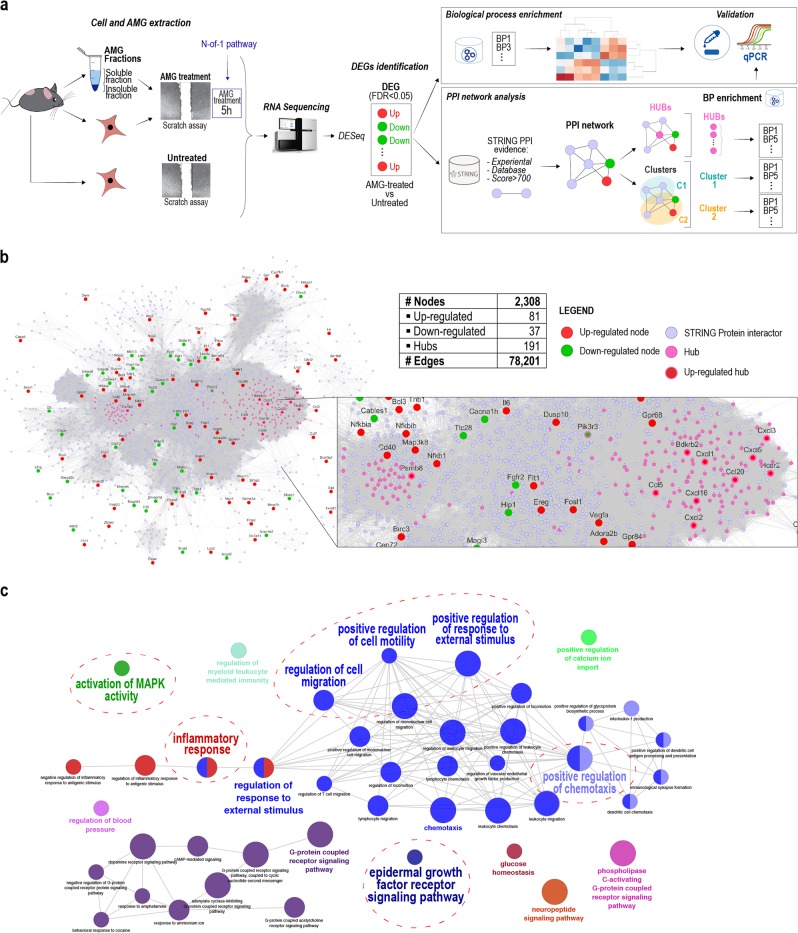
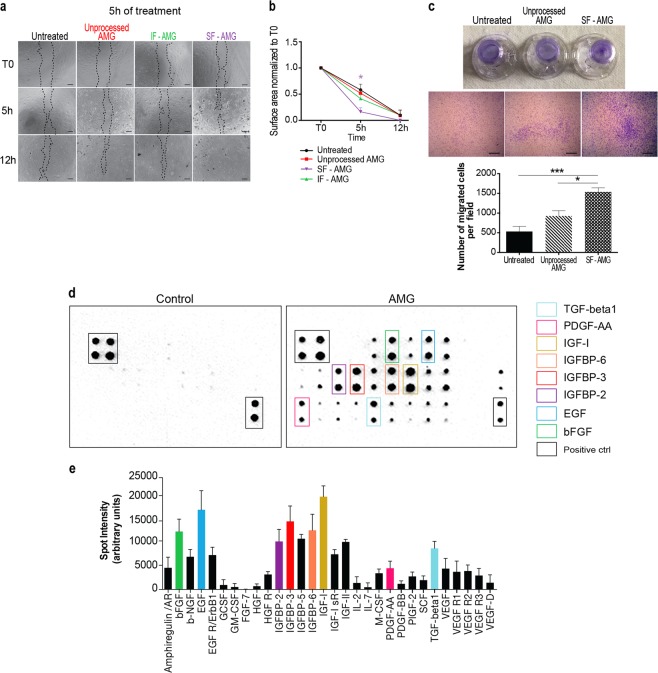
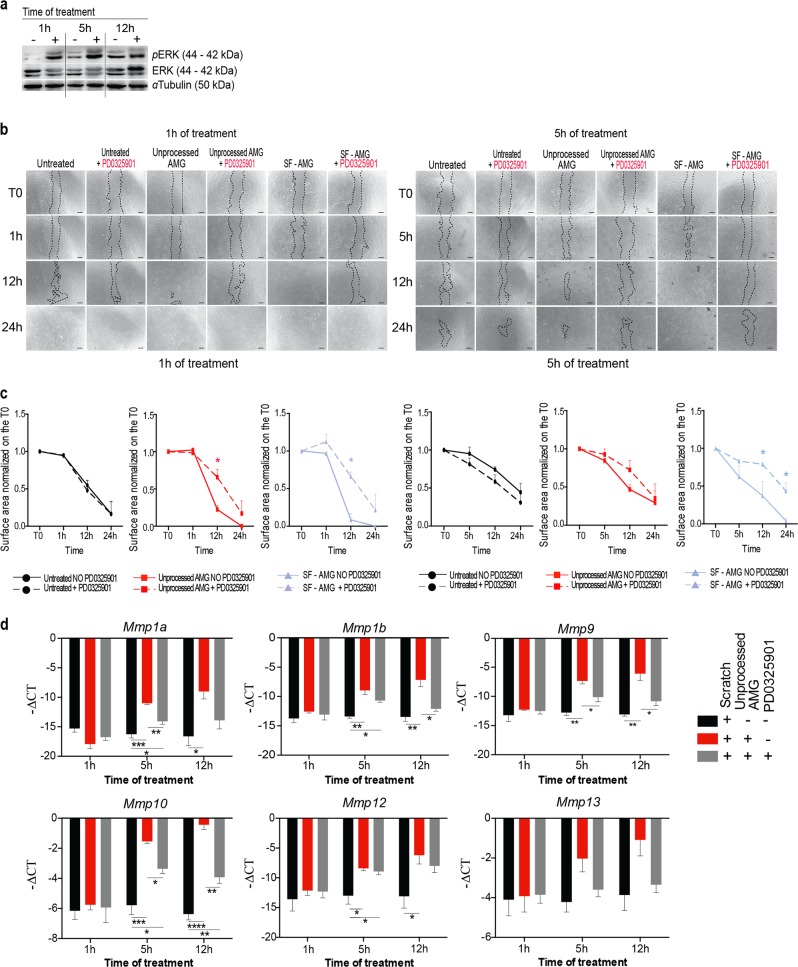
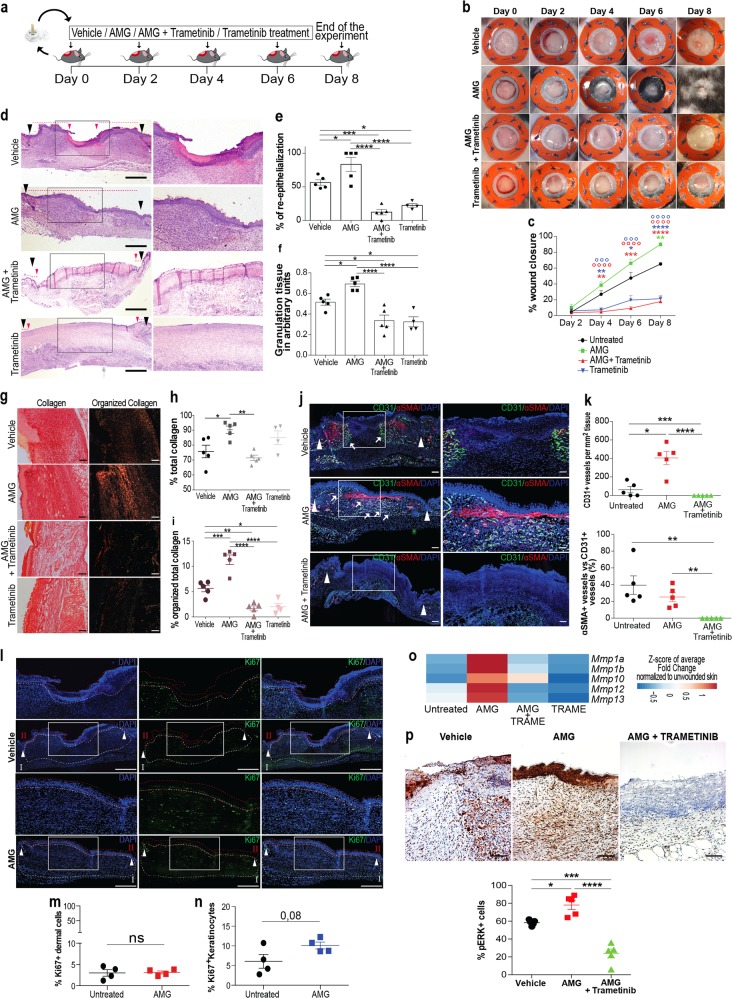
Defective cell migration causes delayed wound healing (WH) and chronic skin lesions. Autologous micrograft (AMG) therapies have recently emerged as a new effective and affordable treatment able to improve wound healing capacity. However, the precise molecular mechanism through which AMG exhibits its beneficial effects remains unrevealed. Herein we show that AMG improves skin re-epithelialization by accelerating the migration of fibroblasts and keratinocytes. More specifically, AMG-treated wounds showed improvement of indispensable events associated with successful wound healing such as granulation tissue formation, organized collagen content, and newly formed blood vessels. We demonstrate that AMG is enriched with a pool of WH-associated growth factors that may provide the starting signal for a faster endogenous wound healing response. This work links the increased cell migration rate to the activation of the extracellular signal-regulated kinase (ERK) signaling pathway, which is followed by an increase in matrix metalloproteinase expression and their extracellular enzymatic activity. Overall we reveal the AMG-mediated wound healing transcriptional signature and shed light on the AMG molecular mechanism supporting its potential to trigger a highly improved wound healing process. In this way, we present a framework for future improvements in AMG therapy for skin tissue regeneration applications.


Conflict of interest statement

The authors declare that they have no conflict of interest.

Figures

Fig. 1
Fig. 1
Comparative transcriptome analysis of primary murine fibroblasts upon AMG treatment. a Schematic representation of the strategy followed to reveal AMG-dependent mechanisms on fibroblasts. Transcriptome analysis via RNA-seq of AMG-treated and untreated murine primary fibroblasts led to the identification of AMG-related DEGs. Those genes were then used to perform a double strategy analysis: (1) Enrichment analysis of biological processes through GO and (2) PPI network analysis to predict DEGs-associated proteins and signaling pathways involved in the AMG molecular mechanism. b The Protein–Protein Interaction Network (PPI) referred to the list of DEGs observed upon AMG treatment and obtained by the STRING repository. DEGs are represented as red and green nodes of the network, based on their upregulated or downregulated expression, respectively. Hub nodes are presented as purple nodes shown in an enlarged view. c Hub related GO enrichment analysis with highlighted biological process playing essential roles in the WH process
Fig. 2
Fig. 2
AMG treatment increases migration capacity of murine primary fibroblasts. a Representative images (up) and quantification (down) of AMG-treated and untreated fibroblasts in a scratch wound assay. AMG was applied for different time periods (1, 5, 12, and 24 h). Cells treated with AMG for 5 and 12 h exhibited the quickest closure of the scratch wounds with a closure percentage of 77% ± 11% and 84% ± 8%, respectively at 24 h compared with untreated cells (48% ± 26%). Quantification averages of N = 4 for each time of treatment are reported below. Data are presented as mean ± SEM (standard error of the mean). Significant differences vs control are calculated multiple unpaired t test and indicated as *P < 0.05. Scale bar = 200 μm. b XTT assays were used to measure cell survival upon AMG-based treatment. Absorbance values (read at 450 nm) were normalized to the control group (untreated) and expressed as a fold change (N = 5). c Cell viability was evaluated by flow cytometry using the fixable viability stain 660. Percentage of viable cells upon 5 and 12 h of AMG treatment are reported. Statistical analyses were performed using two-tailed unpaired t test. No significant differences were found. (N = 3). d Cell cycle FACS analyses of AMG-treated growing fibroblasts upon 5 and 12 h of AMG treatment. EdU and PI staining was performed to detect cell cycle changes. Quantification average of N = 4 is reported. Data are presented as mean ± SEM. Multiple unpaired t test was used to perform statistical analysis. No significant differences were found between AMG-treated and untreated cells. e Representative immunofluorescence showing Ki67 levels from 5 and 12 h AMG-treated primary growing fibroblasts. Nuclei were counterstained with Hoechst 33342. ns Not significant, (N = 3). Scale bar = 100 μm. f Macro- and microscopic observation of untreated and AMG-treated transwell chambers. Migrated cells were stained with crystal violet (0.1%), observed under a light microscope and analyzed using ImageJ software. Data are presented as mean ± SEM. P values were calculated using student t test (N = 4) *P < 0.05. Scale bar = 100 μm. g Representative immunofluorescence for ɑ-SMA protein localization (in red). Nuclei were stained with Hoechst (blue). Scale bar = 100 μm. h Representative western blotting showing ɑ-SMA protein level extracted from AMG-treated (+) or untreated (−) wounded murine fibroblasts. Quantification of band areas was determined by densitometry software and normalized to ɑ-Tubulin loading control. Significant differences were calculated using multiple unpaired t test (N = 3) and indicated as *P < 0.05
Fig. 3
Fig. 3
Characterization of AMG molecular fractions. a Representative image of scratch assay on AMG-treated (5 h) murine primary fibroblasts (unprocessed, insoluble—IF and soluble—SF AMG fractions). Scratched untreated cells were used as a control. At 5 h after treatment, untreated, or treated samples with unprocessed or IF-AMG fraction showed ~50% and 60% of wound closure with no significant differences between conditions. In contrast, SF-AMG fraction treatment showed 84% of wound closure with complete closure 12 h after in vitro wounding. Scale bar = 200 μm. b Quantification average for each time of treatment. Data are presented as mean ± SEM. Differences are calculated with one-way ANOVA (N = 3) and indicated as *P < 0.05. c Observation of transwell chambers after stimulation with the AMG treatment. Migrated cells were stained with crystal violet 0.1%, observed under a light microscope and analyzed using ImageJ software. Data were presented as mean ± SEM. Differences are calculated using one-way ANOVA followed by Tukey test (N = 4) and indicated as *P < 0.05; ***P < 0.005. Scale bar = 100 μm. d Representative images of mouse antibody array membrane showing presence of several growth factors within the AMG soluble fraction (right panel) compared with the PBS vehicle (left panel) (N = 4). e Analysis of the increase in spot intensity (in arbitrary units) is shown in the graph
Fig. 4
Fig. 4
AMG-based treatment triggers matrix metalloproteinase expression and enzymatic activity in murine primary fibroblasts. a Volcano plot showing up- (red dots) and down-regulated (light blue dots) genes altered by AMG treatment (5 h of stimulation). Gene values are reported as a Log2FoldChange (p value < 0.05). b MMP gene expression evaluated by RT-qPCR. Expression values are expressed as a -∆CT normalized on the expression of Gapdh, B-actin, and Rpl13a housekeeping genes (N = 3). Differences are calculated with multiple unpaired t test (N = 3) and indicated as *P < 0.05. c Enzymatic activity of MMP members present in cell supernatant was fluorometrically detected. Data are presented as Relative Fluorescence Units (RFU). Signals were evaluated 30 min after starting the reaction using a microplate reader with a filter set of Ex/Em = 485/535. The fluorescence signal obtained from each sample was normalized on the substrate control. Groups of wounded cells that did not receive any treatment were used as a control. d Representative images of scratch wound assays on monolayers of murine primary fibroblasts. AMG was applied on wounded cells with different conditions (unprocessed AMG and its soluble fraction) and for different time periods (1, 5, and 12 h). Each condition was also incubated with the MMPs inhibitor—Actinonin—20 μM for the same time periods of AMG treatment. Images were taken at the beginning (T0) and at regular intervals until wound closure was achieved. Scale bar = 200 μm. e Quantifications of AMG-treated cells with or without Actinonin are reported. Data are presented as mean ± SEM. Differences were calculated with multiple unpaired t test (N = 3) and indicated as *P < 0.05
Fig. 5
Fig. 5
ERK/MAPK signaling pathway is specifically activated by AMG treatment. a Representative western blotting out of three biological replicates showing protein level of phosphorylated and total ERK1/ERK2 from wounded fibroblasts upon AMG treatment. b Representative images of scratch wound assays. Unprocessed AMG and its soluble fraction (SF) were applied on wounded cells. Each condition was also incubated with the MEK inhibitor—PD0325901—1 μM for the same time periods of the AMG treatment. Wounded cells did not receive any treatment and were used as a control. Scale bar = 200 μm. c Quantifications of AMG-treated cells with or without PD0325901 for each time of treatment are reported. Data are presented as mean ± SEM. Significant differences vs control were calculated with multiple unpaired t test (N = 3) and indicated as *P < 0.05. d MMP gene expression evaluated by RT-qPCR upon AMG treatment and MEK inhibitor PD0325901 exposition. Expression values are expressed as a -∆CT normalized on the expression of Gapdh, B-actin, and Rpl13a housekeeping genes. Differences are calculated with one-way ANOVA (N = 3) and indicated as *P < 0.05; **P < 0.01; ***P < 0.005; ****P < 0.001
Fig. 6
Fig. 6
MG treatment promotes matrix remodeling through accelerated migration and enhanced MMP activity in keratinocytes. a Representative western blotting showing protein level of phosphorylated and total ERK1/ERK2 obtained from unwounded human keratinocytes upon 30 min, 1 and 5 h of MG treatment and in which we induced ERK inhibition (using the MEK inhibitor PD0325901—1 μM). b Representative images of MG-treated keratinocytes in a scratch wound assay. MG was applied for different time periods (5 and 12 h). Images were taken at the beginning (T0) and at regular intervals until closure was achieved. Each condition was also incubated with the MEK inhibitor—PD0325901—1 μM for the same time periods of the MG treatment. Wounded cells did not receive any treatment and were used as a control. Scale bar = 200 μm. c Quantifications of each time of treatment are reported in the graphs. Data are presented as mean ± SEM (standard error of the mean). Significant differences between control vs AMG are calculated with one-way ANOVA and indicated as *P < 0.05; **P < 0.01. Significant differences between AMG vs AMG + PD0325901 are calculated with one-way ANOVA and indicated as °P < 0.05; °°P < 0.01; °°°P < 0.005. Significant differences between control vs AMG + PD0325901 are calculated with one-way ANOVA and indicated as #P < 0.05; ##P < 0.01. (N = 3). d Observation of transwell chambers. Migrated cells were stained with crystal violet 0.1%, observed under a light microscope and analyzed using ImageJ software. Data were presented as mean ± SEM. Differences are calculated using one-way ANOVA (N = 4) and indicated as **P < 0.01. Scale bar = 100 μm. e Keratinocytes viability upon MG treatment was evaluated by flow cytometry using the fixable viability stain 660. Percentage of viable cells upon 5 and 12 h of AMG treatment are reported. Statistical analyses were performed using two-tailed unpaired t test. No significant differences were found between AMG-treated and untreated cells. (N = 3). f Ki67 staining analyses on AMG-treated keratinocytes (5 h and 12 h). Together with MG, the MEK inhibitor—PD0325901—was applied on human keratinocytes to assess ERK signaling involvement in cell proliferation. Untreated cells were used as controls. No differences in percentage of Ki67+ cells were evaluated in all the conditions under study. Data are presented as mean ± SEM. One-way ANOVA was used to perform statistical analysis (N = 3). g MMP gene expression evaluated by RT-qPCR in vehicle and 5 h AMG-treated in the presence or absence of PD0325901 1 μM. Expression values are expressed as a z-score of the average fold change (FC) normalized on the expression of GAPDH, B-ACTIN, and RPL13A housekeeping genes (N = 3). h MMP gene expression evaluated by RT-qPCR in vehicle and 12 h AMG-treated in the presence or absence of PD0325901 1 μM. Expression values are expressed as a z-score of the average fold change (FC) normalized on the expression of GAPDH, B-ACTIN, and RPL13A housekeeping genes (N = 3)
Fig. 7
Fig. 7
The in vivo healing potential of AMG through ERK signaling pathway. a Schematic representation of the in vivo WH study performed on C57BL/6 mice. Animals were topically treated with vehicle, AMG, and MEK inhibitor—trametinib (0.2 mg) on day 0, 2, 4, and 6. At the end of the experiment (day 8), skin wound samples were collected for further analyses. b Excisional wound-splinting assay showing the potential of AMG to improve wound closure in AMG-treated mice compared with the other conditions under study (vehicle, AMG + trametinib and trametinib). Moreover, two out of five AMG-treated animals showed hair surrounding the wounds. c Percentage of wound closure between the groups under study. d Representative hematoxylin and eosin (H&E) stained section on day 8 after wounding. Scale bar 500 μm. Arrowheads delimitate the wound area and 2x zoomed region of interest is reported on the right. Pink dotted lines and arrowheads delimitate the epithelial tongues. e, f Percentage (%) of re-epithelialization and granulation tissue formation expressed in arbitrary units (AU) among the evaluated groups. Re-epithelialization coverage in wounds treated with AMG reached 83% ± 10% compared with only 56% ± 4% in vehicle-treated mice. Percentage of GT formation of AMG-treated group was significantly higher (70% ± 2,7%) compared with the other conditions, suggesting increased fibroplasia in AMG-treated mice. g Representative Sirius Red (SR) stained section on day 8 after wounding. Scale bar 100 μm. h, i % of total collagen formation and % organized collagen on the total collagen was evaluated between the conditions. j Representative immunofluorescence of vehicle and AMG-treated wounds exposed or not to trametinib, showing presence of CD31 + and ɑ-SMA + vessels. Scale bar 200 μm. Arrowheads delimitate the wound area and 2x zoomed region of interest is reported on the right. Arrows indicate CD31 + vessels. k Number of CD31 + per mm2 tissue and ɑ-SMA coated CD31 + vessels were evaluated in the entire wound area. l Representative immunofluorescence of vehicle and AMG-treated wounds showing the presence of the proliferative marker Ki67. % of Ki67 + cells were evaluated in both dermal (White region—I) and epidermal (Red region—II) layers (N = 4). Scale bare 500 μm. Arrowheads delimitate the wound area and 2x zoomed region of interest is reported above the images. m No significant differences were found in the percentage of Ki67 + cells in the dermal layer. Two-tailed unpaired t test was used to perform statistical analysis. n Percentage of Ki67 + cells in the epidermal layer. Two-tailed unpaired t test was used to perform statistical analysis (p < 0,08). o MMP gene expression evaluated by RT-qPCR in vehicle and AMG-treated in presence or absence of trametinib. Expression values are expressed as a z-score of the average fold change (FC) normalized on the expression of Gapdh, B-actin, and Rpl13a housekeeping genes (N = 3). p Representative immunohistochemistry for pERK in vehicle and AMG-treated in presence or absence of trametinib. Scale bar 100 μm. Quantification of pERK+ cells (%) analyzed using QuPath software. All data are presented as mean ± SEM. Differences are calculated using one-way ANOVA (N = 5) and indicated as *P < 0.05; ***P < 0.005; ****P < 0.001

References

    1. Svolacchia F, De Francesco F, Trovato L, Graziano A, Ferraro GA. An innovative regenerative treatment of scars with dermal micrografts. J Cosmet Dermatol. 2016;15:245–53. - PubMed
    1. Lampinen M, Nummi A, Nieminen T, Harjula A, Kankuri E, Consortium A. Intraoperative processing and epicardial transplantation of autologous atrial tissue for cardiac repair. J Heart Lung Transplant. 2017;36:1020–2. - PubMed
    1. Marcarelli M, Trovato L, Novarese E, Riccio M, Graziano A. Rigenera protocol in the treatment of surgical wound dehiscence. Int Wound J. 2017;14:277–81. - PMC - PubMed
    1. De Francesco F, Graziano A, Trovato L, Ceccarelli G, Romano M, Marcarelli M, et al. A regenerative approach with dermal micrografts in the treatment of chronic ulcers. Stem Cell Rev. 2017;13:139–48. - PubMed
    1. Jimi S, Kimura M, De Francesco F, Riccio M, Hara S, Ohjimi H. Acceleration mechanisms of skin wound healing by autologous micrograft in mice. Int J Mol Sci. 2017;18:1675. - PMC - PubMed

Publication types

MeSH terms

Substances