. 2019 Oct 25:20:512-526.
doi: 10.1016/j.isci.2019.10.005. Epub 2019 Oct 4.

Recall Responses from Brain-Resident Memory CD8+ T Cells (bTRM) Induce Reactive Gliosis

Affiliations

Recall Responses from Brain-Resident Memory CD8+ T Cells (bTRM) Induce Reactive Gliosis

Sujata Prasad et al. iScience. .

Abstract

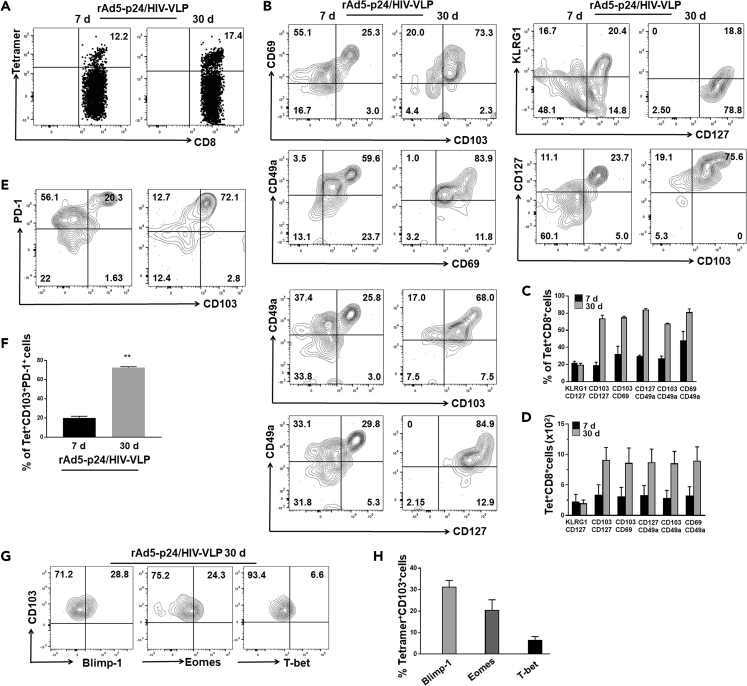
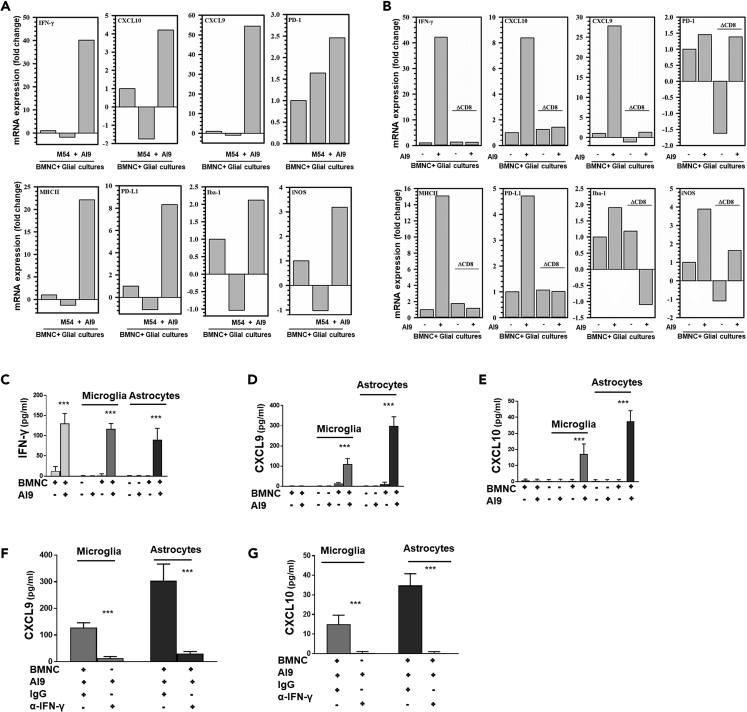
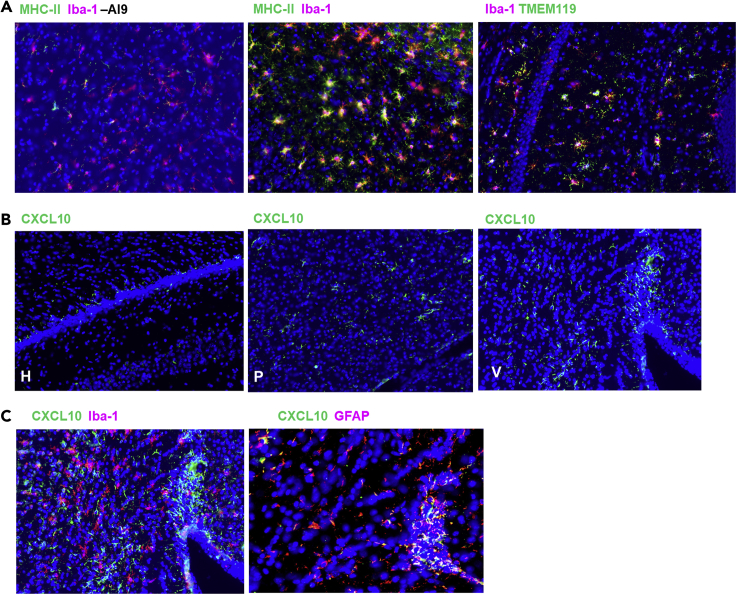
HIV-associated neurocognitive disorders (HAND) persist even during effective combination antiretroviral therapy (cART). Although the cause of HAND is unknown, studies link chronic immune activation, neuroinflammation, and cerebrospinal fluid viral escape to disease progression. In this study, we tested the hypothesis that specific, recall immune responses from brain-resident memory T cells (bTRM) could activate glia and induce neurotoxic mediators. To address this question, we developed a heterologous prime-central nervous system (CNS) boost strategy in mice. We observed that the murine brain became populated with long-lived CD8+ bTRM, some being specific for an immunodominant Gag epitope. Recall stimulation using HIV-1 AI9 peptide administered in vivo resulted in microglia displaying elevated levels of major histocompatibility complex class II and programmed death-ligand 1, and demonstrating tissue-wide reactive gliosis. Immunostaining further confirmed this glial activation. Taken together, these results indicate that specific, adaptive recall responses from bTRM can induce reactive gliosis and production of neurotoxic mediators.

Keywords: Immune System Disorder; Immunology; Neuroscience; Virology.


Conflict of interest statement

The authors declare no competing interests.

Figures

None
Graphical abstract
Figure 1
Figure 1
Lymphocyte Infiltration into the Brain and Long-Term Presence of Ag-Specific CD8+ T Cells following Heterologous Prime-CNS Boost (A) Schematic of the experimental model illustrates intravenous delivery of recombinant adenovirus vectors expressing HIV-1 p24 capsid protein (rAD5-p24), followed by a CNS-boost consisting of intracranial injection of HIV-VLPs into the striatum. BMNC were collected at 7 and 30 days post prime-boost. (B) Flow cytometric analysis demonstrating lymphocyte infiltration and CD8+ T cell retention within the brain following heterologous CNS boost. (C) Absolute numbers of CD8+ T cells were determined within brains of animals at the indicated time points. (D) Dot plot comparing the frequencies of AI9 tetramer-specific CD8+ T cells in brain tissue isolated from rAd5-p24/Sal (saline) and rAd5-p24/HIV-VLP groups. (E) Bar graph presents absolute numbers of T cells between groups. Pooled data are presented as mean ± SD of two independent experiments using four to six animals per group per time point. **p < 0.01
Figure 2
Figure 2
Phenotypic Characterization of Ag-Specific TRM within the Brain (A and B) CNS-derived lymphocytes were gated for AI9-specific CD8+ T cells and analyzed for the indicated memory cell markers (CD127, CD103, CD69, CD49a), as well as the short-lived effector marker KLRG1. (C and D) Bar graphs present pooled frequencies and number of Ag-specific cells that expressed the indicated phenotypic markers. (E) Additional contour plots show PD-1 expression on these Ag-specific CD103+ CD8+ T cells at 7 and 30 days post prime-boost. (F) Pooled data show frequency of PD-1 expression on Ag-specific CD103+CD8+ T cells at the indicated time points. **p < 0.01. (G) Representative plots show expression of transcription factors Blimp-1, Eomes, and T-bet at the indicated time point. (H) Pooled data present percentage of Blimp-1, Eomes, and T-bet expression. Graph presents data combined from two separate experiments using four to six animals per group per time point.
Figure 3
Figure 3
Ag-Specific CD103+CD8+ T Cells Display Recall Responses BMNC obtained from animals at 30 days post prime-CNS boost were either restimulated ex vivo with AI9 peptide or left unstimulated, and intracellular staining was performed. Gated CD103+CD8+ T cells were assessed for cytokine production in response to peptide stimulation. (A) Representative contour plots present expression of IFN-γ and IL-2 by CD103+CD8+ T cells. (B) Bar graph of pooled data shows frequencies of IFN-γ production by CD103+CD8+ T cells, as well as simultaneous detection of IFN-γ and IL-2 double-producer cells. (C) Contour plots show TNF-α production by CD103+CD8+ T cells. (D) Pooled data show the frequency of TNF-α production. (E) Representative contour plots of granzyme B show ex vivo production of this cytotoxic mediator in response to peptide stimulation. (F) Data presented show percentage of granzyme B-producing CD103+CD8+ T cells. (G) Contour plots following Ki67 staining show proliferation frequencies of CD103+CD8+ T cells, either with or without peptide stimulation. (H) Pooled data present percentage proliferation of bTRM. **p < 0.01 and ***p < 0.001
Figure 4
Figure 4
Specific Ex Vivo Peptide Restimulation of T Cells Activates Primary Glial Cells (A) BMNC isolated from brains of 30 days post prime-boost animals were co-cultured with primary murine glial cells (40% microglia; 60% astrocytes). Cells were either treated with HIV-specific AI9 or MCMV M54 T cell epitope peptides or left untreated for 24 h. Real-time PCR data show mRNA expression levels of IFN-γ, MHC-II, PD-L1, PD-1, Iba-1, CXCL9, CXCL10, and nitric oxide synthase (iNOS) under the indicated treatment. (B–G) (B) Cultures with or without the CD8 T cell population were either stimulated with AI9 peptide or left unstimulated for 1 h before being co-cultured with mixed glial cells (40% microglia; 60% astrocytes) for 24 h. qPCR data presenting transcript levels of IFN-γ, MHC-II, PD-L1, PD-1, Iba-1, CXCL9, CXCL10, and iNOS under the indicated treatment. Data shown are representative of two separate experiments. Supernatants from AI9-stimulated or unstimulated BMNC co-cultured either with microglial cells or astrocytes were collected at 48 h and ELISA was performed for IFN- γ (C), CXCL9 (D), and CXCL10 (E). Blocking of IFN-γ using a neutralizing anti-IFN-γ antibody inhibited CXCL9 (F) and CXCL10 (G) expression. The results shown are from pooled data of two independent experiments. ***p < 0.001.
Figure 5
Figure 5
In Vivo Recall Responses Stimulate Proliferation of Brain-Resident HIV-Specific CD8+ T Cells BMNC obtained from prime-CNS boost animals were collected and evaluated using flow cytometry at the indicated time points following in vivo peptide restimulation. (A) Schematic representation of experimental approach to evaluate in vivo recall responses. The AI9 peptide, an irrelevant T cell epitope peptide (M54), or saline were injected into the brain and tissues were collected at 2 and 5 days post-restimulation. (B) Dot plots show tetramer-specific CD8+ T cells in the brain at 2 days post-peptide restimulation. (C) Bar graph presents numbers of HIV-specific CD8+ T cells following the indicated restimulation. (D) Contour plots present Ki67 expression on CD103+CD8+ T cells at 2 days post-restimulation with cognate peptide. (E) Bar graph represents the pooled frequencies of Ki67-expressing CD103+CD8+ T cells. Data are presented as mean ± SD of two independent experiments using four animals in control or irrelevant peptide groups and six animals following AI9 restimulation. **p < 0.01
Figure 6
Figure 6
In Vivo Recall Responses by bTRM Induce Microglial Cell Activation Flow cytometry and IHC staining were performed on brain tissue obtained from mice following prime-CNS boost. (A) Contour plots present expression of MHC-II on CD45int/CD11b+ microglia at 7 and 30 days post prime-CNS boost. (B) Pooled data show the frequencies of MHC-II expression at the indicated time points both pre- and post-recall restimulation via intracranial injection of AI9 peptide. (C) Contour plots present expression of PD-L1 on stimulated CD45int/CD11b+ microglial cells at 7 and 30 days post prime-boost. (D) Bar graph presented shows frequencies of PD-L1 expression at the indicated time points both pre- and post-restimulation. (E) Representative contour plots show percentage of microglia expressing MHC-II at 2 and 5 days post in vivo AI9 restimulation. (F) Representative contour plots show the percentage of microglial cells expressing PD-L1 at 2 and 5 days post in vivo restimulation. Data presented are mean ± SD of two independent experiments using six animals in control and irrelevant peptide groups at all time points and six to eight animals in the AI9 restimulation group at 7- and 30-day time points, respectively. ***p < 0.001.
Figure 7
Figure 7
Recall Responses from bTRM Cells Induce Reactive Glial Cell Phenotypes (A) Dual IHC staining of brain sections obtained from animals at 2 days post-AI9 restimulation for MHC-II and Iba-1, as well as Iba-1 and TMEM119. (B) IHC staining displaying expression of CXCL10 in the hippocampus (H), parenchyma (P), and ventricle (V) of AI9-restimulated animals. (C) Images of CXCL10 co-staining with Iba-1, as well as co-expression of CXCL10 and GFAP.

References

    1. Ariotti S., Hogenbirk M.A., Dijkgraaf F.E., Visser L.L., Hoekstra M.E., Song J.Y., Jacobs H., Haanen J.B., Schumacher T.N. T cell memory. Skin-resident memory CD8(+) T cells trigger a state of tissue-wide pathogen alert. Science. 2014;346:101–105. - PubMed
    1. Bengsch B., Spangenberg H.C., Kersting N., Neumann-Haefelin C., Panther E., von Weizsacker F., Blum H.E., Pircher H., Thimme R. Analysis of CD127 and KLRG1 expression on hepatitis C virus-specific CD8+ T cells reveals the existence of different memory T-cell subsets in the peripheral blood and liver. J. Virol. 2007;81:945–953. - PMC - PubMed
    1. Bird L. Lymphocyte responses: Hunker down with HOBIT and BLIMP1. Nat. Rev. Immunol. 2016;16:338–339. - PubMed
    1. Blais V., Rivest S. Effects of TNF-alpha and IFN-gamma on nitric oxide-induced neurotoxicity in the mouse brain. J. Immunol. 2004;172:7043–7052. - PubMed
    1. Boska M.D., Dash P.K., Knibbe J., Epstein A.A., Akhter S.P., Fields N., High R., Makarov E., Bonasera S., Gelbard H.A. Associations between brain microstructures, metabolites, and cognitive deficits during chronic HIV-1 infection of humanized mice. Mol. Neurodegener. 2014;9:58. - PMC - PubMed