

Interpreting HIV diagnostic histories into infection time estimates: analytical framework and online tool
- PMID: 31655566
- PMCID: PMC6815418
- DOI: 10.1186/s12879-019-4543-9
Interpreting HIV diagnostic histories into infection time estimates: analytical framework and online tool
Abstract
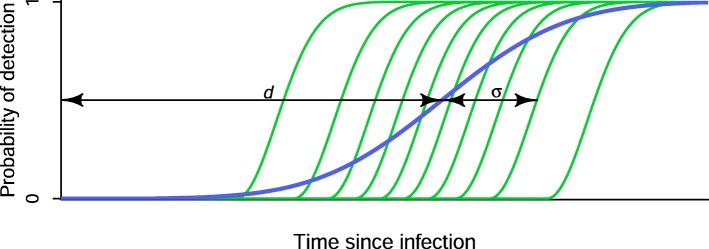
Background: It is frequently of epidemiological and/or clinical interest to estimate the date of HIV infection or time-since-infection of individuals. Yet, for over 15 years, the only widely-referenced infection dating algorithm that utilises diagnostic testing data to estimate time-since-infection has been the 'Fiebig staging' system. This defines a number of stages of early HIV infection through various standard combinations of contemporaneous discordant diagnostic results using tests of different sensitivity. To develop a new, more nuanced infection dating algorithm, we generalised the Fiebig approach to accommodate positive and negative diagnostic results generated on the same or different dates, and arbitrary current or future tests - as long as the test sensitivity is known. For this purpose, test sensitivity is the probability of a positive result as a function of time since infection.
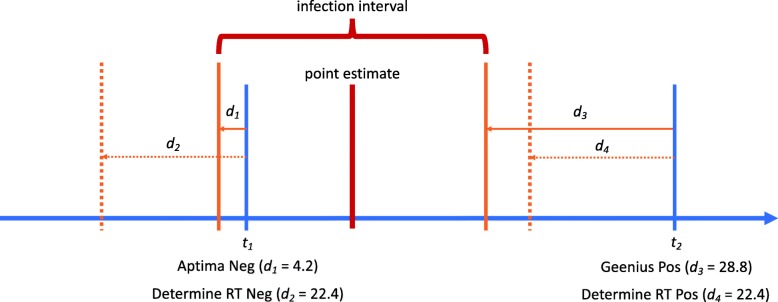
Methods: The present work outlines the analytical framework for infection date estimation using subject-level diagnostic testing histories, and data on test sensitivity. We introduce a publicly-available online HIV infection dating tool that implements this estimation method, bringing together 1) curatorship of HIV test performance data, and 2) infection date estimation functionality, to calculate plausible intervals within which infection likely became detectable for each individual. The midpoints of these intervals are interpreted as infection time 'point estimates' and referred to as Estimated Dates of Detectable Infection (EDDIs). The tool is designed for easy bulk processing of information (as may be appropriate for research studies) but can also be used for individual patients (such as in clinical practice).
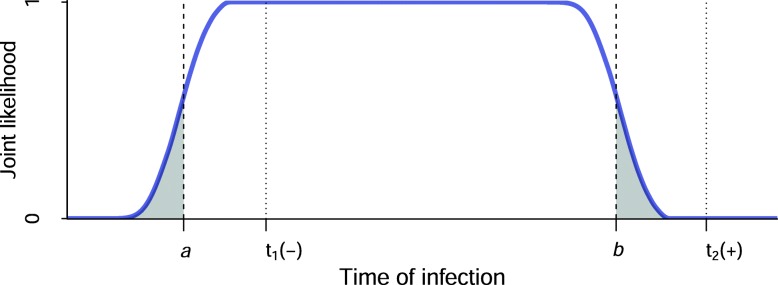
Results: In many settings, including most research studies, detailed diagnostic testing data are routinely recorded, and can provide reasonably precise estimates of the timing of HIV infection. We present a simple logic to the interpretation of diagnostic testing histories into infection time estimates, either as a point estimate (EDDI) or an interval (earliest plausible to latest plausible dates of detectable infection), along with a publicly-accessible online tool that supports wide application of this logic.
Conclusions: This tool, available at https://tools.incidence-estimation.org/idt/ , is readily updatable as test technology evolves, given the simple architecture of the system and its nature as an open source project.
Keywords: Diagnostic assays; Diagnostics; HIV; Infection dating; Infection duration; Infection timing.
Conflict of interest statement
The authors declare that they have no competing interests.
Figures
References
-
- Kassanjee R. Characterisation and application of tests for recent infection for HIV incidence surveillance. Johannesburg: University of the Witwatersrand; 2014.
