

Incorporating repeated measurements into prediction models in the critical care setting: a framework, systematic review and meta-analysis
- PMID: 31655567
- PMCID: PMC6815391
- DOI: 10.1186/s12874-019-0847-0
Incorporating repeated measurements into prediction models in the critical care setting: a framework, systematic review and meta-analysis
Abstract
Background: The incorporation of repeated measurements into multivariable prediction research may greatly enhance predictive performance. However, the methodological possibilities vary widely and a structured overview of the possible and utilized approaches lacks. Therefore, we [1] propose a structured framework for these approaches, [2] determine what methods are currently used to incorporate repeated measurements in prediction research in the critical care setting and, where possible, [3] assess the added discriminative value of incorporating repeated measurements.
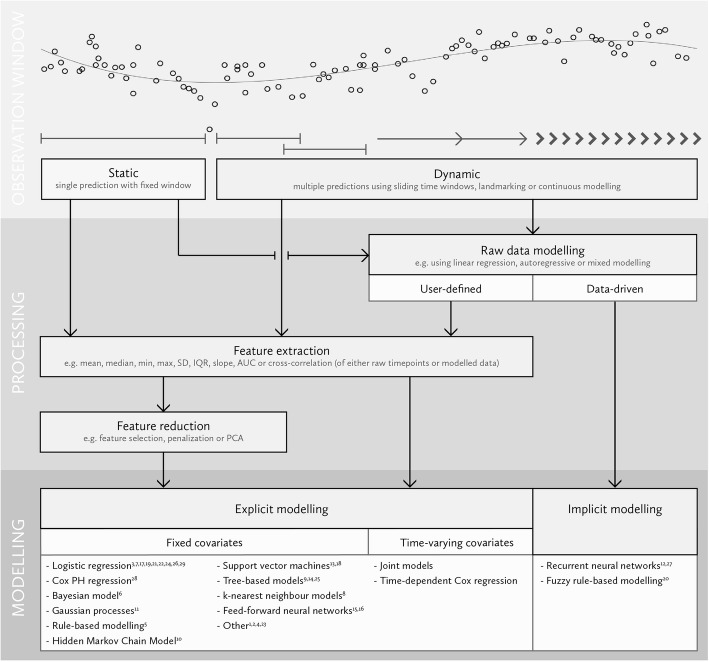
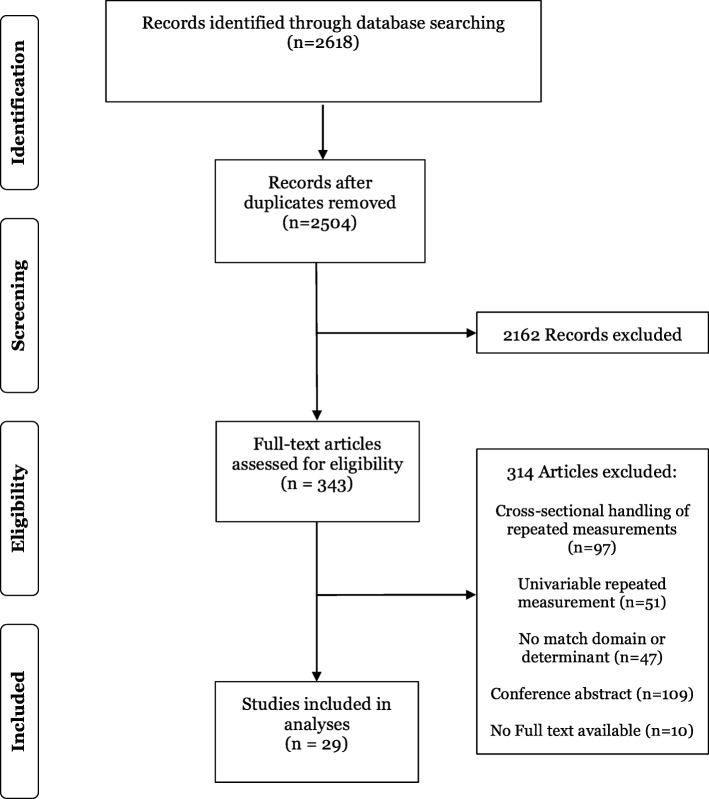
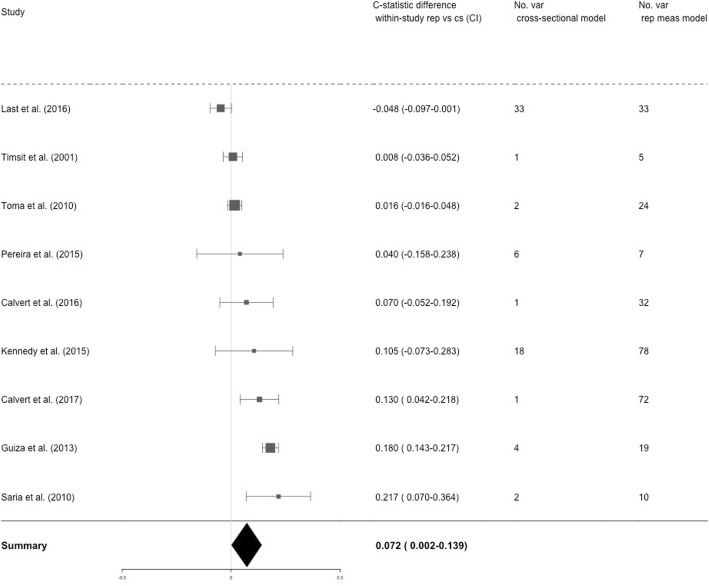
Methods: The proposed framework consists of three domains: the observation window (static or dynamic), the processing of the raw data (raw data modelling, feature extraction and reduction) and the type of modelling. A systematic review was performed to identify studies which incorporate repeated measurements to predict (e.g. mortality) in the critical care setting. The within-study difference in c-statistics between models with versus without repeated measurements were obtained and pooled in a meta-analysis.
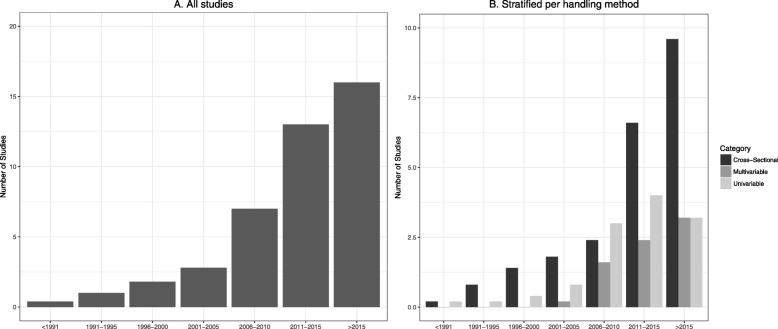
Results: From the 2618 studies found, 29 studies incorporated multiple repeated measurements. The annual number of studies with repeated measurements increased from 2.8/year (2000-2005) to 16.0/year (2016-2018). The majority of studies that incorporated repeated measurements for prediction research used a dynamic observation window, and extracted features directly from the data. Differences in c statistics ranged from - 0.048 to 0.217 in favour of models that utilize repeated measurements.
Conclusions: Repeated measurements are increasingly common to predict events in the critical care domain, but their incorporation is lagging. A framework of possible approaches could aid researchers to optimize future prediction models.
Conflict of interest statement
The authors declare that they have no competing interests.
Figures
References
-
- Harrell FE. Regression modeling strategies: with applications to linear models, logistic regression, and survival analysis. New York: Springer-Verlag New York, Inc.; 2001.
-
- Moreno RP, Metnitz PGH, Almeida E, Jordan B, Bauer P, Abizanda Campos R, Iapichino G, Edbrooke E, Capuzzo M, Le Gall JR. SAPS 3—from evaluation of the patient to evaluation of the intensive care unit. Part 2: development of a prognostic model for hospital mortality at ICU admission. Intensive Care Med. 2005;31:1345–1355. doi: 10.1007/s00134-005-2763-5. - DOI - PMC - PubMed
Publication types
MeSH terms
LinkOut - more resources
Full Text Sources
Medical
