

Experimental manipulations of behavioral economic demand for addictive commodities: a meta-analysis
- PMID: 31656048
- PMCID: PMC7156308
- DOI: 10.1111/add.14865
Experimental manipulations of behavioral economic demand for addictive commodities: a meta-analysis
Erratum in
-
Experimental manipulations of behavioral economic demand for addictive commodities: a meta-analysis.Addiction. 2022 Aug;117(8):2367. doi: 10.1111/add.15948. Epub 2022 May 29. Addiction. 2022. PMID: 35644873 No abstract available.
Abstract
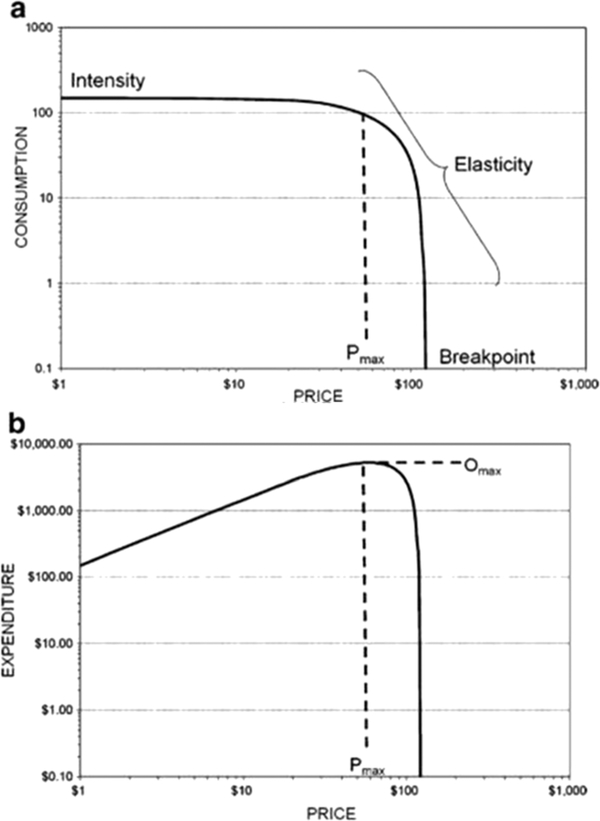
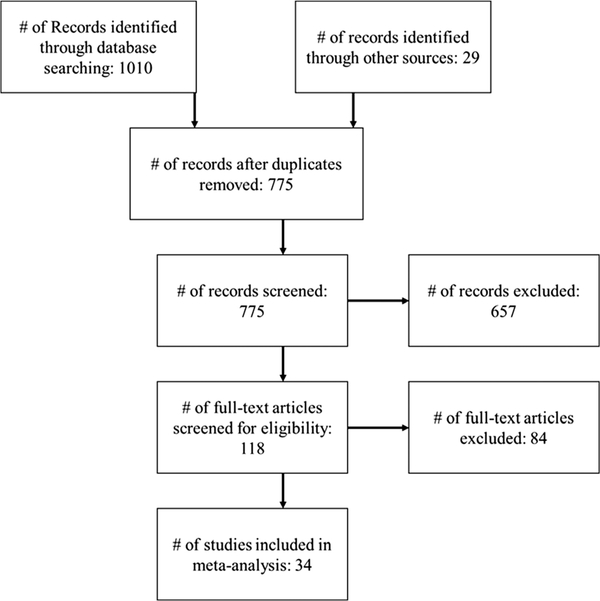
Background and aims: Reinforcing value, an index of motivation for a drug, is commonly measured using behavioral economic purchase tasks. State-oriented purchase tasks are sensitive to phasic manipulations, but with heterogeneous methods and findings. The aim of this meta-analysis was to characterize the literature examining manipulations of reinforcing value, as measured by purchase tasks and multiple-choice procedures, to inform etiological models and treatment approaches METHODS: A random-effects meta-analysis of published findings in peer-reviewed articles. Following the Preferred Reporting Items for Systematic Reviews and Meta-Analysis (PRISMA) protocol, studies were gathered through searches in PsycINFO and PubMed/MEDLINE (published 22 May 2018). Searches returned 34 unique studies (aggregate sample n = 2402; average sample size = 68.94) yielding 126 effect sizes. Measurements included change (i.e. Cohen's d) in six behavioral economic indices (intensity, breakpoint, Omax , Pmax , elasticity, cross-over point) in relation to six experimental manipulations (cue exposure, stress/negative affect, reinforcer magnitude, pharmacotherapy, behavioral interventions, opportunity cost).
Results: Cue exposure (d range = 0.25-0.44, all Ps < 0.05) and reinforcer magnitude [d = 0.60; 95% confidence interval (CI) = 0.18, 1.01; P < 0.005] manipulations resulted in significant increases in behavioral economic demand across studies. Stress/negative affect manipulations also resulted in a small, significant increase in Omax (d = 0.18; 95% CI = 0.01, 0.34; P = 0.03); all other effect sizes for negative affect/stress were non-significant, albeit similar in size (d range = 0.14-0.18). In contrast, pharmacotherapy (d range = -0.37 to -0.49; Ps < 0.04), behavioral intervention (d = -0.36 to -1.13) and external contingency (d = -1.42; CI = -2.30, -0.54; P = 0.002) manipulations resulted in a significant decrease in intensity. Moderators (substance type) explained some of the heterogeneity in findings across meta-analyses.
Conclusions: In behavioral economic studies, purchase tasks and multiple-choice procedures appear to provide indices that are sensitive to manipulations found to influence motivation to consume addictive substances in field experiments.
Keywords: Alcohol purchase task; behavioral economics; behavioral intervention; craving; cue exposure; demand; pharmacotherapy; reinforcer pathology; reinforcing value; stress.
© 2019 Society for the Study of Addiction.
Conflict of interest statement
Declaration of interests
The authors declare no conflicts of interest, except for J.M. who is a principal in BEAM Diagnostics, Inc.
Figures
References
-
- Murphy JG, MacKillop J Relative reinforcing efficacy of alcohol among college student drinkers. Exp Clin Psychopharmacol 2006; 14: 219–27. - PubMed
-
- Petry NM, Bickel WK Polydrug abuse in heroin addicts: a behavioral economic analysis. Addiction 1998; 93: 321–5. - PubMed
-
- Petry NM, Bickel WK Can simulations studies substitute for reality? Addiction 1998; 93: 605.
-
- Kaplan BA, Foster RNS, Reed DD, Amlung M, Murphy JG, Mackillop J Understanding alcohol motivation using the alcohol purchase task: a methodological systematic review. Drug Alcohol Depend 2018; 191: 117–40. - PubMed
Publication types
MeSH terms
Grants and funding
LinkOut - more resources
Full Text Sources
Medical
