. 2019 Nov;9(11):387.
doi: 10.1007/s13205-019-1919-x. Epub 2019 Oct 5.

Generation of semi-dwarf rice (Oryza sativa L.) lines by CRISPR/Cas9-directed mutagenesis of OsGA20ox2 and proteomic analysis of unveiled changes caused by mutations

Affiliations

Generation of semi-dwarf rice (Oryza sativa L.) lines by CRISPR/Cas9-directed mutagenesis of OsGA20ox2 and proteomic analysis of unveiled changes caused by mutations

Yue Han et al. 3 Biotech. 2019 Nov.

Abstract

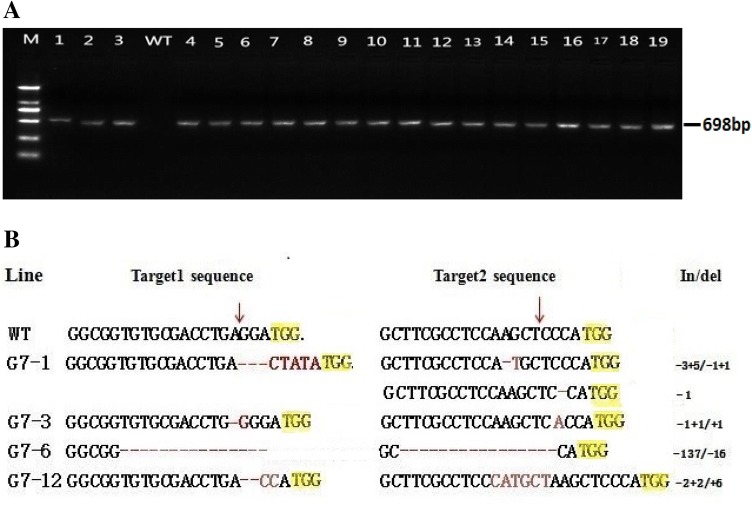
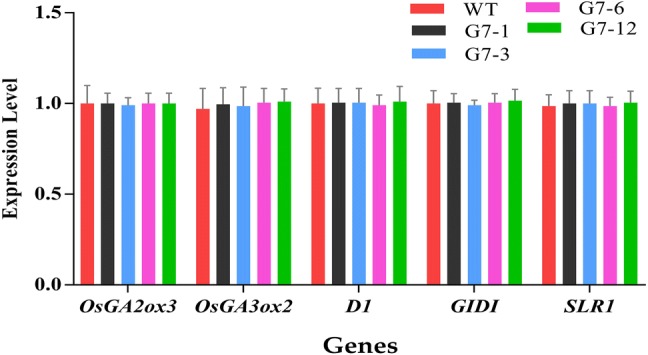
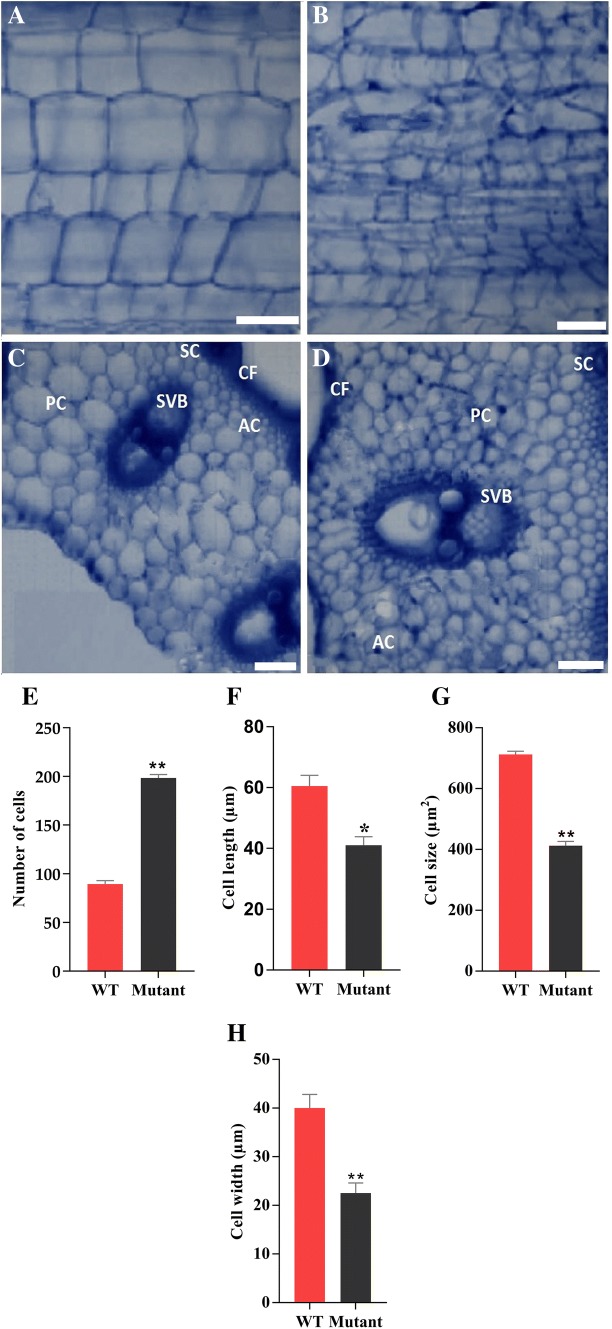
Plant height (PH) is one of the most important agronomic traits of rice, as it directly affects the yield potential and lodging resistance. Here, semi-dwarf mutant lines were developed through CRISPR/Cas9-based editing of OsGA20ox2 in an indica rice cultivar. Total 24 independent lines were obtained in T0 generation with the mean mutation rate of 73.5% including biallelic (29.16%), homozygous (47.91%) and heterozygous (16.66%) mutations, and 16 T-DNA-free lines (50%) were obtained in T1 generation without off-target effect in four most likely sites. Mutations resulted in a changed amino acid sequence of mutant plants and reduced gibberellins (GA) level and PH (22.2%), flag leaf length (FLL) and increased yield per plant (YPP) (6.0%), while there was no effect on other agronomic traits. Mutants restored their PH to normal by exogenous GA3 treatment. The expression of the OsGA20ox2 gene was significantly suppressed in mutant plants, while the expression level was not affected for other GA biosynthesis (OsGA2ox3 and OsGA3ox2) and signaling (D1, GIDI and SLR1) genes. The mutant lines showed decreased cell length and width, abnormal cell elongation, while increased cell numbers in the second internode sections at mature stage. Total 30 protein spots were exercised, and 24 proteins were identified, and results showed that OsGA20ox2 editing altered protein expression. Five proteins including, glyceraldehyde-3-phosphate dehydrogenase, putative ATP synthase, fructose-bisphosphate aldolase 1, S-adenosyl methionine synthetase 1 and gibberellin 20 oxidase 2, were downregulated in dwarf mutant lines which may affect the plant growth. Collectively, our results provide the insights into the role of OsGA20ox2 in PH and confirmed that CRISPR-Cas9 is a powerful tool to understand the gene functions.

Keywords: CRISPR/Cas9; Genome editing; Gibberellins; Plant height; Rice.


Conflict of interest statement

Conflict of interestThe authors declare that they have no competing interests.

Figures

Fig. 1
Fig. 1
Schematic diagram of sgRNA target sites in OsGA20ox2. Exons are indicated as black boxes. T1 and T2 represent Target 1 and Target 2, respectively
Fig. 2
Fig. 2
Expression cassette and sequencing peak map of both targets assembled in pYLCRISPR/Cas9Pubi-H. a Gel electrophoresis detection of expression cassette for both targets, M DL2000 DNA marker; b detection of expression cassettes after transformation of DH5α; M DL2000 DNA marker, 1–12 amplified bacterial colonies; 1144 bp: total amplified length of U6a and U6b expression cassette assembly; c JGR SD1 gene sequence of target regions; red sequences represent the upstream and downstream primers of SD1 partial gene sequence; blue sequences represent the SD1 gene target sites sequence and position; the sequences in green letters represent the RT-qPCR primers; d linking sequence of two expression cassettes U6a-driven Target 1 and U6b-driven Target 2 on pYL CRISPR/Cas9 vector; e sequencing peak map of both target sites assembled in pYLCRISPR/Cas9Pubi-H vector
Fig. 3
Fig. 3
Detection of positive mutant lines and analysis of mutations. a T0 positive mutant lines; M DNA marker, WT wild type, 1–19 T0 transgenic lines; b nucleotide sequence alignment and mutation frequency for both target regions. Deletions and insertions are indicated by red dashes and letters, respectively, while yellow highlighted is PAM (protospacer adjacent motif). The numbers on the right side show the sizes of the indels, with “−” and “+” indicating deletion and insertion of the nucleotides
Fig. 4
Fig. 4
a Detection of T-DNA-free mutant lines; M DL2000 DNA marker, WT wild type. b Sequence alignment for transmission of mutations at both target sites in T1 and subsequent T2 generations. The targeted sequence is shown in green background and the PAM sequence in gray background. Insertion is represented by red letters, and deletion by red hyphens
Fig. 5
Fig. 5
SD1 expression level of wild type (JGR) and T1 mutant plants by RT-qPCR analysis. Data are the mean ± SD of three independent PCR values
Fig. 6
Fig. 6
Expression analysis of GA biosynthesis genes (OsGA2ox3 and GA3ox2) and signaling genes (D1, GIDI and SLR1) in panicle tissues of wild type and mutant lines. The data are the mean ± SD of three independent values
Fig. 7
Fig. 7
Seedling phenotype of wild JGR and mutant plants under controlled conditions and GA3 treatment a plants under controlled conditions, b plants treated with 10 μM GA3, c plant height of control and GA3-treated seedling
Fig. 8
Fig. 8
Anatomical analysis of second internodal cells of wild JGR and G7-6-1. a Mutant plant (G7-6-1) second internode longitudinal cell length, b wild JGR second intermodal longitudinal cell length, c mutant line G7-6-1s internode transverse section of cell and d wild JGR second intermodal transverse section of the cell, e number of cells in wild type and the mutant line in the same area of longitudinal section, f cell length of the wild type and the mutant line in longitudinal section, g comparison of the cells size of the wild type and the mutant line in longitudinal section, h cell width of the wild type and the mutant line in longitudinal section. CF cortical fiber, PC parenchyma cells, AC aerenchyma, SVB small vascular bundle, SC sclerenchyma cells. Bars 50 μm
Fig. 9
Fig. 9
PPI (protein to protein interaction) visualization by Confidence between proteins. Node represents differential expressed protein, and edge represents interaction relationship between two nodes. A thicker line indicates a stronger interaction between the two proteins. Different colors indicate different evidences i.e. red line—indicates the presence of fusion evidence, green line—neighborhood evidence, blue line—cooccurrence evidence, purple line—experimental evidence, yellow line—textmining evidence, light blue line—database evidence and Black line—represents co-expression evidence

References

    1. Ahmad I, Kamran M, Ali S, Bilegjargal B, Cai T, Ahmad S, Meng X, Su W, Liu T, Han Q. Uniconazole application strategies to improve lignin biosynthesis, lodging resistance and production of maize in semiarid regions. Field Crops Res. 2018;1(222):66–77. doi: 10.1016/j.fcr.2018.03.015. - DOI
    1. Arenhart RA, De Lima JC, Pedron M, Carvalho FE, Da Silveira JA, Rosa SB, Caverzan A, Andrade CM, Schuenemann M, Margis R, Margis-Pinheiro MÁ. Involvement of ASR genes in aluminium tolerance mechanisms in rice. Plant Cell Environ. 2013;36(1):52–67. doi: 10.1111/j.1365-3040.2012.02553.x. - DOI - PubMed
    1. Asano K, Yamasaki M, Takuno S, Miura K, Katagiri S, Ito T, Doi K, Wu J, Ebana K, Matsumoto T, Innan H. Artificial selection for a green revolution gene during japonica rice domestication. PNAS. 2011;108(27):11034–11039. doi: 10.1073/pnas.1019490108. - DOI - PMC - PubMed
    1. Brooks C, Nekrasov V, Lippman ZB, Van Eck J. Efficient gene editing in tomato in the first generation using the clustered regularly interspaced short palindromic repeats/CRISPR-associated9 system. Plant Physiol. 2014;166(3):1292–1297. doi: 10.1104/pp.114.247577. - DOI - PMC - PubMed
    1. Cascardo JC, Buzeli RA, Almeida RS, Otoni WC, Fontes EP. Differential expression of the soybean BiP gene family. Plant Sci. 2001;160(2):273–281. doi: 10.1016/s0168-9452(00)00384-8. - DOI - PubMed