. 2019 May;1(5):532-545.
doi: 10.1038/s42255-019-0059-2. Epub 2019 Apr 29.

Branched chain amino acids impact health and lifespan indirectly via amino acid balance and appetite control

Affiliations

Branched chain amino acids impact health and lifespan indirectly via amino acid balance and appetite control

Samantha M Solon-Biet et al. Nat Metab. 2019 May.

Abstract

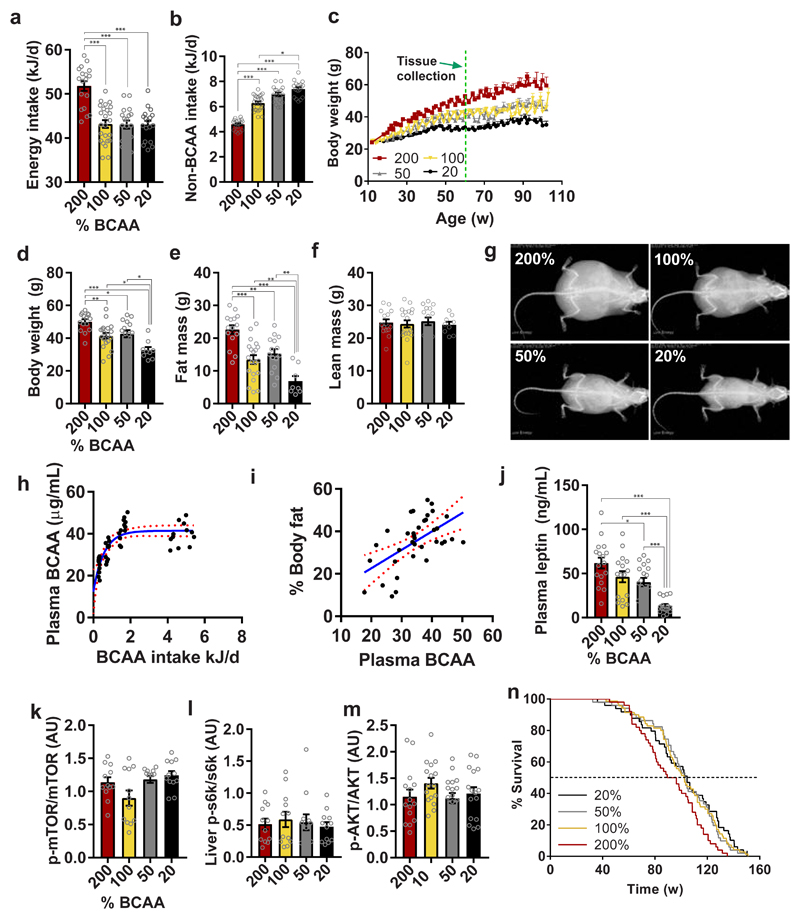
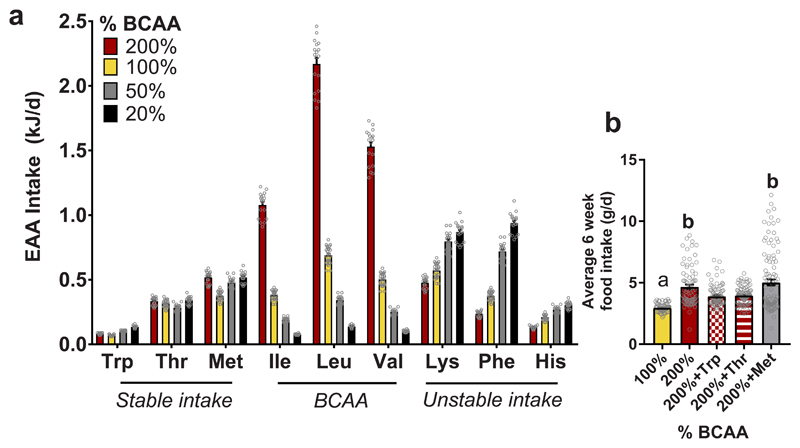
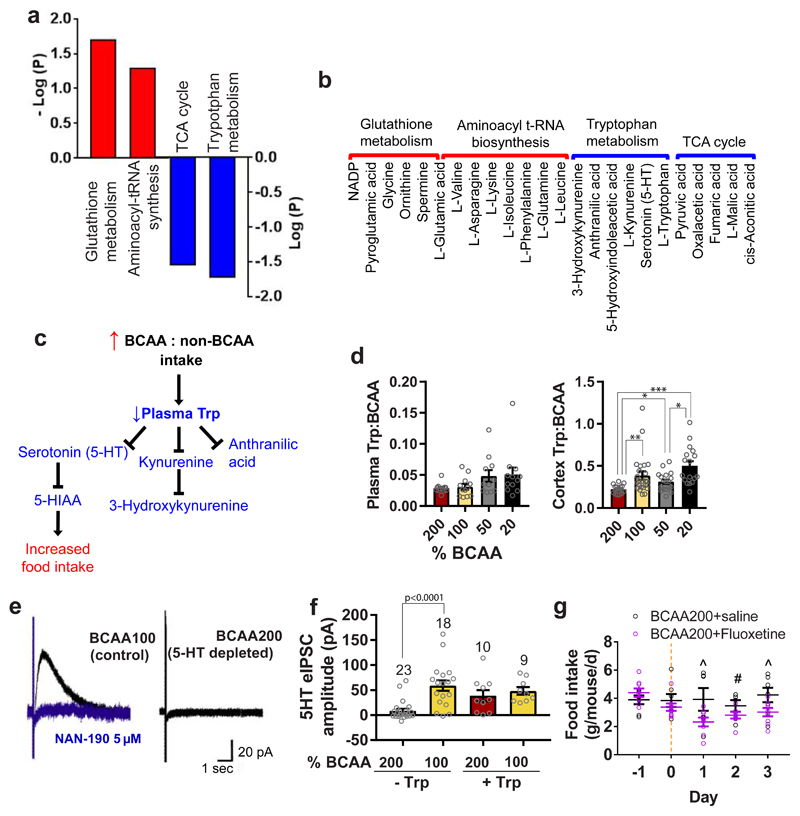
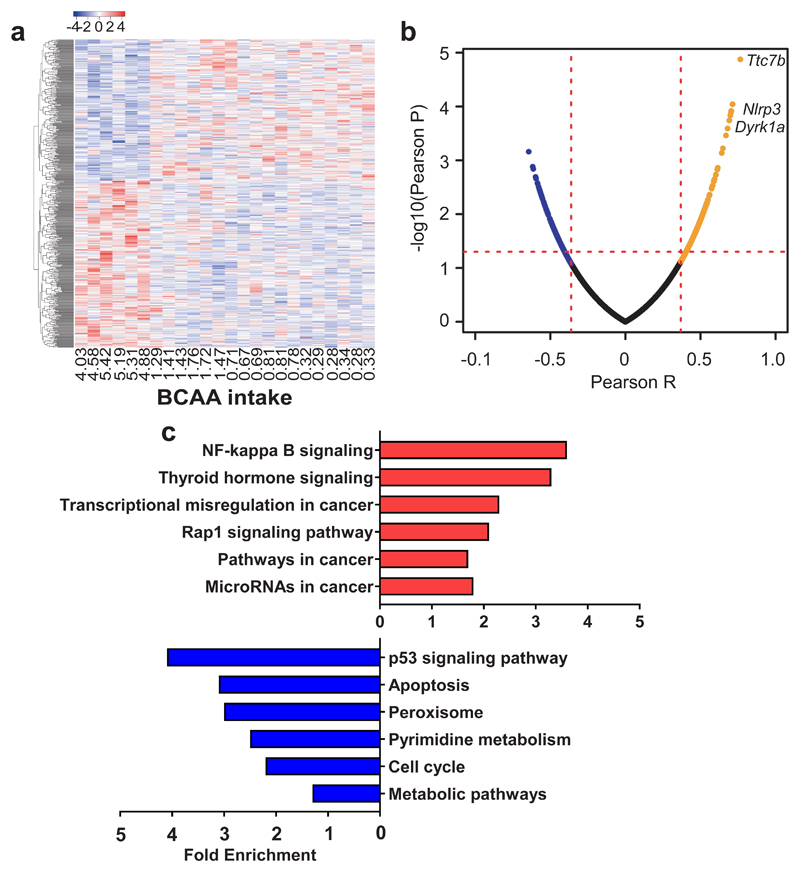
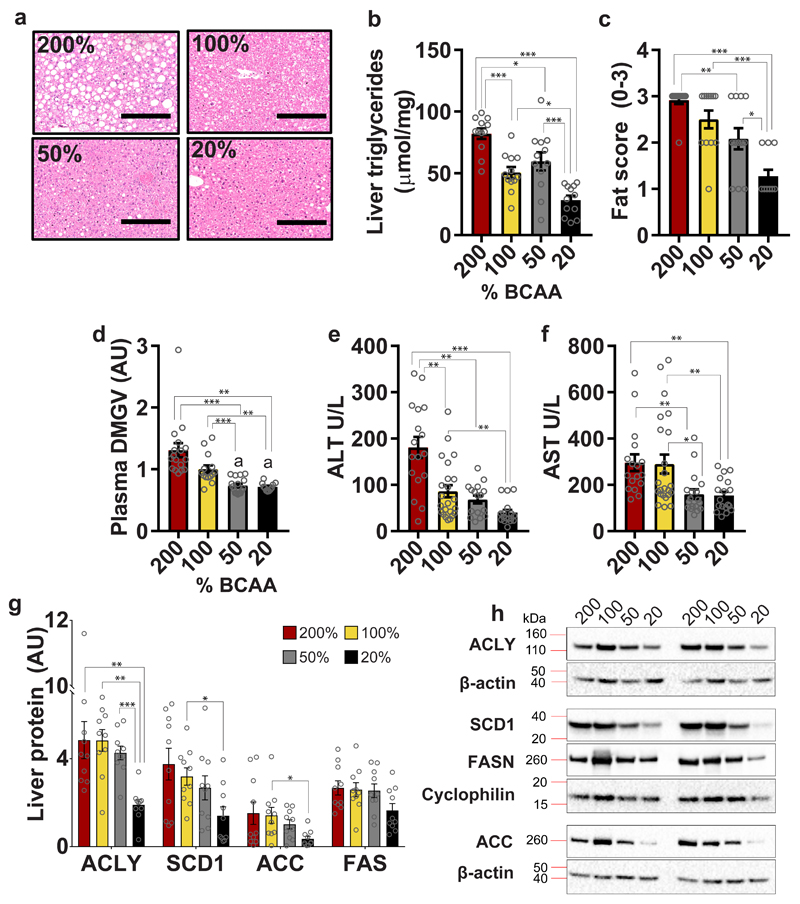
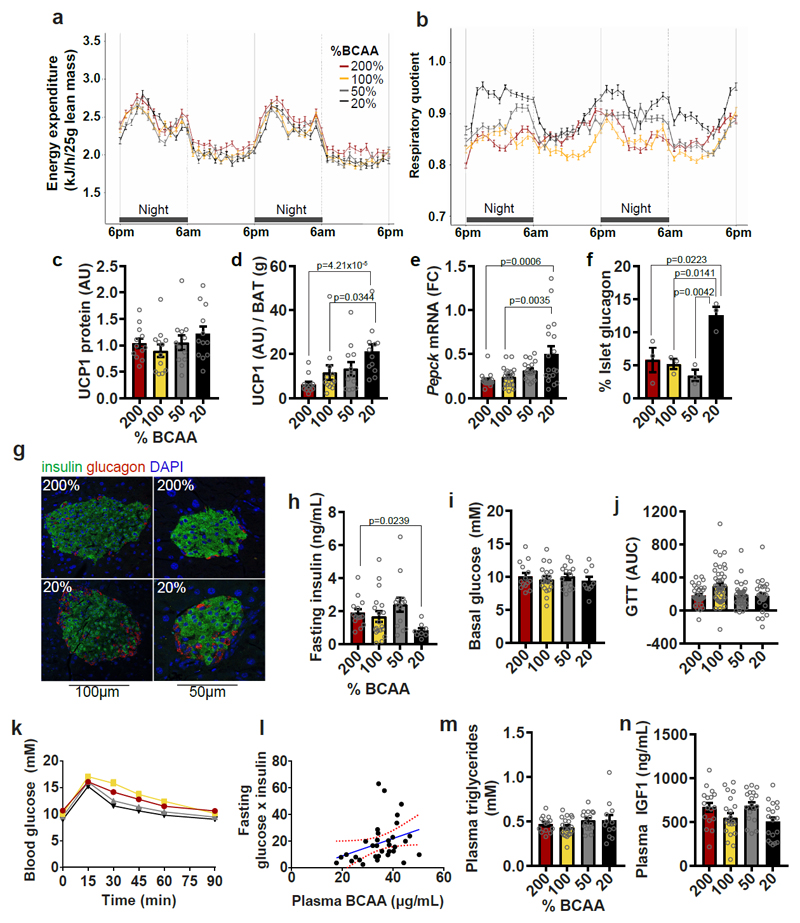
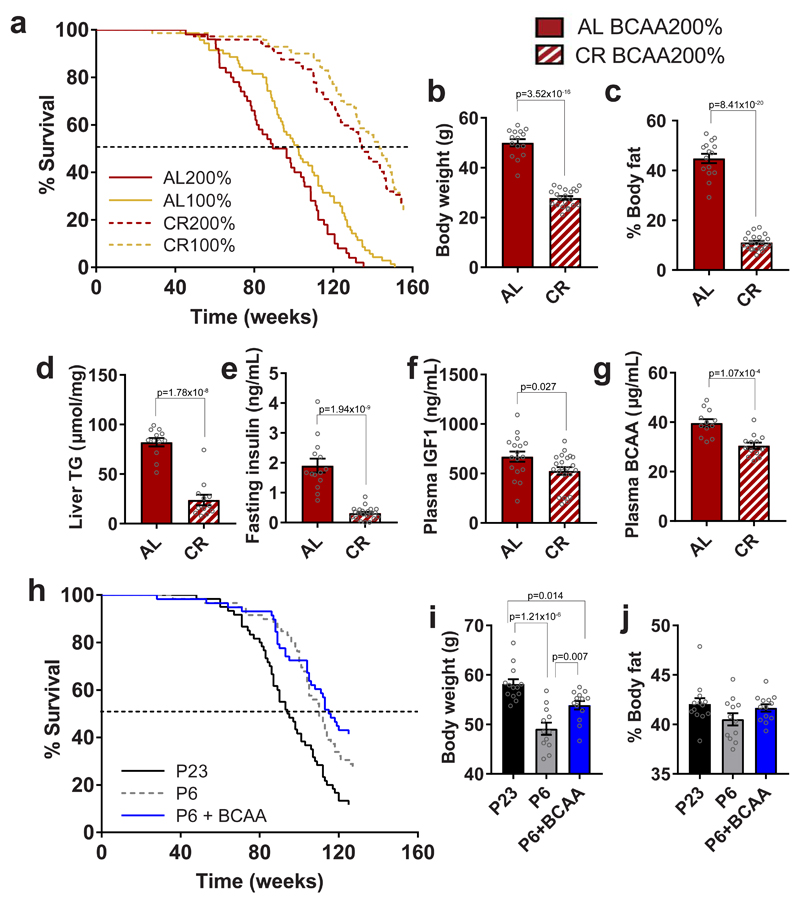
Elevated branched chain amino acids (BCAAs) are associated with obesity and insulin resistance. How long-term dietary BCAAs impact late-life health and lifespan is unknown. Here, we show that when dietary BCAAs are varied against a fixed, isocaloric macronutrient background, long-term exposure to high BCAA diets leads to hyperphagia, obesity and reduced lifespan. These effects are not due to elevated BCAA per se or hepatic mTOR activation, but rather due to a shift in the relative quantity of dietary BCAAs and other AAs, notably tryptophan and threonine. Increasing the ratio of BCAAs to these AAs resulted in hyperphagia and is associated with central serotonin depletion. Preventing hyperphagia by calorie restriction or pair-feeding averts the health costs of a high BCAA diet. Our data highlight a role for amino acid quality in energy balance and show that health costs of chronic high BCAA intakes need not be due to intrinsic toxicity but, rather, a consequence of hyperphagia driven by AA imbalance.

Keywords: Nutrition; aging; appetite; branched chain amino acids; dietary balance; dietary restriction; lifespan; metabolic health; obesity; serotonin.


Conflict of interest statement

Declaration of Interests The authors declare no competing interests.

Figures

Fig. 1
Fig. 1. Dietary BCAA imbalance drives hyperphagia, obesity and shortens lifespan
(a) Energy intake and (b) non-BCAA intake averaged over 12-15 months of age (200%, 50%, 20%, n=18; 100%, n=24 independent cages). (c) Body weight trajectories over time (200%, 50%, 20%, n=72; 100%, n=96 biologically independent mice). The green dashed line indicates the 15 month tissue collection time point from which plasma and tissue were analyzed. (d) body weight (200%, n=15; 100%, n=19; 50%, n=15; 20%, n=9 independent cages), (e) fat mass (200%, n=15; 100%, n=20; 50%, n=15; 20%, n=8 independent cages) and (f) lean mass (200%, n=15; 100%, n=19; 50%, n=15; 20%, n=9 independent cages) measured longitudinally using EchoMRI. (g) Representative DEXA scans of mice measured once at 15 months of age (200%, n=9; 100%, n=8; 50%, n=11; 20%, n=10 biologically independent mice) (h) Plasma BCAAs vs BCAA intake from animals at collected at 15 months of age (n=47 biologically independent mice). (i) % body fat (r= 0.329, Pearson’s correlation, p=0.0003) measured by EchoMRI vs plasma BCAAs at 15 months of age (n=47 biologically independent mice). Red lines show the 95% confidence interval. (j) Plasma leptin levels at 15 months of age (200%, n=17; 100% and 20%, n=16, 50%, n=18 biologically independent mice). (k-m) Hepatic mTOR (n=12 biologically independent mice for all groups), S6K (n=12 biologically independent mice for all groups) and AKT (200%, 100% and 20%, n=16; 50%, n=18 biologically independent mice) activation analyzed by western blot. (n) Survival curves analyzed by Cox Proportional Hazard Models (CPHM). Dotted line indicates median lifespan. Data shown are for combined sexes analyzed at 15 months of age. For all bar graphs, ANOVA was used for normal and log-normal data, and Kruskal Wallis for non-normal data. Pairwise comparisons amongst diets for normal and log-normal data were made using t-tests (two-sided). For non-normal data, pairwise comparisons amongst diets were made using Kruskal Wallis test. All bars indicate means ± SEM. *p≤0.05, **p≤0.01, ***p≤0.001 based on posthoc analysis following correction for multiple testing.
Fig. 2
Fig. 2. Tryptophan and threonine supplementation prevents hyperphagia
(a) Average intake of essential amino acids (EAA) over 12-15 months (200%, 50% and 20%, n=18; 100%, n=24 biologically independent mice). AAs were categorized as those that remained stable in intake across diets, the BCAAs and those that were unstable across diets. The three AAs which remained stable (Trp, Thr and Met) were used in a six week feeding study. (b) Over six weeks of feeding, male mice on a BCAA200 diet were hyperphagic as seen in the long-term study. Adding back 150% of Trp or Thr significantly suppressed hyperphagia (100%, n=82; 200%, n=79; 200%+Thr, n=99; 200%+Trp, n=91; 200%+Met, n=105 independent daily measurements of food intake). For all bar graphs, ANOVA for normal and log-normal data, and Kruskal Wallis tests for non-normal data, were used to determine significant differences between groups. Pairwise comparisons amongst diets for normal and log-normal data were made using t-tests (two-sided). For non-normal data, pairwise comparisons amongst diets were made using Kruskal Wallis test. For (a), ANOVA was used for normal and log-normal data, and Kruskal Wallis for non-normal data. Pairwise comparisons amongst diets for normal and log-normal data were made using t-tests (two-sided). For non-normal data, pairwise comparisons amongst diets were made using Kruskal Wallis test. For (b), one-way ANOVA was performed with Tukey’s multiple comparisons test. 100% vs 200%, p<1x10-15; 100% vs 200%+Thr, p=8.3x10⁻⁵, 100% vs 200%+Trp, p=3.6x10⁻⁴; 100% vs 200%+Met, p<1x10-15; 200% vs 200%+Thr, p=0.010; 200% vs 200%+Trp, p=0.005; 200%+Thr vs 200%+Met, p=2.1x10⁻⁶; 200% Trp vs 200% Met, p=9.5x10⁻⁷. All bars indicate means ± SEM and groups that do not share common letters indicate significant differences (p<0.05) based on posthoc analysis.
Fig. 3
Fig. 3. Hyperphagia in BCAA200 mice is linked to Trp-mediated serotonin (5-HT) depletion
Metabolic pathways (KEGG) positively (red) and negatively (blue) correlated with high BCAA: non-BCAA intakes measured in plasma of 15 month old mice using LC-MS and the (b) metabolites in each pathway (200% and 50% n= 17; 100%, n=14; 20% n=16 biologically independent mice). (c) Diagram depicting the relationship between dietary BCAA:non-BCAA intake, Trp metabolism and the effects on food intake. (d) The ratio of Trp:BCAA in plasma and cortex of mice collected at 15 months of age (Plasma: 200%, 100% and 20%, n=12; 50%, n=11 biologically independent mice. Cortex: 200%, n=16; 100%, n=24; 50%, n=18; 20%, n=17 biologically independent mice). (e) Example traces from electrophysiological patch clamp recordings showing 5HT synaptic responses from mice fed either the BCAA100 (control) or BCAA200 (predicted 5HT depleted) diet for six weeks (n=5 biologically independent mice). The evoked inhibitory post-synaptic current (eIPSC) is shown in black and blocking by the 5HT1A receptor antagonist NAN-190 in blue. (f) Average 5HT eIPSC amplitude without and with addition of Trp to media. Number of neurons measured are shown above bars. (g) Food intake of mice on BCAA200 diets following four days of oral administration of either fluoxetine or saline (saline, n=7; fluoxetine, n=8 independent cages). For (a,b) Pearson’s correlation. In (d,e) data are from males and females combined. For (d), pairwise comparisons for normal and log-normal data were made using t-tests (two-sided). For non-normal data, pairwise comparisons amongst diets were made using Kruskal Wallis test. For (f), pair-wise comparisons were made between the 200% and 100% groups, without and with Trp, using t-tests (two-sided). In (g), ^ denotes a significant difference between treatments (Day 1, p=0.030; Day 3, p=0.028) and # indicates near significance (p=0.078) based on t-test (one-sided). All bars indicate means ± SEM. *p≤0.05, **p≤0.01, ***p≤0.001, unless otherwise shown, based on posthoc analysis following correction for multiple testing.
Fig. 4
Fig. 4. The ratio of dietary BCAA to non-BCAAs influence hypothalamic gene expression
(a) Heatmap of hypothalamic genes significantly correlated with BCAA intake (averaged over 12-15 months of age) measured using RNAseq. Red and blue colors indicate higher and lower mean expression, respectively, as measured by row standardized Z-scores (n=6 biologically independent mice). (b) Volcano plot of the Pearson correlation coefficient p-value vs Pearson correlation coefficient. Positively-associated genes were labelled with orange and the negatively-associated genes were labelled with blue. The p=0.05 was marked with red dash line (n=6 biologically independent mice). (c) Partial list of the top enriched pathways (KEGG) positively (red) and negatively (blue) correlated with BCAA intake. Data are from males and females combined, collected at 15 months of age (n=6 biologically independent mice). For (a,b) Pearson’s correlation was used.
Fig. 5
Fig. 5. Dietary BCAA imbalance promotes hepatosteatosis and de novo lipogenesis
(a) Representative H&E stains of livers (n=12 biologically independent mice, assessed once by four independent observers blinded to the dietary treatment groups). (b) Liver triglycerides (n=12 biologically independent mice for all groups), (c) Fat score (200%, 100% and 50%, n=12; 20%, n=11 biologically independent mice) and circulating levels of (d) DMGV, a novel metabolite marker for hepatosteatosis, are increased on high BCAA diets (200%, n=17; 100%, n=14; 50%, n=16; 20%, n=11 biologically independent mice). Liver function tests as indicated by plasma (e) ALT levels (200%, n=17; 100%, n=23; 50%, n=17; 20%, n=15 biologically independent mice) and (f) AST (200%, n=17; 100%, n=14; 50%, n=18; 20%, n=18 biologically independent mice). (g) Markers of de novo lipogenesis in liver quantified using western blot (n=10 biologically independent mice) with (h) representative images quantified once using 10 biologically independent mice. ACLY: ATP-citrate lyase; SCD1: stearoyl-coA desaturase-1; FAS: fatty acid synthase; ACC: acetyl-coA carboxylase. Data are from males and females combined, collected at 15 months of age. For all bar graphs, ANOVA for normal and log-normal data, and Kruskal Wallis tests for non-normal data, were used to determine significant differences between groups. Pairwise comparisons amongst diets for normal and log-normal data were made using t-tests (two-sided). For non-normal data, pairwise comparisons amongst diets were made using Kruskal Wallis test. All bars indicate means ± SEM. *p≤0.05, **p≤0.01, ***p≤0.001 based on posthoc analysis following correction for multiple testing.
Fig. 6
Fig. 6. Dietary amino acid imbalance alters whole body metabolism
(a) Energy expenditure and (b) Respiratory quotient (RQ) (200%, 50% and 20%, n=12; 100%, n=16 biologically independent mice). Energy expenditure and RQ were measured in individual animals over 2 day and 2 night cycles using metabolic cages. (c) UCP1 protein expression in BAT (n=12 biologically independent mice) and (d) UCP1 protein per g of BAT mass (n=12 biologically independent mice). All western blots were standardized to contain 25ug of protein. (e) Pepck mRNA expression in liver (200%, n=17; 100%, n=21; 50% and 20%, n=18 biologically independent mice). (f) Glucagon content in pancreatic islets (n=3 mice) and (g) representative images of BCAA200 and BCAA20 islets visualized by immunohistochemistry, conducted once with 3 independent mice). Glucose metabolism is shown by (h) fasting insulin levels (200%, n=14; 100%, n=19; 50%, n=14; 20%, n=8 mice), (i) basal glucose levels (200%, n=14;, 100%, n=19; 50%, n=15; 20%, n=9 mice) and (j,k) the area under the curve (AUC) from glucose tolerance tests (GTT) (200%, n=33; 100%, n=44; 50%, n=33%; 20%, n=27 mice). (l) The relationship between plasma BCAAs and the product of fasting glucose and insulin, an index of insulin sensitivity (p=0.054; r=0.115; Pearson’s correlation; n=33 mice). Red lines show the 95% confidence interval. Plasma (m) triglycerides (200%, n=14, 100%, n=20; 50%, n=16; 20%, n=12 mice) and (n) IGF1 (200%, n=17; 100%, n=21, 50% and 20%, n=18 mice) were measured. For all bar graphs, ANOVA for normal and log-normal data, and Kruskal Wallis tests for non-normal data, were used to determine significant differences between groups. Pairwise comparisons amongst diets for normal and log-normal data were made using t-tests (two-sided). For non-normal data, pairwise comparisons amongst diets were made using Kruskal Wallis test. All bars indicate means ± SEM. *p≤0.05, **p≤0.01, ***p≤0.001 based on posthoc analysis following correction for multiple testing.
Fig. 7
Fig. 7. Preventing hyperphagia on high BCAA diets averts metabolic and lifespan costs
(a) Survival curves of ad libitum-fed (AL) and 20% calorically restricted (CR) mice. Data from AL animals are replotted from Fig. 1n and shown here for direct lifespan comparison to CR. (b) Body weight (AL, n=15; CR, n=21 independent cages) and (c) % body fat (AL, n=15; CR, n=21 independent cages) of 15 month-old mice fed a BCAA200 diet at either AL or CR conditions. (d) Liver triglyceride content (TG) (n=12 biologically independent mice) and plasma analysis of (e) fasting insulin (AL, n=14; CR, n=21 independent cages), (f) IGF1 (AL, n=17; CR, n=22 independent cages) and (g) BCAA (AL, n=12; CR, n=13 biologically independent mice). (h) Survival curves of mice pair fed with an exome-matched diet of either 23% protein, 6% protein, of 6%+BCAAs. (i) Body weights and (j) % body fat for animals at 12 months of age (P23, n=13; P6, n=12; P6+BCAA, n=13 biologically independent mice). For (b-g), two-sided t-tests were used. For (i,j), ANOVA and Tukey’s multiple comparisons posthoc test were used. All bars indicate means ± SEM. *p≤0.05, **p≤0.01, ***p≤0.001 based on posthoc analysis following correction for multiple testing.

References

    1. Simpson SJ, Raubenheimer D. The Nature of Nutrition A Unifying Framework From Animal Adaption to Human Obesity. Princeton University Press; 2012.
    1. Gosby AK, et al. Testing Protein Leverage in Lean Humans: A Randomised Controlled Experimental Study. PLoS One. 2011;6:e25929. - PMC - PubMed
    1. Simpson SJ, Raubenheimer D. Obesity: The protein leverage hypothesis. Obesity Rev. 2005;6:133–142. - PubMed
    1. Le Couteur DG, et al. The impact of low-protein high-carbohydrate diets on aging and lifespan. Cell Mol Life Sci. 2015;76:1237–1252. - PMC - PubMed
    1. Solon-Biet SM, et al. The Ratio of Macronutrients, Not Caloric Intake, Dictates Cardiometabolic Health, Aging, and Longevity in Ad Libitum-Fed Mice. Cell Metab. 2014;19:418–430. - PMC - PubMed

Publication types