. 2020 Feb 1;201(3):294-302.
doi: 10.1164/rccm.201908-1600OC.

Disease Progression Modeling in Chronic Obstructive Pulmonary Disease

Collaborators, Affiliations

Disease Progression Modeling in Chronic Obstructive Pulmonary Disease

Alexandra L Young et al. Am J Respir Crit Care Med. .

Abstract

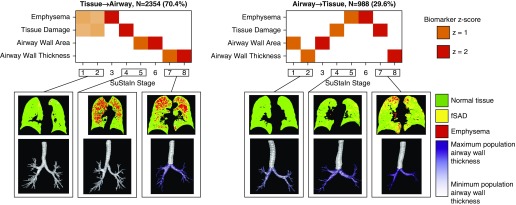
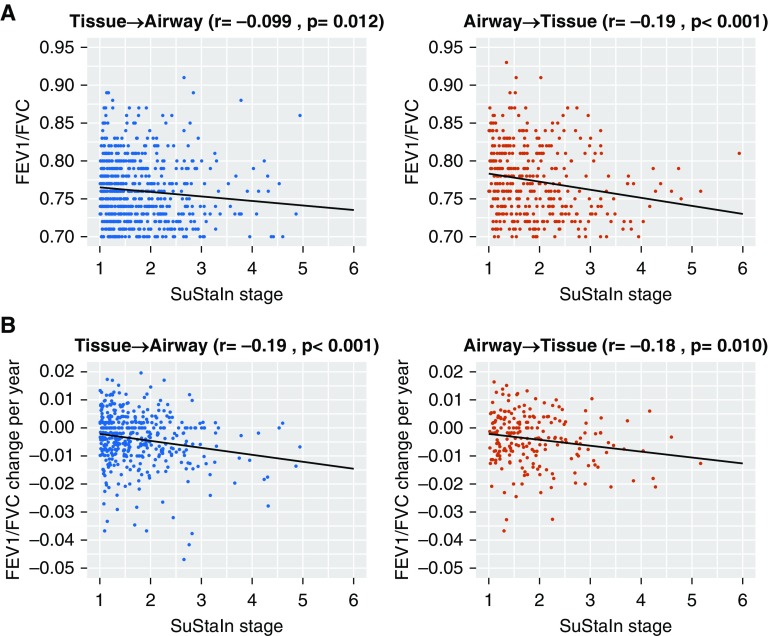
Rationale: The decades-long progression of chronic obstructive pulmonary disease (COPD) renders identifying different trajectories of disease progression challenging.Objectives: To identify subtypes of patients with COPD with distinct longitudinal progression patterns using a novel machine-learning tool called "Subtype and Stage Inference" (SuStaIn) and to evaluate the utility of SuStaIn for patient stratification in COPD.Methods: We applied SuStaIn to cross-sectional computed tomography imaging markers in 3,698 Global Initiative for Chronic Obstructive Lung Disease (GOLD) 1-4 patients and 3,479 controls from the COPDGene (COPD Genetic Epidemiology) study to identify subtypes of patients with COPD. We confirmed the identified subtypes and progression patterns using ECLIPSE (Evaluation of COPD Longitudinally to Identify Predictive Surrogate Endpoints) data. We assessed the utility of SuStaIn for patient stratification by comparing SuStaIn subtypes and stages at baseline with longitudinal follow-up data.Measurements and Main Results: We identified two trajectories of disease progression in COPD: a "Tissue→Airway" subtype (n = 2,354, 70.4%), in which small airway dysfunction and emphysema precede large airway wall abnormalities, and an "Airway→Tissue" subtype (n = 988, 29.6%), in which large airway wall abnormalities precede emphysema and small airway dysfunction. Subtypes were reproducible in ECLIPSE. Baseline stage in both subtypes correlated with future FEV1/FVC decline (r = -0.16 [P < 0.001] in the Tissue→Airway group; r = -0.14 [P = 0.011] in the Airway→Tissue group). SuStaIn placed 30% of smokers with normal lung function at elevated stages, suggesting imaging changes consistent with early COPD. Individuals with early changes were 2.5 times more likely to meet COPD diagnostic criteria at follow-up.Conclusions: We demonstrate two distinct patterns of disease progression in COPD using SuStaIn, likely representing different endotypes. One third of healthy smokers have detectable imaging changes, suggesting a new biomarker of "early COPD."

Keywords: CT imaging; bronchitis; chronic obstructive pulmonary disease; clustering; emphysema.


Figures

Figure 1.
Figure 1.
Disease progression patterns predicted by Subtype and Stage Inference (SuStaIn). Chronic obstructive pulmonary disease is characterized by two distinct disease progression models (top row). In the Tissue→Airway subtype (70%; top left) the presence of emphysema and functional small airway disease (fSAD) initiates disease progression followed by later emergence of pathology in larger airways. (The overall tissue damage measure captures the presence of both fSAD and emphysema.) In the Airway→Tissue subtype (30%; top right), disease progression is initiated by pathology in the larger airways before the development of fSAD and emphysema. At each SuStaIn stage a new z-score event occurs when a feature transitions to a new severity level, as indexed by a z-score with respect to the control population; z-scores of z = 1 (orange) and z = 2 (red). Higher opacity represents a higher confidence in the ordering. The bottom row visualizes the parametric response mapping images and airway wall thickness values for representative patients at different SuStaIn subtypes and stages. The airway wall thickness values are visualized using a purple color scale on top of an airway tree segmentation, with the minimum value of the color scale corresponding to the first percentile of airway wall thickness values across the population and the maximum value of the color scale corresponding to the 99th percentile. In the Tissue→Airway subtype, the first individual (early stage) has early tissue damage visible at the outer edges of the lung but no airway wall changes, the second individual (middle stage) has visible tissue damage but no airway changes, and the third individual (late stage) has severe tissue damage together with airway wall thickening. In the Airway→Tissue subtype, the first individual (early stage) has early signs of airway wall thickening but no visible tissue damage, the second individual (middle stage) has clear signs of airway wall thickening but very little visible tissue damage, and the third individual (late stage) has severe airway wall thickening and tissue damage.
Figure 2.
Figure 2.
Relationship between Subtype and Stage Inference (SuStaIn) stage and lung function. (A) Scatterplot of cross-sectional spirometry versus SuStaIn stage for the Tissue→Airway and Airway→Tissue subtypes. A linear and a quadratic model are fitted to the data via a least-squares estimation to gauge the relationship between SuStaIn stage and markers of lung function. In the Tissue→Airway subtype, there is a visible nonlinear relationship between lung function and SuStaIn stage, with a more rapid decrease in lung function at earlier SuStaIn stages. The decline in lung function in the Airway→Tissue subgroup is linear and less rapid at earlier SuStaIn stages. (B) Scatterplot of measured decline in spirometry versus baseline SuStaIn stage for the Tissue→Airway and Airway→Tissue subtypes in Global Initiative for Chronic Obstructive Lung Disease (GOLD) 1–2 subjects. In both the Tissue→Airway and Airway→Tissue subtypes, SuStaIn stage at baseline correlated with future decline in lung function measured using FEV1/FVC.
Figure 3.
Figure 3.
Relationship between lung function and Subtype and Stage Inference (SuStaIn) stage in smoking controls. Baseline SuStaIn stage is associated with cross-sectional and longitudinal changes in airflow obstruction in smoking controls. (A) Scatterplot of baseline values FEV1/FVC versus SuStaIn stage in the control population. (B) Scatterplot of longitudinal change in FEV1/FVC per year versus SuStaIn stage in the control population.

Comment in

References

    1. Mannino DM, Buist AS. Global burden of COPD: risk factors, prevalence, and future trends. Lancet. 2007;370:765–773. - PubMed
    1. Vestbo J, Edwards LD, Scanlon PD, Yates JC, Agusti A, Bakke P, et al. ECLIPSE Investigators. Changes in forced expiratory volume in 1 second over time in COPD. N Engl J Med. 2011;365:1184–1192. - PubMed
    1. Bhatt SP, Soler X, Wang X, Murray S, Anzueto AR, Beaty TH, et al. Association between functional small airway disease and FEV1 decline in chronic obstructive pulmonary disease. Am J Respir Crit Care Med. 2016;194:178–184. - PMC - PubMed
    1. Castaldi PJ, Dy J, Ross J, Chang Y, Washko GR, Curran-Everett D, et al. Cluster analysis in the COPDGene study identifies subtypes of smokers with distinct patterns of airway disease and emphysema. Thorax. 2014;69:415–422. - PMC - PubMed
    1. Burgel P-R, Paillasseur J-L, Caillaud D, Tillie-Leblond I, Chanez P, Escamilla R, et al. Initiatives BPCO Scientific Committee. Clinical COPD phenotypes: a novel approach using principal component and cluster analyses. Eur Respir J. 2010;36:531–539. - PubMed

Publication types