. 2019 Dec;33(12):14137-14146.
doi: 10.1096/fj.201900717RR. Epub 2019 Oct 30.

Inositol polyphosphate multikinase is a metformin target that regulates cell migration

Affiliations

Inositol polyphosphate multikinase is a metformin target that regulates cell migration

Becky Tu-Sekine et al. FASEB J. 2019 Dec.

Erratum in

  • Correction.
    [No authors listed] [No authors listed] FASEB J. 2020 Sep;34(9):13066-13068. doi: 10.1096/fsb2.20812. FASEB J. 2020. PMID: 33411330 Free PMC article. No abstract available.

Abstract

Metformin has been shown to alter cell adhesion protein expression, which is thought to play a role in its observed antitumor properties. We found that metformin treatment down-regulated integrin β1 concomitant with the loss of inositol polyphosphate multikinase (IPMK) in murine myocytes, adipocytes, and hepatocytes. To determine if IPMK was upstream of integrin β1 expression, we examined IPMK-/- mouse embryonic fibroblast cells and found that integrins β1 and β3 gene expression was reduced by half, relative to wild-type cells, whereas focal adhesion kinase (FAK) activity and Rho/Rac/Cdc42 protein levels were increased, resulting in migration defects. Using nanonet force microscopy, we determined that cell:extracellular matrix adhesion and cell contractility forces were decreased, confirming the functional relevance of integrin and Rho protein dysregulation. Pharmacological studies showed that inhibition of both FAK1 and proline-rich tyrosine kinase 2 partially restored integrin β1 expression, suggesting negative regulation of integrin β1 by FAK. Together our data indicate that IPMK participates in the regulation of cell migration and provides a potential link between metformin and wound healing impairment.-Tu-Sekine, B., Padhi, A., Jin, S., Kalyan, S., Singh, K., Apperson, M., Kapania, R., Hur, S. C., Nain, A., Kim, S. F. Inositol polyphosphate multikinase is a metformin target that regulates cell migration.

Keywords: adhesion; extracellular matrix; focal adhesion kinase; integrin; nanonet force microscopy.


Conflict of interest statement

The authors thank Jade West for assisting with cell tracking analyses, and Angie Chan for assisting with quantitative RT-PCR experiments (both from Johns Hopkins University). This work was supported by U.S. National Institutes of Health (NIH) Grant DA568921 (to S.F.K.), American Heart Association Grant 17SFRN33610014 (to S.F.K.), and National Science Foundation (NSF) Grants 1437101 and 1462916 (to A.N.). The authors declare no conflicts of interest.

Figures

Figure 1
Figure 1
IPMK regulates integrin (Int)β1 expression. A, B) MEF WT cells were treated with indicated concentration of metformin for 48 h, and cell lysates were subjected to immunoblotting. C) Expression of integrin β1 was measured by fluorescence microscopy against total or active form of the integrin β1 protein. Images were taken at ×20 magnification. D) MEF (WT vs. IPMK−/−) cells were washed once with calcium and magnesium-free (CMF) PBS and imaged in CMF PBS every 10 s. E) MEF (WT vs. IPMK−/−) cells were trypsinized briefly and seeded at low density onto fibronectin, allowed to adhere for 1 h, then fixed and stained with Evan’s Blue prior to imaging and analysis. Percentages indicate percent of total cells imaged; cells that adhered but did not spread were eliminated from the analysis. The most representative images from 3 independent assays are presented. GAPDH, glyceraldehyde 3-phosphate dehydrogenase; pACC, phosphorylated acetyl-CoA carboxylase.
Figure 2
Figure 2
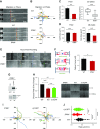
Loss of IPMK reduces cell migration. A) Time lapse images showing MEF WT migrating faster than IPMK−/− cells on aligned nanofibers. Red dashed line indicates starting position and yellow dashed line indicates the current location of the centroid of the cell at the indicated time. B) Cells were plated on fibronectin-coated MatTek glass-bottom plates as indicated in Materials and Methods and imaged at 2-min intervals. Individual cells were tracked using CellTracker v.1.1, and positions were normalized to the origin and are presented as rose plots. Results are representative of at least 3 experiments tracking 40–50 cells for each cell type. C) Quantification of velocity data from A and B. Fiber scaffold experiments are averaged data from 20 cells (error bars = se); 2D experiments are averaged data from 40 to 50 cells. D) Quantification of cell area data from A and B. Fiber scaffold experiments are averaged data from 20 cells (error bars = se); 2D experiments are averaged data from 100 cells. N.S., not statistically significant. E) MEF cells were grown in 12-well plates and manually scratched with a pipette tip. Cell images were taken at indicated times, and the cell front is marked by a white line, whereas the migration progress is indicated by a colored line (orange = 6 h, blue = 12 h, green = 24 h). The distance traveled between 2 time points was measured using ImageJ and is indicated in each panel. No measurement indicates gap closure. F) Schematic representation of the pull to failure experiments to measure adhesion strength. MEF IPMK−/− cells have significantly lower adhesion strength compared with MEF WT cells; n = 14 for WT and n = 16 for IPMK−/−. G) Integrin β1 was overexpressed in MEF IPMK−/− cells and its expression was confirmed by immunoblotting. H) Scratch assays were performed as described in E, and cells were imaged every 5 min for 4–8 h as indicated in Materials and Methods. Gap closure rates were determined normalized to WT controls. Combined data from 4 experiments; n = 14 for each cell type. I) Rose plots of cell tracking data from IPMK−/− and IPMK−/− cells stably expressing β1 integrin-GFP as described in B. Representative of 2 experiments, n = 50 cells for each cell type. J) Violin plot showing the distribution density of migration velocities for WT (black), IPMK−/− (red), and IPMK−/− + β1GFP (green) shows that IPMK loss decreases migration velocity, which is partially rescued by addback of integrin β1; n = 42–58 cells for each cell type. Combined data from 3 experiments. Ns, not significant. *P < 0.05, **P < 0.01, ***P < 0.001.
Figure 3
Figure 3
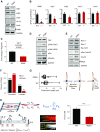
IPMK regulates the adhesion signaling network. A). MEF cells were harvested and cell lysates were subjected to immunoblotting. B) Expression of various adhesion molecule mRNA was detected by real-time qPCR. Data were pooled from at least 6 independent determinations, each in triplicate. C) A luciferase construct containing integrin (Int)β1 promoter region was expressed in either WT or IPMK−/− MEF cells, and a luciferase reporter assay was performed. Data were pooled from at least 3 independent determinations, each in triplicate. D, E) Immunoblotting was performed on cell lysates. F) The proportion of finger-like protrusions increases while the number of broad lamellae decrease in IPMK−/− cells; n = 67 cells for each cell type. G) Mature protrusion length in WT and IPMK−/− cells extending onto 500-nm round nanofibers; n = 30 for each cell type (error bars = se). Cartoon representation illustrates cells extending protrusions on fibers. The center of the ellipse denotes the base of the protrusion. H) Schematic representation of contractile forces measured using NFM. The forces reported here are the sum of the magnitudes of all the resultant force vectors. The force vectors are directed along the major stress fiber angles as shown by immunofluorescent images; red denotes f-actin and green denotes paxillin. Scale bars, 10 µm. MEF IPMK−/− cells had statistically significant lower forces than MEF WT cells; n = 22 for WT and n = 14 for IPMK−/− cells (error bars = se). The most representative images from at least 5 independent assays are presented. *P < 0.05.
Figure 4
Figure 4
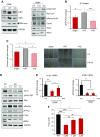
IPMK activity promotes integrin (Int)β1 expression via FAK. A) MEF IPMK−/− cells were overexpressed with either WT or inactive (kinase dead, KD) IPMK, and cell lysates were subjected to immunoblotting. B) Expression of integrin β1 mRNA was detected by real-time quantitative PCR (qPCR). C) Scratch assay was performed as described for Fig. 2H, and data were pooled from 4 experiments. D, E) Cells were treated with the indicated drugs (2 µM) for 18 h. Protein expression was examined by immunoblotting (D) and mRNA expression by qRT-PCR (E). F) The most representative Western blot images from at least 4 independent assays are presented, and qRT-PCR data were pooled from 6 independent determinations, each in triplicate. Contractile force measurements conducted using NFM show a dose-dependent increase in the inside-out forces for IPMK−/− cells following addition of PF431,396 (error bars = se); n = 22 for WT control, n = 14 for IPMK−/− control, n = 24 for 1 μM, and n = 14 for 2 μM. *P < 0.05, **P < 0.01, ***P < 0.001.

References

    1. Bang S., Kim S., Dailey M. J., Chen Y., Moran T. H., Snyder S. H., Kim S. F. (2012) AMP-activated protein kinase is physiologically regulated by inositol polyphosphate multikinase. Proc. Natl. Acad. Sci. USA 109, 616–620 - PMC - PubMed
    1. Bang S., Chen Y., Ahima R. S., Kim S. F. (2014) Convergence of IPMK and LKB1-AMPK signaling pathways on metformin action. Mol. Endocrinol. 28, 1186–1193 - PMC - PubMed
    1. Kim S., Kim S. F., Maag D., Maxwell M. J., Resnick A. C., Juluri K. R., Chakraborty A., Koldobskiy M. A., Cha S. H., Barrow R., Snowman A. M., Snyder S. H. (2011) Amino acid signaling to mTOR mediated by inositol polyphosphate multikinase. Cell Metab. 13, 215–221 - PMC - PubMed
    1. Arnold S. E., Lucki I., Brookshire B. R., Carlson G. C., Browne C. A., Kazi H., Bang S., Choi B. R., Chen Y., McMullen M. F., Kim S. F. (2014) High fat diet produces brain insulin resistance, synaptodendritic abnormalities and altered behavior in mice. Neurobiol. Dis. 67, 79–87 - PMC - PubMed
    1. Schexnayder C., Broussard K., Onuaguluchi D., Poché A., Ismail M., McAtee L.F., Llopis S., Keizerweerd A., McFerrin H., Williams C. (2018) Metformin inhibits migration and invasion by suppressing ROS production and COX2 expression in MDA-MB-231 breast cancer cells. Int. J. Mol. Sci. 19, 1–13 - PMC - PubMed

Publication types

MeSH terms

LinkOut - more resources