. 2019 Oct 10;11(10):1527.
doi: 10.3390/cancers11101527.

The PAK1-Stat3 Signaling Pathway Activates IL-6 Gene Transcription and Human Breast Cancer Stem Cell Formation

Affiliations

The PAK1-Stat3 Signaling Pathway Activates IL-6 Gene Transcription and Human Breast Cancer Stem Cell Formation

Ji-Hyang Kim et al. Cancers (Basel). .

Abstract

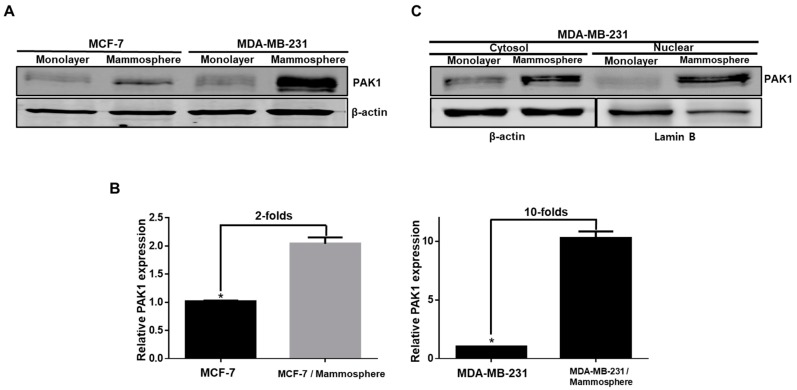
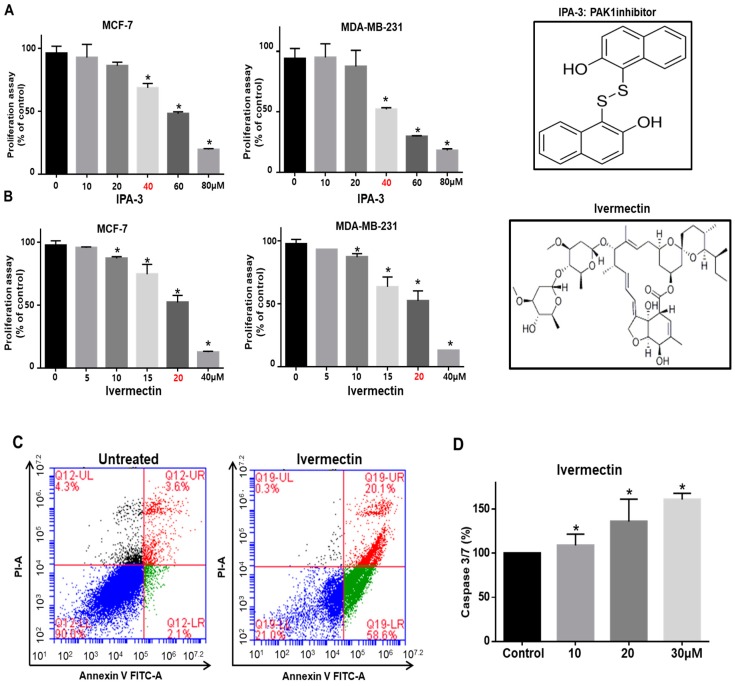
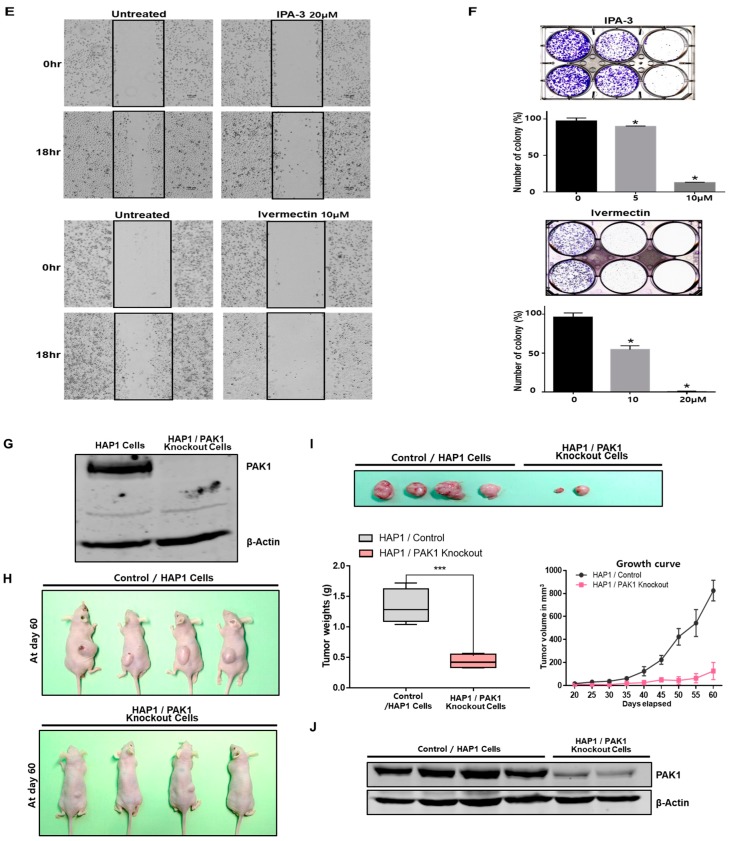
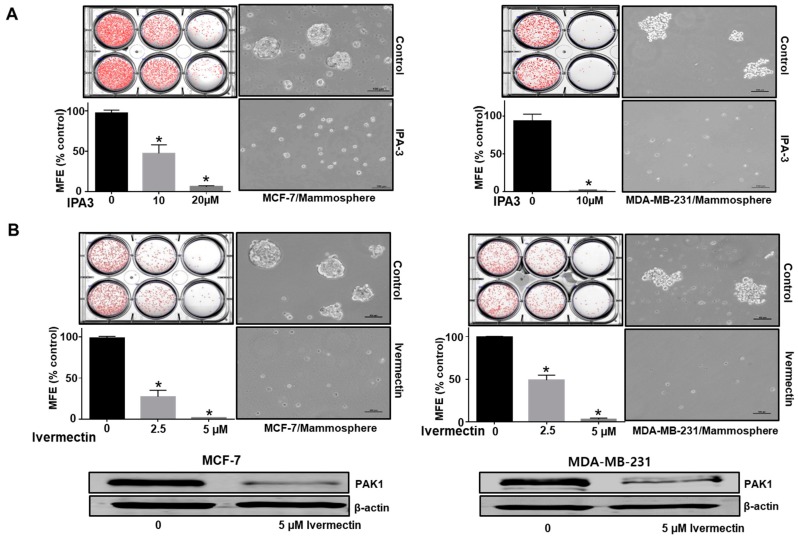
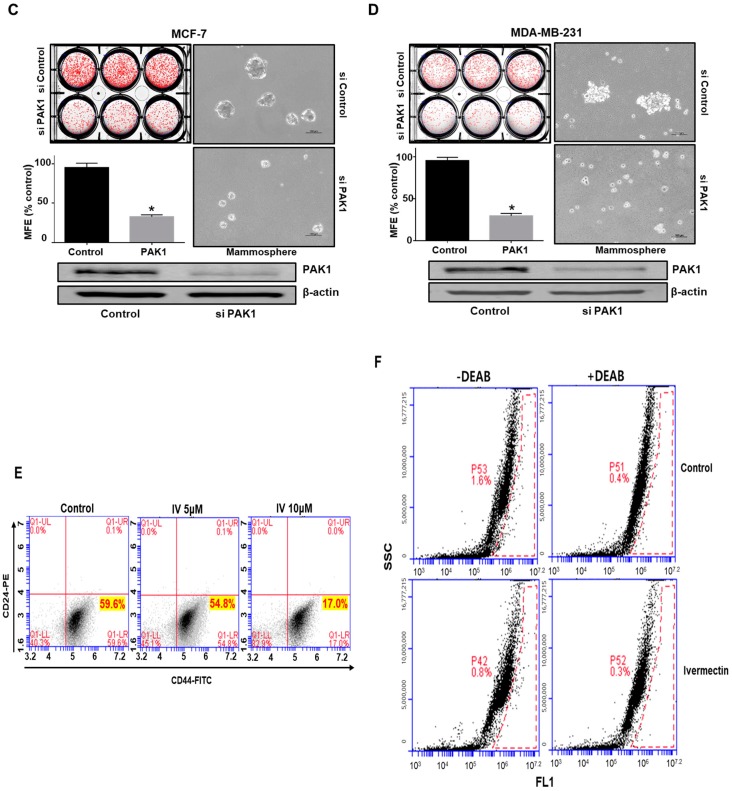
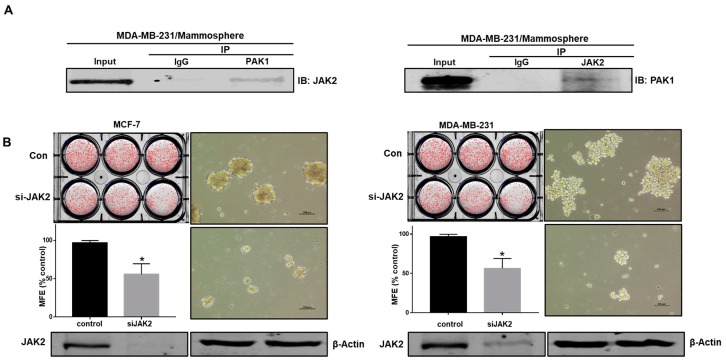
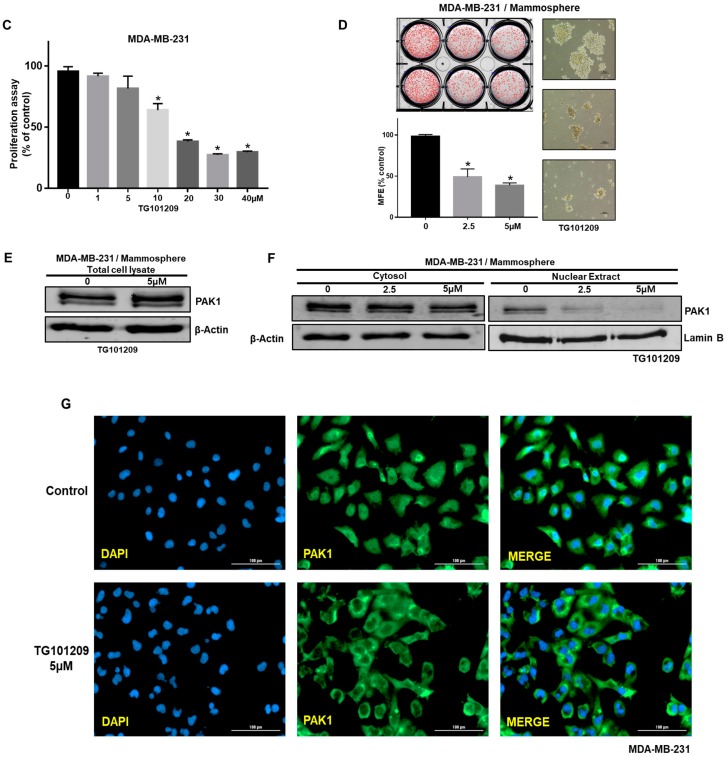
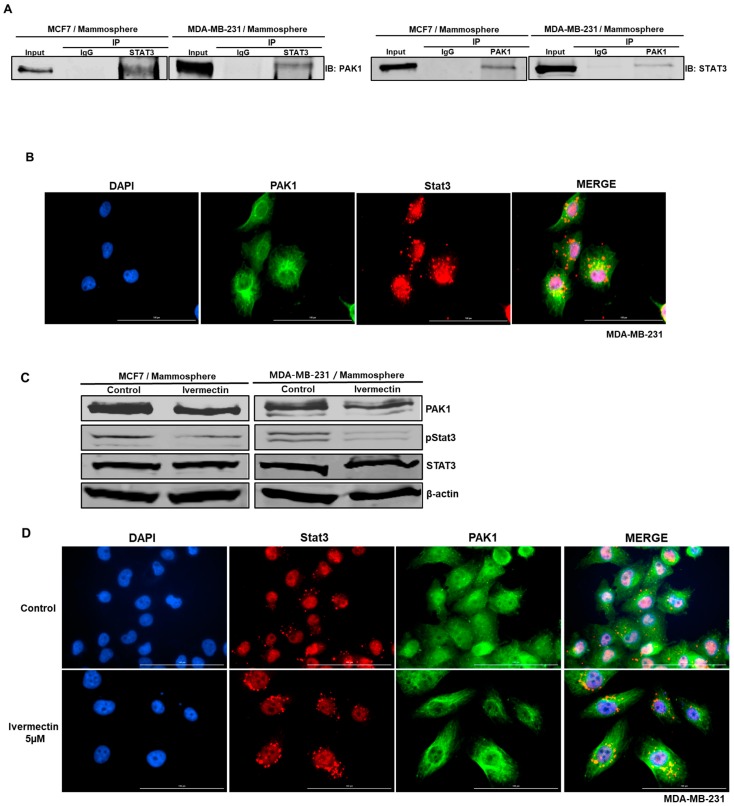
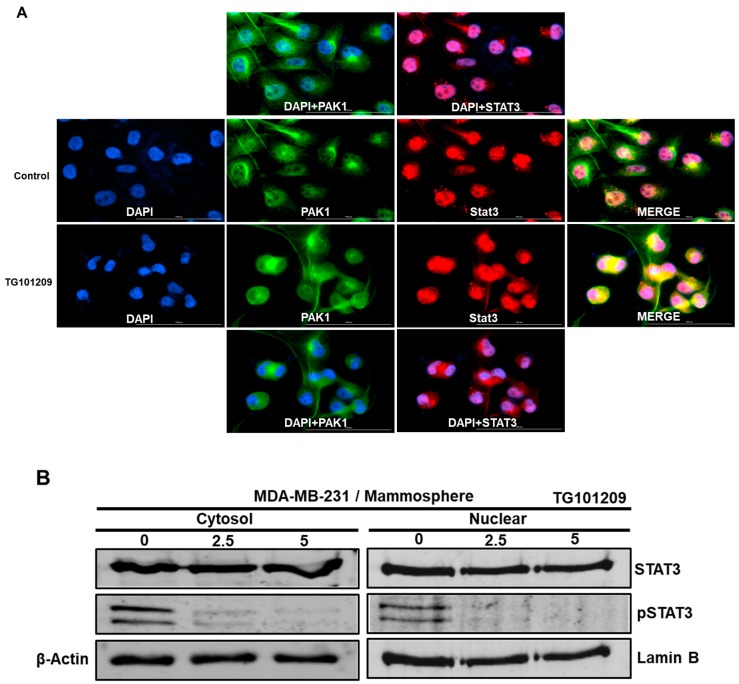
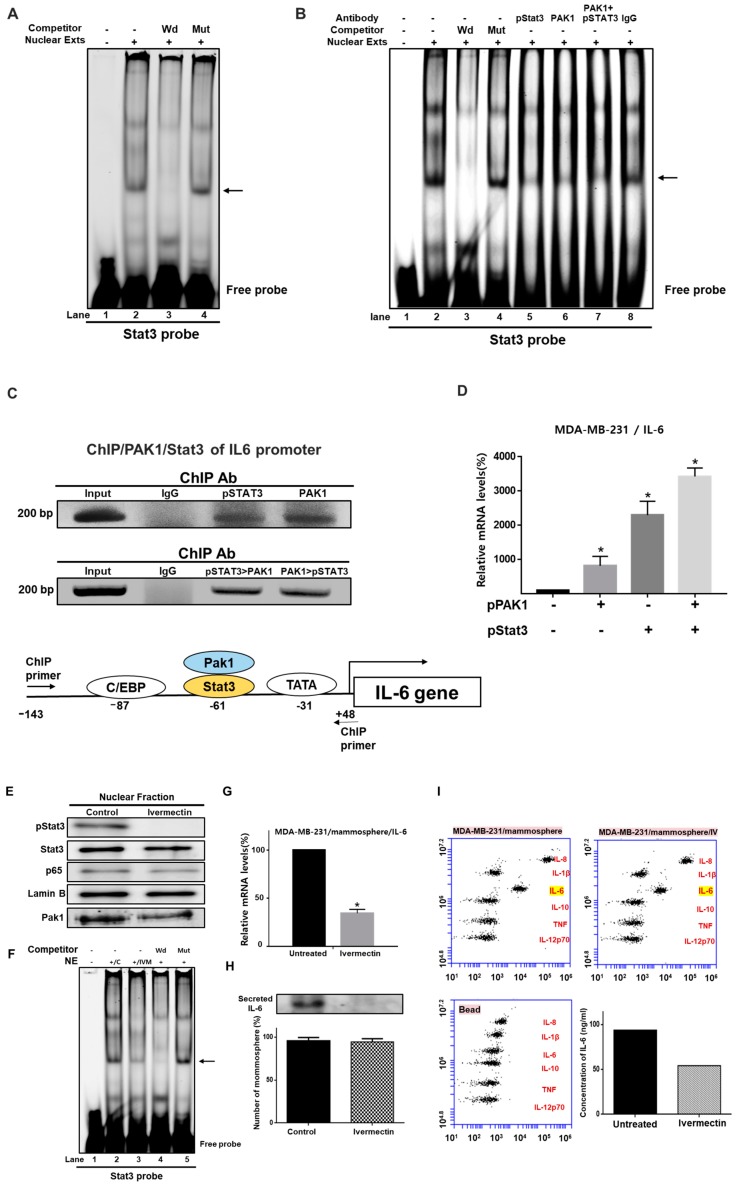
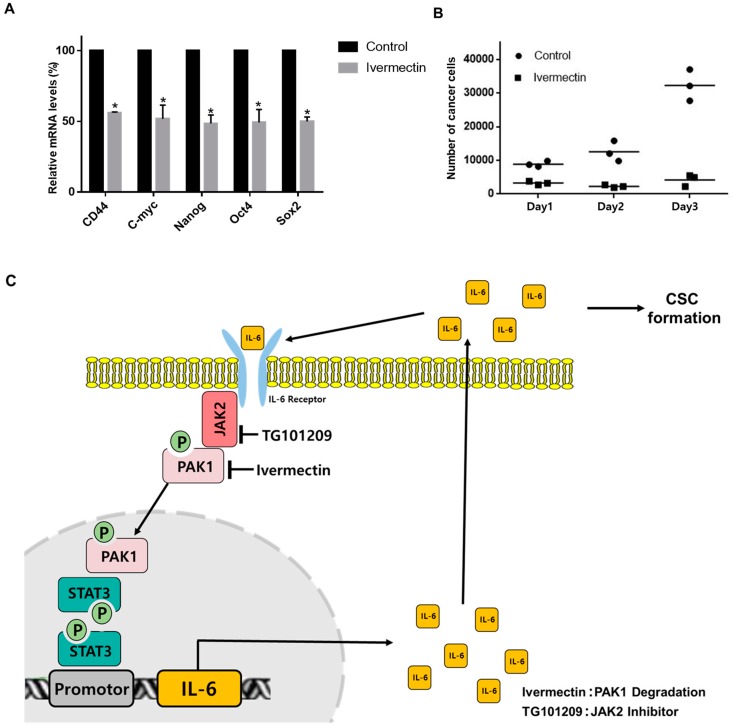
Cancer stem cells (CSCs) have unique properties, including self-renewal, differentiation, and chemoresistance. In this study, we found that p21-activated kinase (PAK1) inhibitor (Group I, PAK inhibitor, IPA-3) and inactivator (ivermectin) treatments inhibit cell proliferation and that tumor growth of PAK1-knockout cells in a mouse model is significantly reduced. IPA-3 and ivermectin inhibit CSC formation. PAK1 physically interacts with Janus Kinase 2 (JAK2), and JAK2 inhibitor (TG101209) treatment inhibits mammosphere formation and reduces the nuclear PAK1 protein level. PAK1 interacts with signal transducer and activator of transcription 3 (Stat3), and PAK1 and Stat3 colocalize in the nucleus. We show through electrophoretic mobility shift assay (EMSA), chromatin immunoprecipitation (ChIP), and reporter assays that the PAK1/Stat3 complex binds to the IL-6 promoter and regulates the transcription of the IL-6 gene. Inhibition of PAK1 and JAK2 in mammospheres reduces the nuclear pStat3 and extracellular IL-6 levels. PAK1 inactivation inhibits CSC formation by decreasing pStat3 and extracellular IL-6 levels. Our results reveal that JAK2/PAK1 dysregulation inhibits the Stat3 signaling pathway and CSC formation, the PAK1/Stat3 complex regulates IL-6 gene expression, PAK1/Stat3 signaling regulates CSC formation, and PAK1 may be an important target for treating breast cancer.

Keywords: IL-6; JAK2; PAK1; Stat3; cancer stem cell; mammosphere.


Conflict of interest statement

The authors declare no conflicts of interest.

Figures

Figure 1
Figure 1
Analysis of PAK1 protein levels in breast cancer stem cells (CSCs). (A) Expression levels of PAK1 protein in breast cancer and CSCs. The expression levels of PAK1 were determined in breast cancer and CSCs by immunoblot using a PAK1 antibody and β-actin. (B) Relative expression of PAK1 in breast cancer and CSCs was estimated by densitometry. (C) Expression levels of cytosolic and nuclear PAK1 protein in breast cancer and CSCs derived from MDA-MB-231 cells. Cytosolic and nuclear PAK1 expression were analyzed in breast cancer and CSCs by immunoblot analysis using a PAK1 antibody. The data are presented as the mean ± SD; n = 3; * p < 0.05 vs. control.
Figure 2
Figure 2
PAK1 inhibition blocks breast cancer hallmark processes. (A,B) Chemical structure of IPA-3 and ivermectin, and the effect of IPA-3 and ivermectin on the proliferation of breast cancer cells. Cancer cells were incubated with IPA-3 and ivermectin for 24 h. The antiproliferation effect of IPA-3 and ivermectin was determined by using an MTS (3-(4,5-dimethylthiazol-2-yl)-5-(3-carboxymethoxyphenyl)-2-(4-sulfophenyl)-2H-tetrazolium) assay. (C) Ivermectin induced apoptosis in cancer cells at the indicated concentration (20 μM). Apoptotic cells were determined using Annexin V/PI staining. (D) The caspase3/7 activity of cancer cells was determined using a Caspase-Glo 3/7 assay kit (Promega). The data are presented as the mean ± standard deviation (SD); n = 3; * p < 0.05 vs. the control. (E) Effect of IPA-3 and ivermectin on cancer cell migration. The migration of cancer cells with or without IPA-3 and ivermectin was photographed at 0 and 18 h. (F) Effect of IPA-3 and ivermectin on colony formation. The one thousand dissociated cancer cells were incubated with IPA-3 and ivermectin for 1 week. Representative images were collected. The data are presented as the mean ± SD; n = 3; * p < 0.05 vs. control. (G) PAK1 expression was analyzed in wild-type and PAK1-knockout HAP1 cells by immunoblot using a PAK1-specific antibody. (H,I) Wild-type and PAK1-knockout HAP1 cell tumor growth in immunodeficient nude mice. The human PAK1-knockout HAP1 cell inhibited tumor growth. Wild-type and PAK1-knockout HAP1 cells (5 × 10⁶ cells) were injected into nude mice subcutaneously. After seven weeks, images were captured with a camera. Tumor volumes were measured using a caliper after seven weeks. * p < 0.05 vs. control. Representative images were captured after five weeks. (J) PAK1 expression in tumors derived from wild-type and PAK1-knockout HAP1 cells was analyzed by western blot assay using a PAK1-specific antibody.
Figure 2
Figure 2
PAK1 inhibition blocks breast cancer hallmark processes. (A,B) Chemical structure of IPA-3 and ivermectin, and the effect of IPA-3 and ivermectin on the proliferation of breast cancer cells. Cancer cells were incubated with IPA-3 and ivermectin for 24 h. The antiproliferation effect of IPA-3 and ivermectin was determined by using an MTS (3-(4,5-dimethylthiazol-2-yl)-5-(3-carboxymethoxyphenyl)-2-(4-sulfophenyl)-2H-tetrazolium) assay. (C) Ivermectin induced apoptosis in cancer cells at the indicated concentration (20 μM). Apoptotic cells were determined using Annexin V/PI staining. (D) The caspase3/7 activity of cancer cells was determined using a Caspase-Glo 3/7 assay kit (Promega). The data are presented as the mean ± standard deviation (SD); n = 3; * p < 0.05 vs. the control. (E) Effect of IPA-3 and ivermectin on cancer cell migration. The migration of cancer cells with or without IPA-3 and ivermectin was photographed at 0 and 18 h. (F) Effect of IPA-3 and ivermectin on colony formation. The one thousand dissociated cancer cells were incubated with IPA-3 and ivermectin for 1 week. Representative images were collected. The data are presented as the mean ± SD; n = 3; * p < 0.05 vs. control. (G) PAK1 expression was analyzed in wild-type and PAK1-knockout HAP1 cells by immunoblot using a PAK1-specific antibody. (H,I) Wild-type and PAK1-knockout HAP1 cell tumor growth in immunodeficient nude mice. The human PAK1-knockout HAP1 cell inhibited tumor growth. Wild-type and PAK1-knockout HAP1 cells (5 × 10⁶ cells) were injected into nude mice subcutaneously. After seven weeks, images were captured with a camera. Tumor volumes were measured using a caliper after seven weeks. * p < 0.05 vs. control. Representative images were captured after five weeks. (J) PAK1 expression in tumors derived from wild-type and PAK1-knockout HAP1 cells was analyzed by western blot assay using a PAK1-specific antibody.
Figure 3
Figure 3
PAK1 induces mammosphere formation and regulates hallmark breast CSC processes. The PAK1 inhibitor IPA-3 and the PAK1 inactivator ivermectin were included in mammosphere induction cultures for one week. (A,B) The effect of IPA-3 and ivermectin on mammosphere formation. Primary mammospheres were treated with IPA-3 (10 and 20 µM) or ivermectin (2.5 and 5 µM). Images were captured by microscopy. (C,D) Effect of PAK1 on mammosphere formation assessed using PAK1 siRNA. PAK1-silenced cells were seeded in ultralow plates and cultured for seven days. Images were captured by microscopy at 10× magnification. The data are presented as the mean ± SD; n = 3; * p < 0.05 vs. control. (E) Effect of ivermectin, which inactivates PAK1, on the breast CSC hallmark CD44+/CD24-positive cell population. The ivermectin (5 μM)-treated CD44+/CD24-cell population was analyzed by flow cytometry. Ten thousand cells were collected. Gating was based on binding of the control antibody (red cross). (F) Effect of ivermectin on ALDH-positive cells. The breast cancer cells were analyzed using an ALDEFLUOR assay. The right panel shows ALDH-positive cancer cells with N, N-diethylaminobenzaldehyde (DEAB), and the left panel represents ALDH-positive cancer cells without DEAB. The ALDH-positive population was gated in a box (red dotted line box).
Figure 3
Figure 3
PAK1 induces mammosphere formation and regulates hallmark breast CSC processes. The PAK1 inhibitor IPA-3 and the PAK1 inactivator ivermectin were included in mammosphere induction cultures for one week. (A,B) The effect of IPA-3 and ivermectin on mammosphere formation. Primary mammospheres were treated with IPA-3 (10 and 20 µM) or ivermectin (2.5 and 5 µM). Images were captured by microscopy. (C,D) Effect of PAK1 on mammosphere formation assessed using PAK1 siRNA. PAK1-silenced cells were seeded in ultralow plates and cultured for seven days. Images were captured by microscopy at 10× magnification. The data are presented as the mean ± SD; n = 3; * p < 0.05 vs. control. (E) Effect of ivermectin, which inactivates PAK1, on the breast CSC hallmark CD44+/CD24-positive cell population. The ivermectin (5 μM)-treated CD44+/CD24-cell population was analyzed by flow cytometry. Ten thousand cells were collected. Gating was based on binding of the control antibody (red cross). (F) Effect of ivermectin on ALDH-positive cells. The breast cancer cells were analyzed using an ALDEFLUOR assay. The right panel shows ALDH-positive cancer cells with N, N-diethylaminobenzaldehyde (DEAB), and the left panel represents ALDH-positive cancer cells without DEAB. The ALDH-positive population was gated in a box (red dotted line box).
Figure 4
Figure 4
PAK1 interacts with JAK2 and induces mammosphere formation in breast cancer. (A) PAK1 and JAK2 were immunoprecipitated from breast cancer cell total protein with anti-PAK1 or anti-JAK2 antibodies. Western blotting was performed using the indicated antibodies. (B) Effect of JAK2 on the formation of mammospheres by cancer cells assessed using siRNA against JAK2. PAK1-silenced cancer cells were incubated in ultralow six-well plates for one week in CSC medium. Images were captured by microscopy at 10× magnification (scale bar; 100 μm). (C,D) Effect of TG101209 on cell proliferation and mammosphere formation. Breast cancer cells were cultured with TG101209 (from 0 to 40 µM) for 24 h. Primary mammospheres were incubated with TG101209 (2.5 and 5.0 µM) or control. The data are presented as the mean ± SD; n = 3; * p < 0.05 vs. control. (E,F) Effect of TG101209 on total levels of PAK1 protein. Cytosolic and nuclear PAK1 protein under TG101209 (2.5 and 5.0 µM) or dimethyl sulfoxide (DMSO) treatment conditions. (G) Immunofluorescence analysis of PAK1 expression in breast cancer cells under TG101209 treatment conditions.
Figure 4
Figure 4
PAK1 interacts with JAK2 and induces mammosphere formation in breast cancer. (A) PAK1 and JAK2 were immunoprecipitated from breast cancer cell total protein with anti-PAK1 or anti-JAK2 antibodies. Western blotting was performed using the indicated antibodies. (B) Effect of JAK2 on the formation of mammospheres by cancer cells assessed using siRNA against JAK2. PAK1-silenced cancer cells were incubated in ultralow six-well plates for one week in CSC medium. Images were captured by microscopy at 10× magnification (scale bar; 100 μm). (C,D) Effect of TG101209 on cell proliferation and mammosphere formation. Breast cancer cells were cultured with TG101209 (from 0 to 40 µM) for 24 h. Primary mammospheres were incubated with TG101209 (2.5 and 5.0 µM) or control. The data are presented as the mean ± SD; n = 3; * p < 0.05 vs. control. (E,F) Effect of TG101209 on total levels of PAK1 protein. Cytosolic and nuclear PAK1 protein under TG101209 (2.5 and 5.0 µM) or dimethyl sulfoxide (DMSO) treatment conditions. (G) Immunofluorescence analysis of PAK1 expression in breast cancer cells under TG101209 treatment conditions.
Figure 5
Figure 5
PAK1 physically interacts with Stat3, PAK1 and Stat3 colocalize in the nucleus and PAK1 inactivation induces Stat3 dephosphorylation. (A) Total protein from breast cancer cells was immunoprecipitated with anti-PAK1 or anti-Stat3 antibodies, followed by immunoblotting using anti-Stat3 or anti-PAK1 antibodies. (B) Immunofluorescence analysis of PAK1 (green) and Stat3 (red) expression in breast cancer cells using the indicated antibodies. Images were captured by microscopy at 10× magnification. (C) Effect of ivermectin on the pStat3 level. (D) Immunofluorescence analysis of PAK1 (green) and Stat3 (red) expression levels in breast cancer cells after ivermectin treatment. Images were captured by microscopy at 10× magnification (scale bar = 100 μm).
Figure 6
Figure 6
Effect of a JAK2 inhibitor on nuclear PAK1 and Stat3 levels and on the colocalization of PAK1 and Stat3. (A) Immunofluorescence analysis of PAK1 (green) and Stat3 (red) expression in breast cancer cells using anti-PAK1 and anti-Stat3 antibodies after TG101209 treatment. Images were captured by microscopy at 10× magnification. (B) Effect of TG101209 on cytosolic and nuclear pStat3 protein levels.
Figure 7
Figure 7
PAK1 affects IL-6 gene expression through Stat3-mediated regulation. (A) Electrophoretic mobility shift assay (EMSA) using mammosphere nuclear proteins. Nuclear proteins were incubated with an IRDye 800-Stat probe at room temperature and separated by 6% native PAGE. Lane 1: stat probe; lane 2: nuclear proteins with stat probe; lane 3: 10-fold concentration of the self-competitor oligo; lane 4: nuclear proteins incubated with a 10-fold concentration of the mutated-Stat3 probe. The arrow indicates the DNA/Stat3 complex in mammosphere nuclear lysates. (B) EMSA analysis of PAK1 and Stat3 binding to the Stat3 DNA-binding sequence. Lane 1: Stat probe only; lane 2: nuclear proteins with Stat probe; lane 3: 10-fold concentration of the self-competitor oligo; lane 4: 10-fold concentration of the mutated Stat probe; lane 5: pStat3 antibody; lane 6: PAK1 antibody; lane 7: pStat3 and PAK1 antibody; lane 8: IgG. The arrow indicates the Stat3/PAK1/DNA complex in nuclear proteins. (C) ChIP (chromatin immunoprecipitation) analysis of Stat3 and PAK1 recruitment to the IL-6 gene promoter region in breast cancer cells. Double-ChIP analysis of the Stat3-PAK1/DNA complex binding to the human IL-6 gene promoter in breast cancer cells. The first ChIP was performed with an anti-pStat3 or anti-PAK1 antibody, followed by a second ChIP with an anti-PAK1 or anti-pStat3 antibody, respectively. Input represents 1% of the sonicated DNA. (D) RT-qPCR analysis of human IL-6 mRNA levels in breast cancer cells transiently overexpressing PAK1 and Stat3 genes. The relative mRNA expression levels are presented. The data are presented as the mean ± SD; n = 3; * p < 0.05 vs. control vector. (E) Nuclear levels of Stat3 and NF-κB (p65) protein in mammospheres were examined with antibodies against Stat3 and p65. Ivermectin treatment reduced nuclear pStat3 levels in the mammospheres. (F) EMSA of lysates of mammospheres treated with ivermectin. Nuclear proteins were treated with an IRDye 800-Stat sequence probe and separated by 6% native PAGE. Lane 1: stat probe; lane 2: nuclear proteins with stat probe; lane 3: ivermectin-treated proteins with stat probe; lane 4: 10-fold concentration of self-competitor oligo; lane 5: 10-fold concentration of mutated Stat3 oligo. Ivermectin treatment decreases the DNA/Stat3 interaction in mammosphere nuclei. (G) Transcriptional levels of the human IL-6 gene were assayed in ivermectin-treated cells using IL-6-specific primers. β-actin expression was used to normalize the values. The data are presented as the mean ± SD; n = 3; * p < 0.05 vs. control. (H) Immunoblot analysis of culture medium from mammospheres using an IL-6 antibody and equal numbers of mammospheres as a control. Ivermectin treatment reduced extracellular IL-6 levels in mammosphere culture medium. (I) The cytokine profiles of conditioned media from mammosphere cultures were determined with cytokine-specific antibodies and cytokine beads. Ivermectin reduced extracellular IL-6 levels in the mammosphere cultures.
Figure 8
Figure 8
The effects of ivermectin, a PAK1 inactivator, on CSC loads in breast cancer. (A) Transcriptional levels of Sox2, Oct4, CD44, c-Myc, and Nanog genes were analyzed in ivermectin-treated mammospheres using specific primers. β-actin was used as a control. (B) Effect of ivermectin on mammosphere growth. Ivermectin treatment prevents mammosphere proliferation. Ivermectin-treated mammospheres were dissociated into single cells and plated in 6-well plates in equal numbers. Twenty-four hours after plating, the cells were counted. Two and 3 days later, the cells were counted. The data are presented as the mean ± SD; n = 3; * p < 0.05 vs. control. (C) The proposed model for CSC formation by JAK2/PAK1/Stat3/IL-6. IL-6-induced JAK2 and PAK1 interaction. JAK2 inhibitor (TG101209) and PAK1 inactivator (ivermectin) treatment blocks the Stat3 signaling pathway and IL-6 gene expression and inhibits CSC formation. TG101209 and ivermectin treatment reduces extracellular IL-6 and Stat3 signaling. Extracellular IL-6 induces the conversion of cancer cells to CSCs. PAK1/Stat3 regulates CSC formation through Stat3 signaling and extracellular IL-6.

References

    1. Marotta L.L., Almendro V., Marusyk A., Shipitsin M., Schemme J., Walker S.R., Bloushtain-Qimron N., Kim J.J., Choudhury S.A., Maruyama R., et al. The JAK2/STAT3 signaling pathway is required for growth of CD44(+)CD24(−) stem cell-like breast cancer cells in human tumors. J. Clin. Investig. 2011;121:2723–2735. doi: 10.1172/JCI44745. - DOI - PMC - PubMed
    1. Frank N.Y., Schatton T., Frank M.H. The therapeutic promise of the cancer stem cell concept. J. Clin. Investig. 2010;120:41–50. doi: 10.1172/JCI41004. - DOI - PMC - PubMed
    1. Liu S., Wicha M.S. Targeting breast cancer stem cells. J. Clin. Oncol. 2010;28:4006–4012. doi: 10.1200/JCO.2009.27.5388. - DOI - PMC - PubMed
    1. Rosen J.M., Jordan C.T. The increasing complexity of the cancer stem cell paradigm. Science. 2009;324:1670–1673. doi: 10.1126/science.1171837. - DOI - PMC - PubMed
    1. Woodward W.A., Chen M.S., Behbod F., Alfaro M.P., Buchholz T.A., Rosen J.M. WNT/beta-catenin mediates radiation resistance of mouse mammary progenitor cells. Proc. Natl. Acad. Sci. USA. 2007;104:618–623. doi: 10.1073/pnas.0606599104. - DOI - PMC - PubMed

LinkOut - more resources