Case Reports
. 2020 Jan;10(1):54-71.
doi: 10.1158/2159-8290.CD-19-1167. Epub 2019 Oct 28.

The KRASG12C Inhibitor MRTX849 Provides Insight toward Therapeutic Susceptibility of KRAS-Mutant Cancers in Mouse Models and Patients

Affiliations
Case Reports

The KRASG12C Inhibitor MRTX849 Provides Insight toward Therapeutic Susceptibility of KRAS-Mutant Cancers in Mouse Models and Patients

Jill Hallin et al. Cancer Discov. 2020 Jan.

Abstract

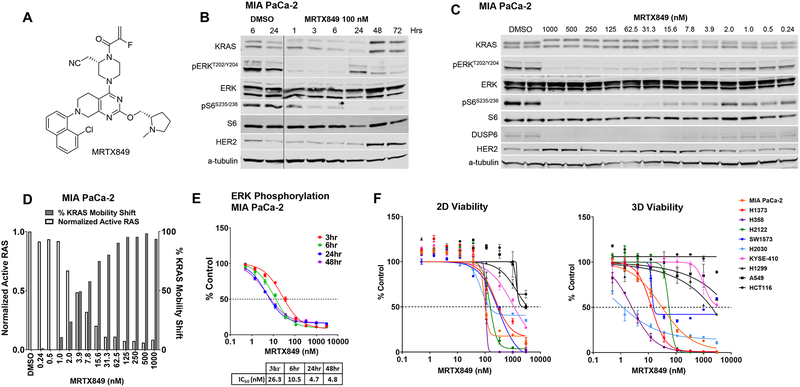
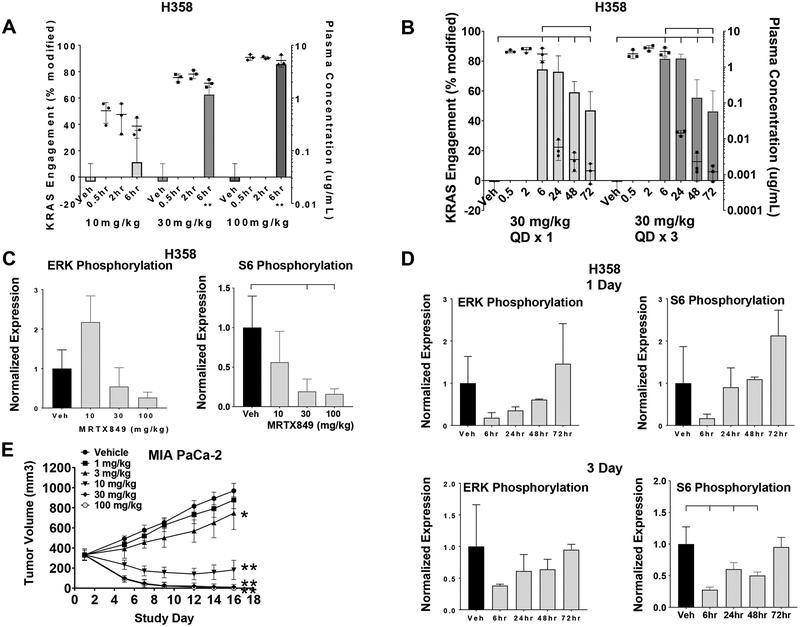
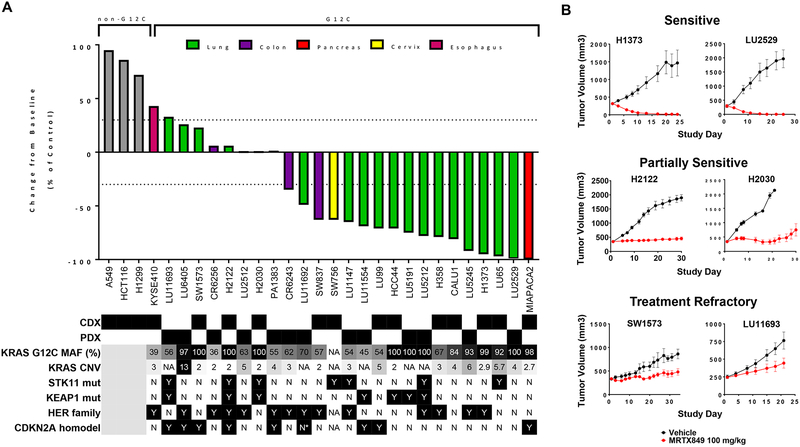
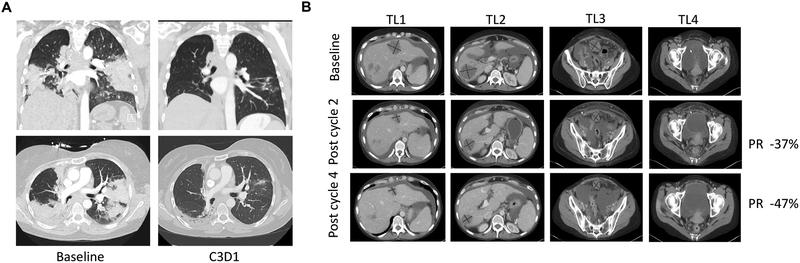
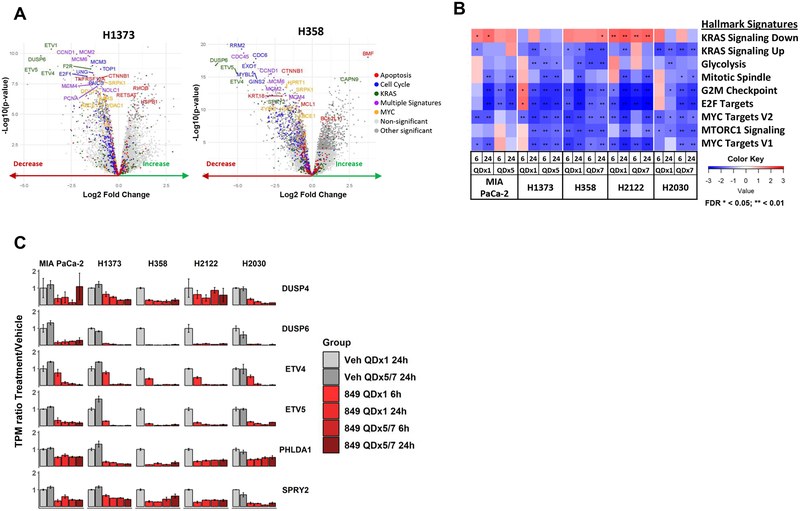
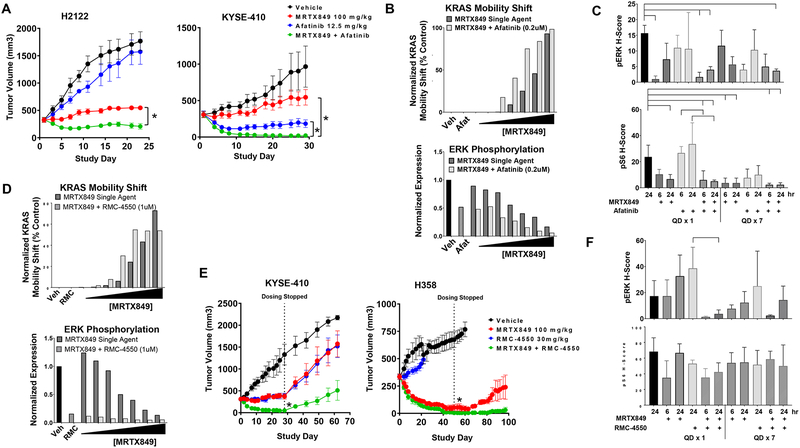
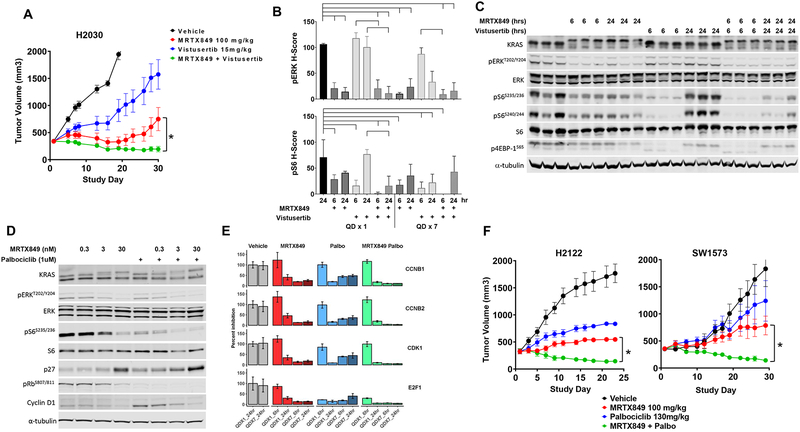
Despite decades of research, efforts to directly target KRAS have been challenging. MRTX849 was identified as a potent, selective, and covalent KRASG12C inhibitor that exhibits favorable drug-like properties, selectively modifies mutant cysteine 12 in GDP-bound KRASG12C, and inhibits KRAS-dependent signaling. MRTX849 demonstrated pronounced tumor regression in 17 of 26 (65%) KRASG12C-positive cell line- and patient-derived xenograft models from multiple tumor types, and objective responses have been observed in patients with KRASG12C-positive lung and colon adenocarcinomas. Comprehensive pharmacodynamic and pharmacogenomic profiling in sensitive and partially resistant nonclinical models identified mechanisms implicated in limiting antitumor activity including KRAS nucleotide cycling and pathways that induce feedback reactivation and/or bypass KRAS dependence. These factors included activation of receptor tyrosine kinases (RTK), bypass of KRAS dependence, and genetic dysregulation of cell cycle. Combinations of MRTX849 with agents that target RTKs, mTOR, or cell cycle demonstrated enhanced response and marked tumor regression in several tumor models, including MRTX849-refractory models. SIGNIFICANCE: The discovery of MRTX849 provides a long-awaited opportunity to selectively target KRASG12C in patients. The in-depth characterization of MRTX849 activity, elucidation of response and resistance mechanisms, and identification of effective combinations provide new insight toward KRAS dependence and the rational development of this class of agents.See related commentary by Klempner and Hata, p. 20.This article is highlighted in the In This Issue feature, p. 1.


Conflict of interest statement

Disclosure of conflict of interest: J.H., L.D.E., L.H., A.C., R.A., D.M.B., N.S., V.B., K.V., R.C., J.B., M.A.M., P.O, and J.G.C. are employees and shareholders of Mirati Therapeutics, Inc. A.P. is a shareholder of Mirati Therapeutics, Inc. B.R.B. M.R.B., J.B.F., J.P.F., and G.P.V. are employees and shareholders of Array BioPharma. J.B. is a former employee and shareholders of Array BioPharma. MSKCC has received research funds from Mirati Therapeutics which have been applied, in part, to research directed by P.L. P.A.J. is a compensated Scientific Advisor for Mirati Therapeutics.

Figures

Figure 1.
Figure 1.
MRTX849 is a potent, covalent KRASG12C inhibitor in vitro. (A) Structure of MRTX849. (B) Immunoblot protein western analyses of KRAS pathway targets in MIA PaCa-2 cells treated from 1 hours to 72 hours with MRTX849 at 100 nM. (C) Immunoblot protein western analyses of KRAS pathway targets in MIA PaCa-2 cells treated for 24 hours with MRTX849 over a 13-point dose response. |(D) Left y-axis shows Active RAS ELISA assay to determine the reduction in RAS-GTP abundance following MRTX849 treatment in MIA PaCa-2 cells for 24 hours. The vehicle value was normalized to 1 by dividing all average values by the vehicle value. Right y-axis shows quantitation of KRAS band shift by MRTX849 treatment in MIA PaCa-2 cells for 24 hours as assessed by western blot and densitometry. (E) In-Cell Western blot assay to evaluate modulation of pERK in MIA PaCa-2 cells grown in standard tissue culture conditions treated with MRTX849 over a time course. (F) CellTiter-Glo assay to evaluate cell viability performed on seven KRASG12C-mutant cell lines and three non-KRASG12C-mutant cell lines cells grown in 2D tissue culture conditions in a 3-day assay (left panel) or 3D conditions using 96-well, ULA plates in a 12-day assay (right panel).
Figure 2.
Figure 2.
MRTX849 modifies KRASG12C and inhibits KRAS signaling and tumor growth in vivo. (A) MRTX849 was administered orally as a single dose to mice bearing established H358 xenografts (average tumor volume ~350 mm3) at 10, 30 and 100 mg/kg. KRAS modification and MRTX849 plasma concentration data from n=3 mice are shown as mean +/− standard deviation (SD). KRASG12C modification was statistically significant vs vehicle control using the two-tailed Student’s t-test. “**” indicates p-value < 0.01. (B) MRTX849 was administered orally as a single dose or daily for three days to mice bearing established H358 xenografts (average tumor volume ~350 mm3) at 30 mg/kg. Plasma was collected 0.5, 2, 6, 24, 48 and 72 hours post administration of the last dose and tumors were collected 6, 24, 48 and 72 hours post dose. KRASG12C modification and MRTX849 plasma concentration data are shown from n=3 mice as mean +/− SD. Induction of modified KRASG12C protein at all time points was determined to be statistically significant vs. vehicle control using two-way ANOVA. In addition, induction of modified KRASG12C protein at 72 hours in Day 1 samples and 48 and 72 hours in Day 3 samples was statistically significant vs the 6-hour time point. Brackets indicate p-value < 0.05 as compared from left-most sample. (C) MRTX849 was administered as in (A). Tumors were collected six hours post dose and total and phosphorylated ERK1/2 and total and phosphorylated S6 were analyzed by immunoblot and quantified by densitometric analysis. Relative fluorescent intensity of pERK1/2 and pS6 were normalized by dividing pERK1/2 and pS6 by total ERK1/2 and total S6, respectively. Vehicle tumors were normalized to 1 by dividing all average values by the vehicle value. Average pERK1/2 and pS6 values were divided by the average value in vehicle-treated tumors. Data shown represent the average of 2–3 tumors per treatment group plus SD. Reduction of pS6 relative fluorescent intensity was determined to be statistically significant vs vehicle control using the two-tailed Student’s t-test. Brackets indicate p-value <0.05 compared to left-most sample. (D) MRTX849 was administered as in (B). Tumors were collected 6, 24, 48 or 72 hours post administration of the last dose and total and phosphorylated ERK1/2 and total and phosphorylated S6 were analyzed as in (C). Data shown represent the average of 3–4 tumors per treatment group plus SD. Reduction of pS6 relative fluorescent intensity on Day 3 was determined to be statistically significant vs vehicle control using two-way ANOVA. Brackets indicate p-value < 0.05 compared to left-most sample. (E) MRTX849 was administered via daily oral gavage at the doses indicated to mice bearing established MIA PaCa-2 xenografts. Dosing was initiated when tumors were ~350 – 400 mm3. MRTX849 was administered to mice daily until Day 16. Data are shown as mean tumor volume +/− standard error of the mean (SEM). Tumor volumes at Day 16 were determined to be statistically significant vs vehicle control two-tailed Student’s t-test. “**” indicates p-value < 0.01. “*” indicates p-value < 0.05.
Figure 3.
Figure 3.
Anti-tumor activity of MRTX849 in KRASG12C-mutant and non KRASG12C-mutant human tumor xenografts models. (A) MRTX849 was administered via oral gavage at 100 mg/kg QD to mice bearing the cell line xenograft or PDX model indicated. Dosing was initiated when tumors were, on average, ~250 – 400 mm3. MRTX849 was formulated as a free base and resuspended as a solution in 10% Captisol, 50 mM citrate buffer, pH 5.0. The % change from baseline control was calculated at Day 19–22 for most models. Statistical significance was determined for each model and is shown in Table S6. Status of mutations and alterations in key genes are shown below each model. MAF (%) - Percent KRASG12C-mutant allele fraction by RNAseq; CNV – Copy number variation; * denotes very high CDK4 expression by RNAseq and possible amplification. HER family status was determined by averaging EGFR, ERBB2 and ERBB3 RNAseq expression for CDX (CCLE) or PDX (Crown huBase) models. Positive HER family calls denote greater than the median expression of the models tested. CDX and PDX model HER family calls were determined independently. (B) Tumor growth inhibition plots from representative xenograft models that were categorized as sensitive, partially sensitive and treatment refractory.
Figure 4.
Figure 4.
Activity of MRTX849 in Lung and Colon Cancer Patients (A) Pretreatment and 6-week scans of a heavily pretreated patient with a KRASG12C mutation-positive lung adenocarcinoma indicating 33% reduction of target lesions. Patient continues on study. The top panels show a coronal view and bottom panels an axial view of computed tomography (CT) chest images prior to MRTX849 treatment (left) and after two cycles of MRTX849 treatment (right). (B) Baseline, 6-week (Cycle 2) and 12-week (Cycle 4) scans of a patient with a KRASG12C mutation-positive colon adenocarcinoma. Partial response confirmed at Cycle 4 and patient continues on study. Four lesions (TL1–4) are shown with axial views of CT images prior to MRTX849 treatment (top), after two cycles of MRTX849 treatment (center), and after four cycles of MRTX849 treatment (bottom).
Figure 5.
Figure 5.
MRTX849 treatment in vivo regulates KRAS-dependent oncogenic signaling and feedback inhibitory pathways. (A) Volcano plots displaying differentially expressed genes in xenograft tumors 24 hours after oral administration of vehicle or 100 mg/kg MRTX849 in a representative MRTX849-sensitive (H1373) and MRTX849-partially sensitive (H358) model. Significance denoted in the legend (adjusted p-value < 0.01). (B) GSEA heatmaps depicting Hallmark Signature pathways differentially regulated in at least one model 24 hours following oral administration of a single 100 mg/kg MRTX849 dose compared to vehicle. Normalized Enrichment Score shown in all models 6 or 24 hours after a single dose (QDx1) or five (QDx5) or seven (QDx7) days dosing. (C) Genes that feedback inhibit MAP kinase signaling are down regulated following MRTX849 treatment in all five cell line xenografts assessed by RNA-sequencing.
Figure 6.
Figure 6.
HER family and SHP2 inhibitor combinations further inhibit KRAS signaling and exhibit increased anti-tumor responses. (A) MRTX849 at 100 mg/kg, afatinib at 12.5 mg/kg or the combination was administered daily via oral gavage to mice bearing the H2122 or KYSE-410 cell line xenografts (n=5). Combination treatment led to a statistically significant decrease in tumor growth compared to either single agent treatment. “*” denotes adjusted p-value < 0.01. (B Quantification of KRAS mobility shift and pERK in H2122 cells treated for 24 hours with MRTX849 (0.1 – 73 nM), afatinib (200 nM) or the combination assessed by western blot densitometry. (C) MRTX849 at 100 mg/kg, afatinib at 12.5mg/kg, or the combination was administered once or daily for 7 days via oral gavage to mice bearing H2122 cell line xenografts (n=3/group). Tumors were harvested at 6 and 24 hours following the final dose. Tumor sections were stained with pERK and pS6 via immunohistochemistry methods. Quantitation of images shown by H-score in tumor tissue. Reduction of pERK or pS6 staining intensity was determined to be statistically significant relative to vehicle or either single agent using one-way ANOVA. Brackets indicate p-value <0.05 compared to left-most sample. (D) Quantitation of KRAS band shift and pERK after 24 hour treatment with MRTX849 (0.1 – 73 nM), RMC-4550 (1 uM) or the combination in H358 cells assessed by western blot densitometry. (E) MRTX849 at 100 mg/kg, RMC-4550 at 30 mg/kg or the combination was administered daily via oral gavage to mice bearing the KYSE-410 or H358 cell line xenografts (n=5/group). Combination treatment led to a statistically significant reduction in tumor growth compared to either single agent on the last day of dosing. “*” denotes adjusted p-value < 0.05. (F) MRTX849 at 100 mg/kg, RMC-4550 at 30mg/kg, or the combination was administered via oral gavage to mice bearing KYSE-410 cell line xenografts (n=3/group) and tumors were harvested at 6 and 24 hours post dose. Tumor sections were stained with pERK, pS6 via immunohistochemistry methods. Quantitation of images shown by H-score in tumor tissue. Reduction of pERK staining intensity was determined to be statistically significant relative to RMC-4550 alone using one-way ANOVA. Brackets indicate p-value <0.05 compared to left-most sample.
Figure 7.
Figure 7.
CDK4/6 and mTOR combinations suppress independently hyperactivated downstream pathways and exhibit increased anti-tumor responses. (A) MRTX849 at 100 mg/kg, vistusertib at 15 mg/kg or the combination was administered daily via oral gavage to mice bearing the H2122 or H2030 cell line xenografts (n=5/group). Combination treatment led to a statistically significant decrease in tumor growth compared to either single agent treatment. “*” denotes adjusted p-value < 0.05. (B) MRTX849 at 100 mg/kg, vistusertib at 15 mg/kg, or the combination was administered once or daily for 7 days via oral gavage to mice bearing H2030 cell line xenografts (n=3/group). Tumors were harvested at 6 and 24 hours following the final dose. Tumor sections were stained with pERK and pS6 via immunohistochemistry methods. Quantitation of images shown by H-score in tumor tissue. Reduction of pERK or pS6 staining intensity was determined to be statistically significant relative to vehicle or either single agent using one-way ANOVA. Brackets indicate p-value <0.05 compared to left-most sample. (C) Protein western blot analysis of KRAS pathway targets in H2030 xenografts treated with MRTX849 (100 mg/kg), vistusertib (15 mg/kg) or the combination, six or 24 hours after a single dose. (D) Protein western blot analysis of KRAS pathway and cell cycle targets in H2122 cells treated for 24 hours with MRTX849, palbociclib or the combination. (E) Normalized RNAseq gene expression data on E2F targets in H2122 xenografts treated with MRTX849, palbociclib or the combination, six and 24 hours after a single or seven daily doses. (F) MRTX849 at 100 mg/kg, palbociclib at 130 mg/kg or the combination was administered daily via oral gavage to mice bearing the H2122 or SW1573 cell line xenografts (n=5). Combination treatment led to a statistically significant decrease in tumor growth compared to either single agent treatment. “*” denotes adjusted p-value < 0.05

Comment in

References

    1. John J, Sohmen R, Feuerstein J, Linke R, Wittinghofer A, and Goody RS, Kinetics of interaction of nucleotides with nucleotide-free H-ras p21. Biochemistry, 1990. 29(25): p. 6058–65. - PubMed
    1. Matikas A, Mistriotis D, Georgoulias V, and Kotsakis A, Targeting KRAS mutated non-small cell lung cancer: A history of failures and a future of hope for a diverse entity. Crit Rev Oncol Hematol, 2017. 110: p. 1–12. - PubMed
    1. Sanchez-Vega F, Mina M, Armenia J, Chatila WK, Luna A, La KC, et al., Oncogenic Signaling Pathways in The Cancer Genome Atlas. Cell, 2018. 173(2): p. 321–337 e10. - PMC - PubMed
    1. Simanshu DK, Nissley DV, and McCormick F, RAS Proteins and Their Regulators in Human Disease. Cell, 2017. 170(1): p. 17–33. - PMC - PubMed
    1. Janes MR, Zhang J, Li LS, Hansen R, Peters U, Guo X, et al., Targeting KRAS Mutant Cancers with a Covalent G12C-Specific Inhibitor. Cell, 2018. 172(3): p. 578–589 e17. - PubMed

Publication types

MeSH terms