. 2020 Jan 6;217(1):e20181184.
doi: 10.1084/jem.20181184.

Collective cancer invasion forms an integrin-dependent radioresistant niche

Affiliations

Collective cancer invasion forms an integrin-dependent radioresistant niche

Anna Haeger et al. J Exp Med. .

Abstract

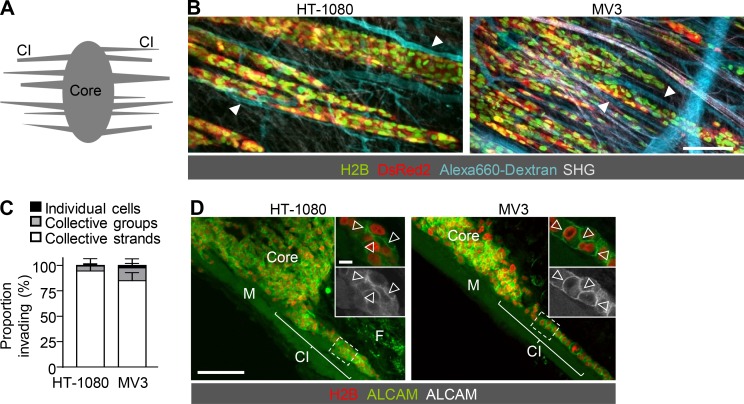
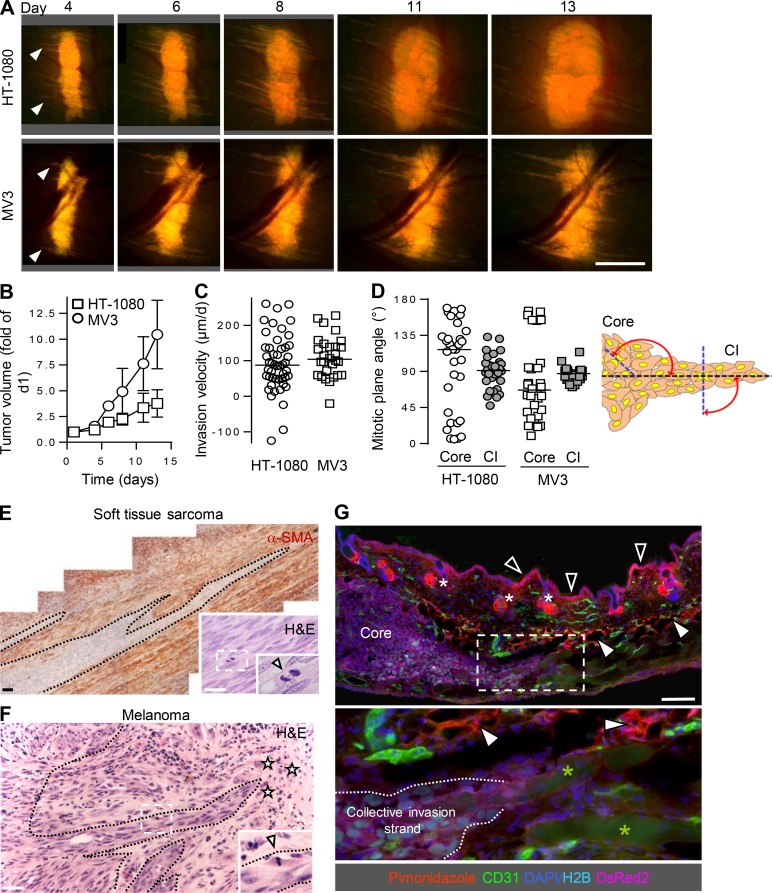
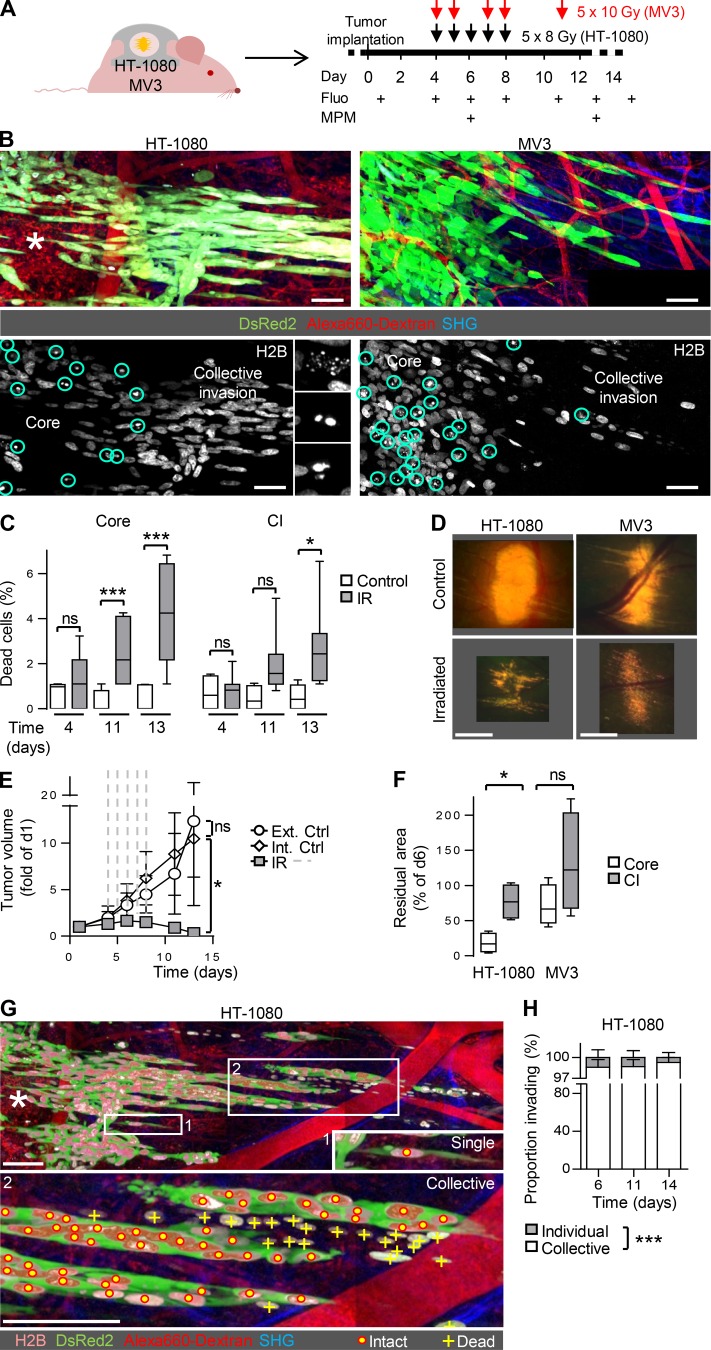
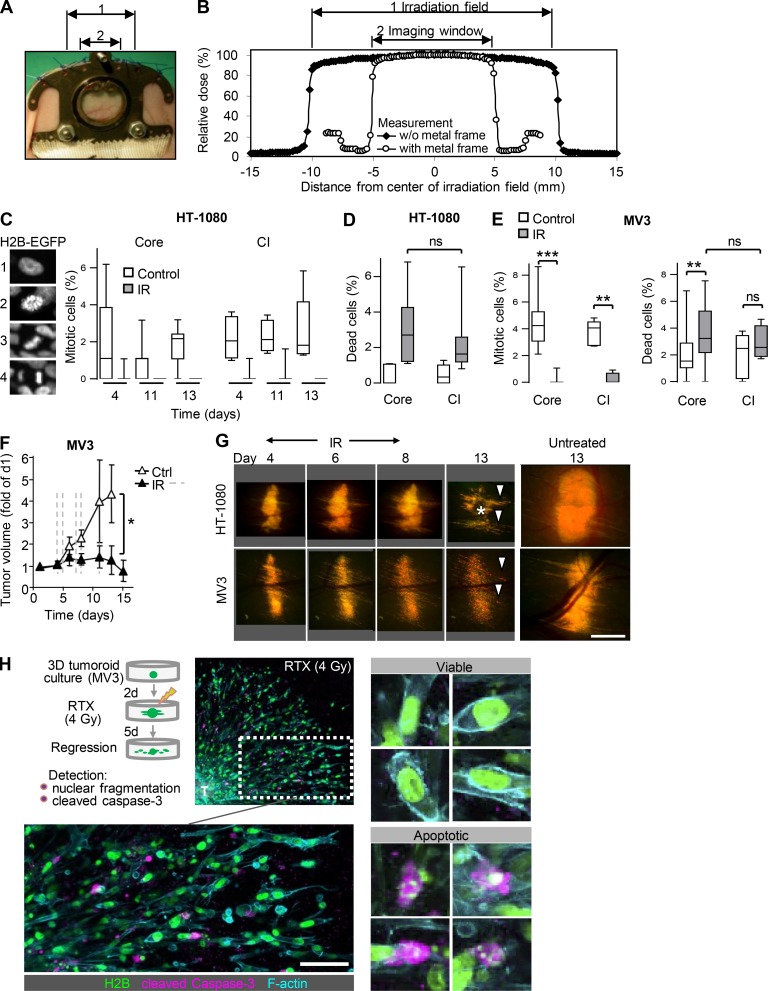
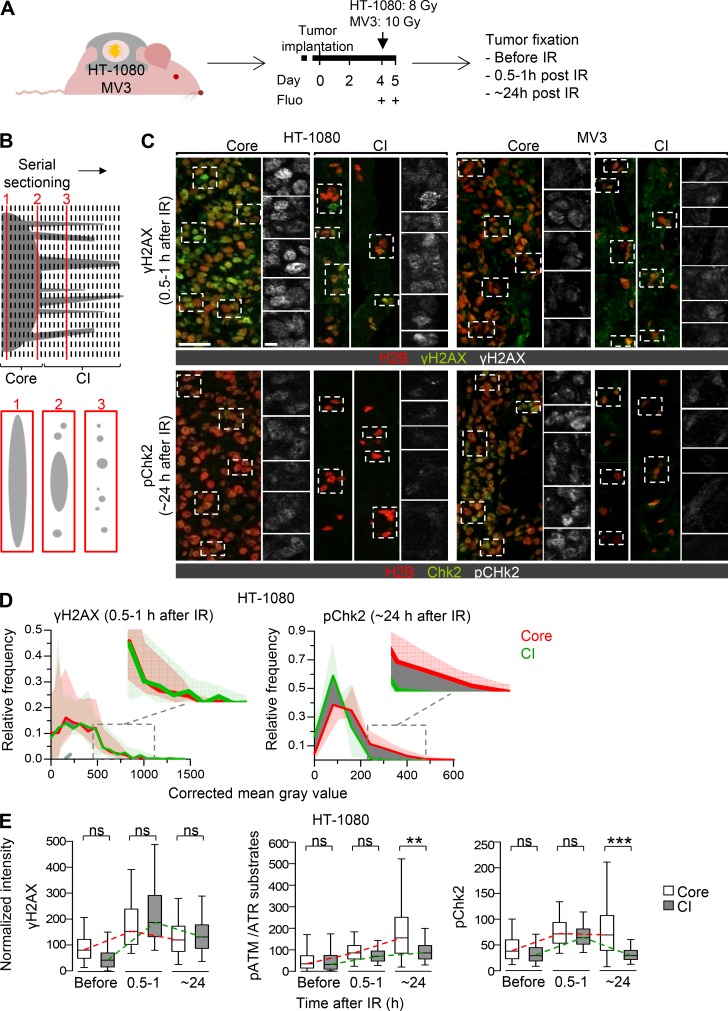
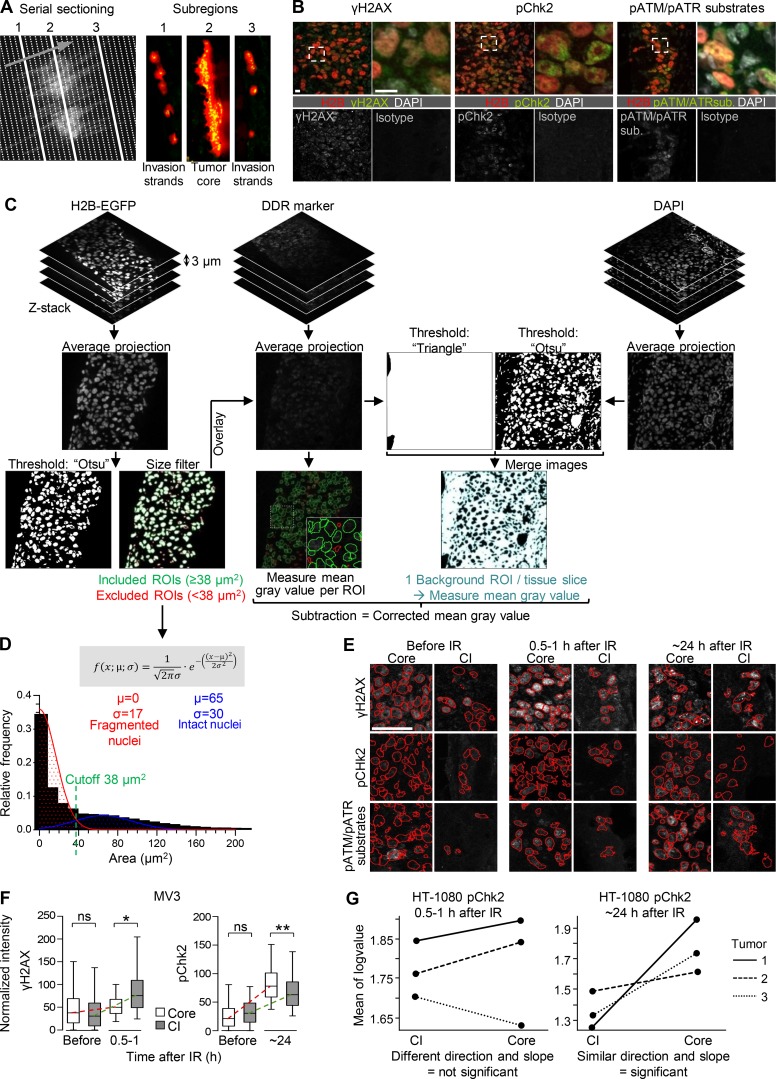
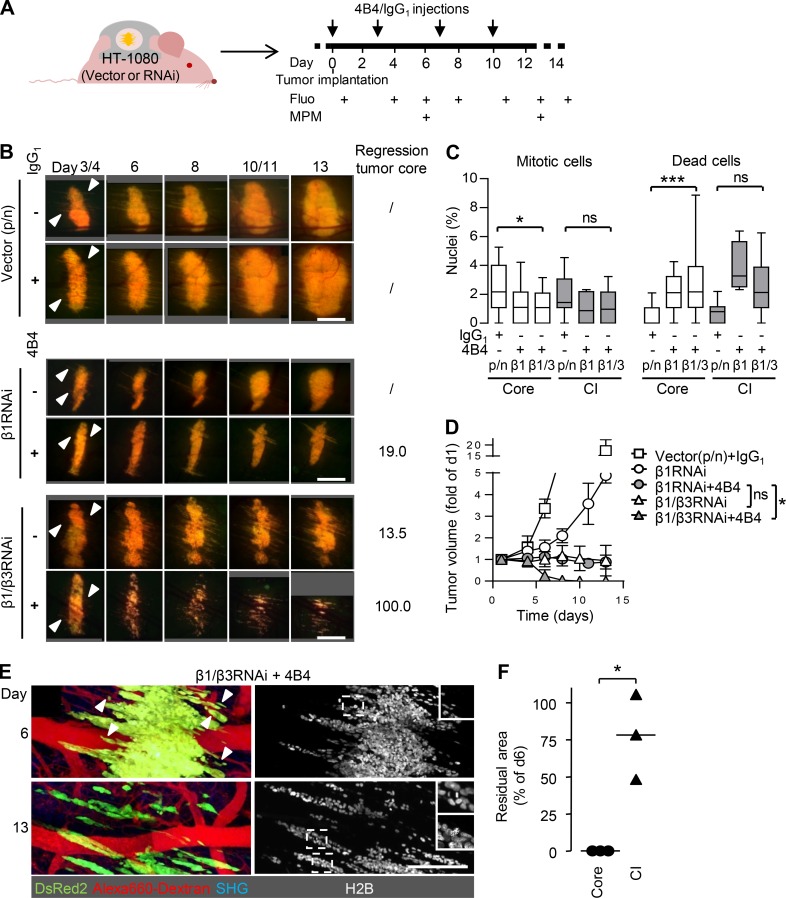
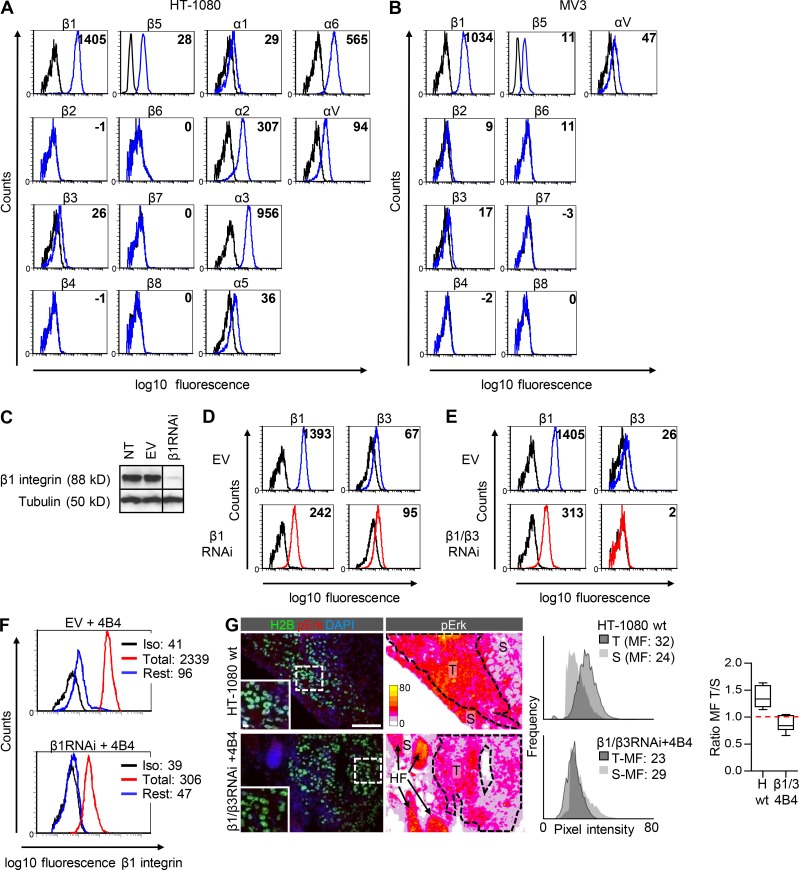
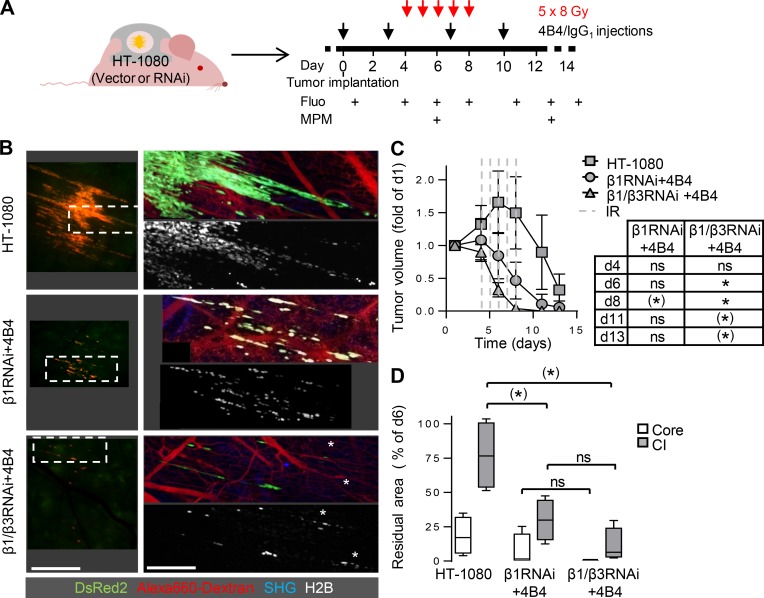
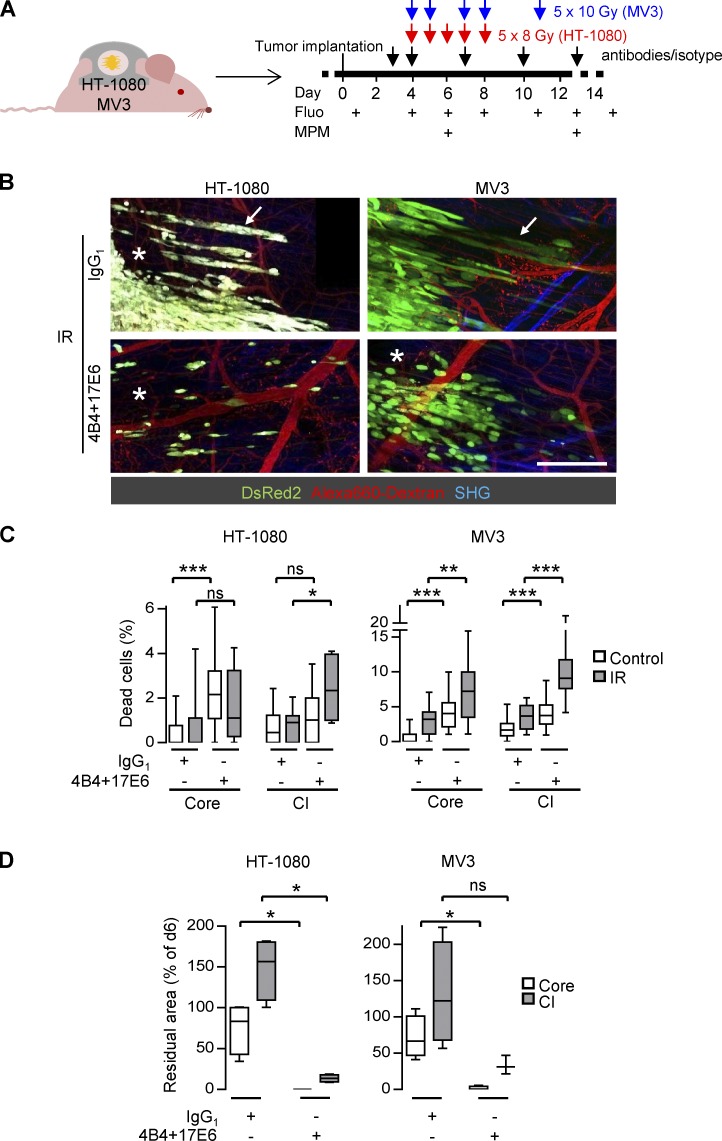
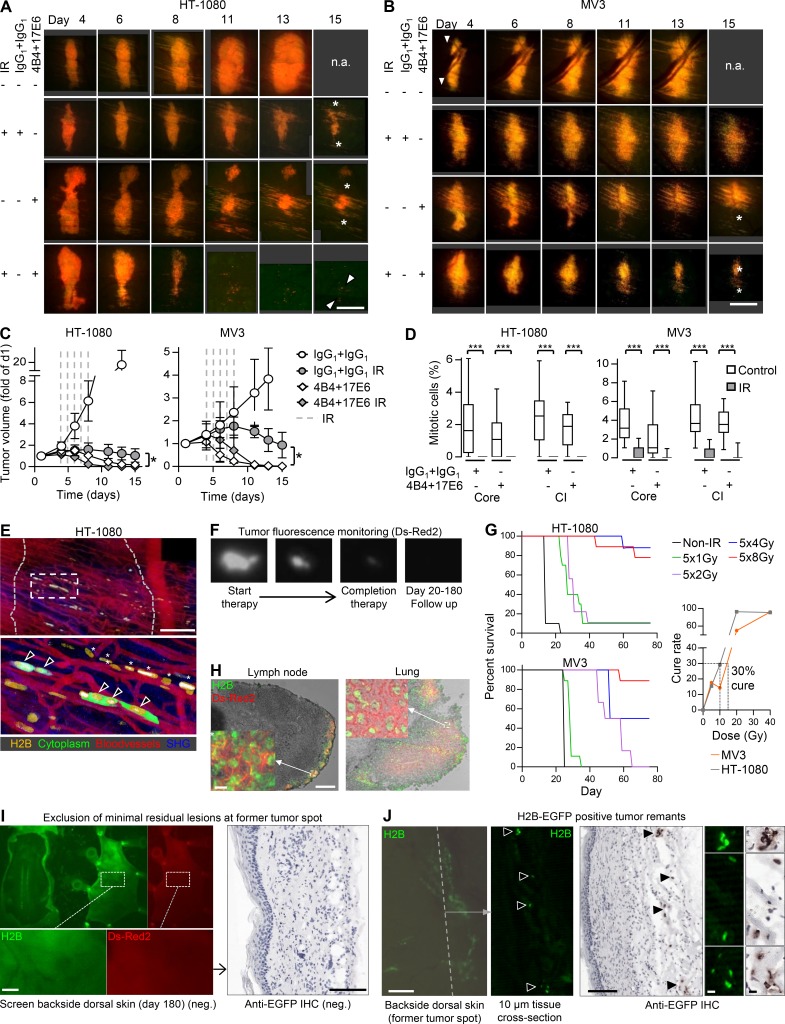
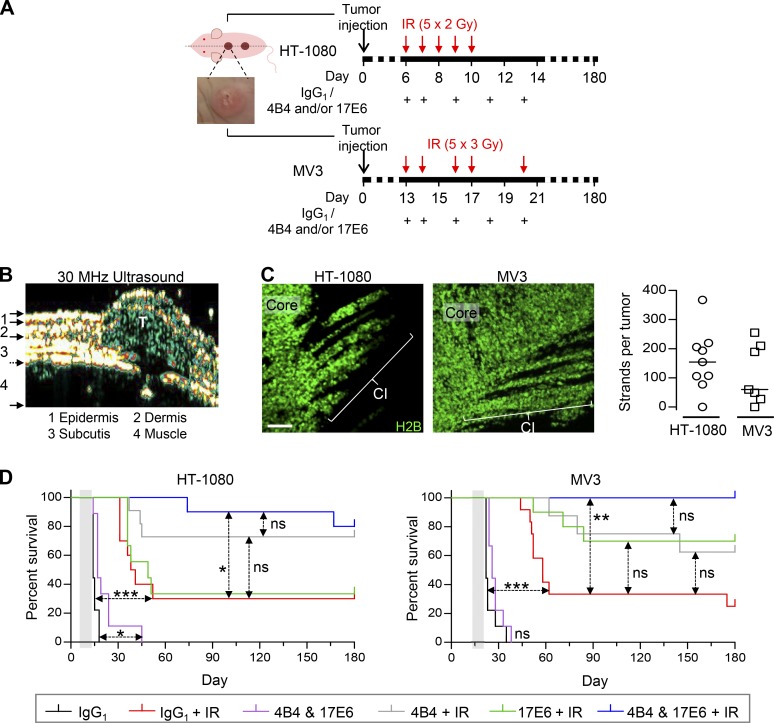
Cancer fatalities result from metastatic dissemination and therapy resistance, both processes that depend on signals from the tumor microenvironment. To identify how invasion and resistance programs cooperate, we used intravital microscopy of orthotopic sarcoma and melanoma xenografts. We demonstrate that these tumors invade collectively and that, specifically, cells within the invasion zone acquire increased resistance to radiotherapy, rapidly normalize DNA damage, and preferentially survive. Using a candidate-based approach to identify effectors of invasion-associated resistance, we targeted β1 and αVβ3/β5 integrins, essential extracellular matrix receptors in mesenchymal tumors, which mediate cancer progression and resistance. Combining radiotherapy with β1 or αV integrin monotargeting in invading tumors led to relapse and metastasis in 40-60% of the cohort, in line with recently failed clinical trials individually targeting integrins. However, when combined, anti-β1/αV integrin dual targeting achieved relapse-free radiosensitization and prevented metastatic escape. Collectively, invading cancer cells thus withstand radiotherapy and DNA damage by β1/αVβ3/β5 integrin cross-talk, but efficient radiosensitization can be achieved by multiple integrin targeting.


Figures

Figure 1.
Figure 1.
Collective invasion as primary invasion pattern in sarcoma and melanoma xenografts. (A) Schematic view defining tumor core and collective invasion zone (CI) of tumors growing in the deep dermis of the mouse monitored intravitally through an imaging window. (B) Collective invasion strands of human HT-1080 sarcoma (left; day 7; see also Video 1) and MV3 melanoma xenografts (right; day 8; see also Video 2). Tumor cells stably express nuclear H2B-EGFP and cytoplasmic DsRed2. Alexa Fluor 660–conjugated dextran contrastsperfused blood vessels. Second harmonic generation (SHG) visualizes muscle and collagen fibers. Arrowheads, alignment of invasion strands with perfused blood vessels. Scale bar, 100 µm. (C) Prevalence of invasion types, including individual cells, detached clusters, or collective strands connected to the core (day 5–7). Data represent the means and SD from five (HT-1080) and three (MV3) tumors. Per tumor, on average 150 (HT-1080) and 300 (MV3) cells were analyzed. (D) Distribution of ALCAM along cell–cell junctions (arrowheads) in invading tumor strands. Maximum-intensity projections (overview) and individual sections (insets) from confocal 3D stacks. Diffuse background fluorescence originates from fat (F) and myofibers (M). Scale bars, 100 µm (overview); 10 µm (insets).
Figure S1.
Figure S1.
Kinetics and organization of collective invasion in mouse dermis and comparison to human samples. (A and B) Time-dependent whole-tumor morphology (A) and tumor volume (B) of HT-1080 and MV3 xenografts in the skin window. Data represent the means and SD from five (HT-1080) and three (MV3) tumors. Arrowheads, onset of collective invasion. Scale bar, 1 mm. (C) Median velocity of collective invasion into the dermis. Data represent the distance migrated per day from day 4 to 6 of 48 (HT-1080) and 28 (MV3) individual collective strands from three (HT-1080) and two (MV3) tumors. Negative values originate from occasional rearward orientation or retraction of strand tips. (D) Orientation of mitotic planes in the core or collective invasion (CI) strands relative to the direction of migration. A median angle of ∼90° reflects mitotic planes aligned perpendicular to the invasion direction. Per region and tumor type, ∼30 mitotic planes were analyzed from one tumor. (E) Collective invasion pattern in human adult primary soft tissue sarcoma in subdiaphragmal location. Multicellular strands bordered by reactive α-smooth muscle actin (SMA)–positive stromal cells. Inset, mitotic planes (arrowhead) orientated perpendicularly to the invasion direction. Dashed lines, border between invasion zone and stroma. Scale bars, 100 µm. (F) Collective invasion pattern in human primary melanoma lesion during vertical growth phase with deep dermal invasion. Inset, mitotic plane (arrowhead) perpendicular to invasion direction. Dashed lines, border stroma to invasion zone. Asterisks, individual tumor cells. Scale bar, 100 µm. (G) Absence of hypoxic areas in HT-1080 xenograft after 7 d of growth in the skin window. Hypoxic regions detected by pimonidazole staining (red) include the upper epidermis (black arrowheads), sebaceous glands (white asterisks), and dermal fat tissue (white arrowheads), but not the tumor core. Green asterisks, autofluorescent myofibers. Scale bar, 1 mm.
Figure 2.
Figure 2.
Collective invasion niche mediates radioresistance. (A) Experimental procedure for sequential intravital imaging of the tumor response to fractionated IR. Fluo, epifluorescence overview microscopy. MPM, subcellular-resolved multiphoton microscopy. (B) Differential response to radiation therapy in invasion strands and tumor core. Multiphoton microscopy images show the borders between core and collective invasion zone (day 13). Black box in lower right corner (MV3) results from stitching of adjacent images without complete overlap. Asterisk, regressing tumor core. Circles and insets in lower panel, nuclear fragmentation used for quantification of dead cells. Scale bars, 50 µm. (C) Frequency of fragmented nuclei indicating dead cells in HT-1080 tumor cores and collective invasion strands. Data represent medians, 25th/75th percentiles (box), and 5th/95th percentiles (whiskers) of ∼80 nuclei per tumor region from 5–20 fields/tumor from three to four independent mice. *, P = 0.005; ***, P < 0.0001; ns, not significant. Statistics, Mann–Whitney U test (Bonferroni-corrected threshold: P = 0.008). (D) Epifluorescence overviews of whole-tumor topology in untreated and irradiated HT-1080 (5 × 8 Gy) and MV3 (5 × 10 Gy) lesions (day 13). Images are derived from Fig. S1 A (control) and Fig. S2 G (irradiated). Scale bar, 1 mm. (E) HT-1080 tumor growth before, during (dashed lines; 5 × 8 Gy), and after IR, compared with untreated tumors in independent mice (Ext Ctrl) or nonirradiated contralateral tumors in the same mouse (Int Ctrl). Means ± SD (three to nine independent tumors). *, P = 0.02 (difference between irradiated and control tumors at the endpoint [day 13]). Statistics, Mann–Whitney U test. (F) Extent of tumor regression in core and invasion zone of irradiated tumors. Data show median residual areas, 25th/75th percentiles (box), and 5th/95th percentiles (whiskers) of day 13 normalized to day 6 from four independent tumors per condition. *, P = 0.03. Statistics, paired t test. (G) Collective survival niche after IR. Multiphoton microscopy image shows the border between core and invasion zone of an irradiated HT-1080 tumor (day 14). Persisting, invading cells were quantified as individual or collective cell patterns connected by the DsRed2-positive cytosol. Dead cells were lacking cytoplasmic signal. Asterisk, regressing tumor core. Scale bars, 100 µm. (H) Classification of surviving, invading cells based on the migration pattern, including individual cells or collective strands. Data represent the means and SD from three tumors (HT-1080). ***, P < 0.0001. Statistics, paired t test.
Figure S2.
Figure S2.
Workflow and quantitative analysis of the radiation response of sarcoma and melanoma tumor subregions monitored by intravital microscopy. (A and B) Dimensions and uniform dosing of IR across the visible field of the skin window using focal-beam IR (2-cm beam diameter). (A) Topography of the IR field (1) and skin window (2). (B) Dosimetry of IR measured across the IR field (1). Due to the metal frame of the imaging window, only the window itself (2) is exposed to IR. (C) Frequency of mitotic planes in HT-1080 tumor core and collective invasion strands, by scoring the H2B-EGFP pattern (1, interphase nucleus; 2–4, mitotic nuclei [2, prometaphase; 3, metaphase; 4, anaphase]). Data show the median fraction, 25th/75th percentiles (box), and 5th/95th percentiles (whiskers) from 5–20 different microscopic fields representing three to four tumors. Per tumor region and day, 10–20 nuclei were analyzed. (D) Frequency of dead cells in HT-1080 tumor cores and collective invasion strands (pooled data days 11 and 13). Data represent the medians, 25th/75th percentiles (box), and 5th/95th percentiles (whiskers) of ∼80 nuclei per tumor region from 5–20 fields/tumor from three to four independent mice. Statistics, Mann–Whitney U test. (E) Frequency of mitotic and dead cells in tumor core or collective invasion (CI) zone of MV3 tumors (day 6). Data show the median fraction, 25th/75th percentiles (box), and 5th/95th percentiles (whiskers) of 10–20 nuclei per tumor region from 9–28 different microscopic fields representing four to five tumors. **, P = 0.004 (mitotic cells) or P = 0.002 (dead cells); ***, P < 0.0001; ns, not significant. Statistics, Mann–Whitney U test. (F) MV3 tumor growth before, during (dashed lines; 5 × 10 Gy), and after IR, compared with untreated tumors in independent mice. Means ± SD (four to seven independent tumors). *, P < 0.01 (difference between irradiated and control tumors at the endpoint [day 13]). Statistics, Mann–Whitney U test. (G) Time course of radiation response in representative lesions, compared with nonirradiated control tumors (day 13, images derived from Fig. S1 A). Arrowheads, invasion zone. Asterisks, regression zone. Scale bar, 1 mm. (H) MV3 tumoroids invading into a 3D collagen matrix were subjected to a single dose of IR (RTX, 4 Gy) and analyzed 5 d later for both fragmentation of the nucleus and cleaved caspase-3 as transient apoptosis marker. Upper panel, experimental setup and overview image showing tumoroid core (T) and invading cells with closeup of invasion zone. Lower panel, clear distinction of viable and apoptotic cells based on nuclear morphology and cleaved caspase-3 staining. Scale bar, 50 µm.
Figure 3.
Figure 3.
Differential DDR in tumor core and collective invasion niche. (A) Experimental procedure for tumor sample collection to analyze the DDR. Fluo, epifluorescence overview microscopy. (B) Strategy for differential immunohistological analysis of DDR in tumor core and collective invasion (CI) zone. Upper panel, serial sectioning of the entire tumor; lower panels, resulting cross-sectioned patterns. (C) γH2AX and pChk2 signal in tumor core and collective invasion zone detected at early (≤1 h) and late (24 h) time point after a single-dose IR. Maximum-intensity projections from confocal 3D stacks. Dashed rectangles indicate representative tumor nuclei for single-channel display of γH2AX or pChk2 signal. H2B, H2B-EGFP (tumor nuclei). Images were chosen to show the variation of the intensity and subcellular structure of positive events. Scale bars, 50 µm (overview); 25 µm (inset). Examples for nonirradiated samples are shown in Fig. S3 E. (D) Intensity distribution of DDR signals in HT-1080 tumors after a single-dose IR. Data show the mean gray value after background correction (lines) and signal range (filled areas, lowest to highest values) from three independent tumors. Dark gray shaded area, difference between core and collective invasion zone. (E) Quantification of γH2AX, pATM/ATR substrates, and pChk2 signal intensity after single-dose IR. Data represent the median gray value per nucleus after background correction, with 25th/75th (box) and 5th/95th percentiles (whiskers) from three independent tumors. ∼150–600 nuclei per invasion zone and tumor and ∼1,000–6,000 representative nuclei per core and tumor were analyzed. Dashed lines visualize approximate dynamics of DDR. **, P = 0.003; ***, P < 0.0001. Statistics, mixed-model ANOVA (see Materials and methods for details).
Figure S3.
Figure S3.
Tumor subregion analysis of the DDR by serial sectioning and image analysis. (A) Principle of serial vertical tumor sectioning and morphology mapping to annotate serial samples from tumor core (region 2) and invasion zone (regions 1 and 3). Arrow, direction of sectioning. (B) Specific and isotype-controlled background staining for DDR markers (irradiated samples). Dashed rectangles, region of detail images. Scale bar, 10 µm. (C) Workflow for image segmentation and single-cell analysis. ROI, region of interest. (D) Histogram analysis of nuclear size distribution to determine the cutoff for exclusion of nuclear fragments (i.e., apoptotic nuclei). Indicated variables and formula were used for Gaussian distribution fitting to define the intersection and separate fragmented from intact nuclei. Area binning of ∼18,000 nuclear ROIs from three independent HT-1080 tumors including cores and invasion zones. Similar distributions and curves were obtained for MV3 tumors resulting in the same cutoff (data not shown). (E) Representative γH2AX, pChk2, and pATM/ATR substrate signal in subregions of HT-1080 tumors before, shortly after, or 1 d after single-dose IR. Representative maximum-intensity projections from confocal 3D stacks. Red selections, ROIs of tumor nuclei. CI, collective invasion. Scale bar, 50 µm. (F) Quantification of γH2AX and pChk2 signal intensity in MV3 tumors before and after single-dose IR. Data originate from ∼150–600 nuclei per invasion zone and tumor and ∼1,000–6,000 nuclei per core and tumor from two independent tumors, represented as medians, 25th/75th percentiles (box), and 5th/95th percentiles (whiskers). Dashed lines visualize approximate dynamics of DDR. *, P = 0.01; **, P = 0.003; ns, not significant. Statistics, mixed-model ANOVA (see Materials and methods for details). (G) Identification of biologically relevant effects from large datasets. Example plots derived from the Imer function after performing a mixed-model ANOVA showing the distribution of mean of log values for different tumor subregions and tumors. Only datasets revealing similar directions and slopes were included for statistical analysis (right plot), whereas samples with disparate or noise-like behaviors (left plot) were considered not significant.
Figure 4.
Figure 4.
Compromised tumor integrity and persistence of the invasion niche by RNAi- and antibody-based targeting of β1/β3 integrins in HT-1080 tumors. (A) Experimental procedure for administration of anti-β1 integrin mAb 4B4 or IgG1 and sequential intravital microscopy of the tumor response to integrin interference. Fluo, epifluorescence overview microscopy. MPM, subcellular-resolved multiphoton microscopy. (B) Time course of tumor growth or regression in control tumors transduced with empty vectors (p-puro/p-neo), β1RNAi or β1/β3RNAi in the absence or presence of IgG1 or anti-β1 integrin mAb 4B4. White arrowheads, onset of collective invasion. Numbers (right column), percentage mean regression of the tumor core (day 13 compared with day 6) from three to four independent tumors. Scale bars, 1 mm. (C) Fractions of mitotic and dead cells (day 6) quantified based on nuclear morphology for different interference schemes displayed as medians, 25th/75th percentiles (box), and 5th/95th percentiles (whiskers) from 20 independent fields from three to four independent tumors. Per condition, 19–20 nuclei were analyzed for the core and ∼10 nuclei for the invasion zone. *, P = 0.01; ***, P < 0.0001; ns, not significant. Statistics, Mann–Whitney U test (Bonferroni-corrected threshold: P = 0.0125). (D) Tumor development in response to the indicated interference procedures. Data show the means ± SD from three to four independent tumors. *, P = 0.0286. Statistics, Mann–Whitney U test. (E) Preferential survival of invading collective strands after combined β1/β3 integrin targeting. Z-projections of the same tumor region. Black box in upper left corner (day 6) results from stitching of adjacent images without complete overlap. Insets, mitotic figures in collective strands. Arrowheads, detachment of cell groups and individualized cells. Scale bar, 250 µm. (F) Median residual volume of tumor core and collective invasion (CI) zones after β1/β3RNAi combined with mAb 4B4 (day 13 compared with day 6) from three independent tumors. *, P < 0.05. Statistics, paired t test.
Figure S4.
Figure S4.
Integrin expression profiles in HT-1080 and MV3 cells and RNAi-based integrin targeting in HT-1080 cells. (A and B) Surface expression pattern of integrin β and α chains on HT-1080 (A) and β chains on MV3 (B) cells determined by flow cytometry. Black line, isotype control. Values, mean fluorescence (minus isotype values). (C–E) Downregulation of β1 and β3 integrins in HT-1080 cells by shRNA. (C) Knockdown efficiency of β1 integrin in dual-color HT-1080 cells (Western blot), compared with nontransduced (NT) and empty vector (EV)–transduced cells. β-Tubulin, loading control. (D and E) Upregulation of β3 integrins after downregulation of β1 integrin (D) and efficient downregulation of both β1 and β3 integrins after β1/β3RNAi (E) determined by flow cytometry. Surface expression pattern of β1 and β3 integrins on β1RNAi cells or β1/β3RNAi cells (red lines) compared with cells transfected with empty vector (EV, blue lines). Black line, isotype control. Values, mean fluorescence (minus isotype values). Stability of β1/β3 downregulation was routinely verified, and no outlier behavior or drift of expression to other integrin β-chains was noted (data not shown). (F) Reduction of β1 integrin adhesion epitope detected by FITC-conjugated mAb 4B4 on vector control (EV; left) and β1RNAi cells (right) after epitope saturation with unconjugated mAb 4B4 (3 µg/ml; blue line showing residual epitopes) compared with unspecific IgG1 (red line; total epitopes). Black line, isotype control staining (Iso). Values indicate mean fluorescence intensities. (G) Diminished phosphoErk signal (MAPK signaling) after β1/β3 integrin targeting (day 7). Histograms show the mean pixel fluorescence (MF) intensity of pErk from control (HT-1080 wild type) and β1/β3 integrin targeted tumors (T, dotted lines, identified by H2B-EGFP label) compared with pErk signal in the surrounding stroma (S), which further contained hair follicles (HF) with strong endogenous pErk expression. Ratio of tumor- and stroma-derived pErk intensity is displayed as medians, 25th/75th percentiles (box), and 5th/95th percentiles (whiskers) from one sample determined from 10 independent regions of the corresponding stroma region after exclusion of hair follicles, with a ratio of 1.0 (red dashed line) when signal intensity of both regions was equal. Calibration bar, pixel intensity. Scale bars, 100 µm (overview); 10 µm (inset).
Figure 5.
Figure 5.
Radiosensitization of HT-1080 tumors by β1/β3 integrin RNA interference combined with antibody-based β1 integrin targeting. (A) Protocol for administration of anti-β1 (4B4) or IgG1 combined with fractionated IR and sequential intravital imaging of the tumor response. Fluo, epifluorescence overview microscopy. MPM, subcellular-resolved multiphoton microscopy. (B) Topology and extent of the invasion zone in response to fractionated IR combined with single-integrin (β1) or dual β1/β3 integrin interference. Epifluorescence (left) and 3D reconstructed z-projections from regions marked by dashed boxes using multiphoton microscopy (right; day 13). White asterisks, apoptotic nuclei. Scale bars, 1 mm (left); 250 µm (right). (C) Time-dependent tumor volume. Data show the means ± SD from three to four independent tumors, with P values for comparing irradiated integrin-targeted tumors to irradiated control tumors. (*), P = 0.006; *, P = 0.004. Statistics, Mann–Whitney U test (Bonferroni-corrected threshold: P = 0.005). (D) Regression of tumor core and collective invasion (CI) zone after IR with or without integrin mono- or dual interference. Data show median residual areas, 25th/75th percentiles (box), and 5th/95th percentiles (whiskers) of day 13 normalized to day 6. Per condition, four tumors were analyzed. (*), P = 0.03; ns, not significant. Statistics, Mann–Whitney U test (Bonferroni-corrected threshold: P = 0.0125).
Figure 6.
Figure 6.
Dual-integrin targeting abrogates radioresistance in the collective invasion niche. (A) Protocol for administration of anti-β1 (4B4) and αV integrin (17E6) mAbs or IgG1 combined with fractionated IR and sequential intravital imaging of the tumor response. Fluo, epifluorescence overview microscopy. MPM, subcellular-resolved multiphoton microscopy. (B) Radiation response of tumor core and collective invasion zone after combined treatment with mAbs 4B4 and 17E6 compared with IgG1-treated control (day 13). Black box in upper right corner (HT-1080, IgG1) results from stitching of adjacent images without complete overlap. Asterisks, areas of regression. Arrows, persisting invasion strands. Alexa Fluor 660–conjugated dextran-perfused blood vessels. Second harmonic generation (SHG) originates from muscle and collagen fibers. Scale bar, 250 µm. (C) Frequency of dead cells in core and collective invasion (CI) zone after antibody-based integrin targeting and/or IR (day 6). Data show the medians, 25th/75th percentiles (box), and 5th/95th percentiles (whiskers) of ∼20 nuclei per condition and tumor regions from four to five tumors, reflecting a total of 9–28 different microscopic fields. *, P = 0.01; **, P = 0.001; ***, P < 0.0001; ns, not significant. Statistics, Mann–Whitney U test (Bonferroni-corrected threshold: P = 0.0125). (D) Extent of tumor regression in core and collective invasion zone of irradiated tumors combined with or without integrin targeting. Data show median residual areas, 25th/75th percentiles (box), and 5th/95th percentiles (whiskers) of day 13 normalized to day 6 from four independent tumors. *, P = 0.03. Statistics, Mann–Whitney U test.
Figure S5.
Figure S5.
Radiosensitization of sarcoma and melanoma tumors by antibody-based integrin interference and procedures and outcome of long-term therapy response. (A–D) Tumor morphology and quantification of radiosensitization assessed by intravital microscopy. (A and B) Time-dependent growth or regression of HT-1080 or MV3 lesions in response to the indicated treatment conditions. n.a., not analyzed due to humane endpoint after day 13 (tumor >2 cm3). Images of untreated HT-1080 and MV3 tumors are also shown in Fig. S1 A. Asterisks, regression tumor core. Arrowheads, tumor remnants. Scale bars, 1 mm. (C) Time-dependent tumor volume during and after treatment with IgG1 or mAb 4B4 + 17E6 with or without IR. Data show the means ± SD from three to four (HT-1080) or three to five (MV3) independent lesions. *, P = 0.0286 (comparison IgG1/IR control with 4B4/17E6 and IR [day 15]). Statistics, Mann–Whitney U test. (D) Mitotic frequencies in nonirradiated and irradiated tumor core and collective invasion (CI) zone. Data show the medians, 25th/75th percentiles (box), and 5th/95th percentiles (whiskers) of 10–20 nuclei per tumor region and condition from 7 to 23 independent fields from four (HT-1080) or three to five (MV3) independent tumors. ***, P < 0.0001. Statistics, Mann–Whitney U test. (E) Long-term follow-up (day 26) after treatment with 4B4 and 17E6 and IR, revealing minimal residual disease. Dotted gray line, position of former tumor. Box, position of lower panel. Zoom shows surviving cells without mitotic activity (arrowheads) and cytoplasm-free, condensed nuclei of disintegrated cells (asterisks). Scale bars, 250 µm. (F) Example tumor undergoing complete regression after therapy monitored longitudinally by whole-body fluorescence imaging. (G) IR dose escalation study for intradermal HT-1080 and MV3 tumors (window-free dermis). Left panels, overall survival after IR using the indicated doses (6–10 mice per group). Right panel, cure rate measured as percentage of tumors that did not relapse after IR. Black dashed line, IR dose with 30% cure rate (5 × 2 Gy for HT-1080 tumors, 5 × 3 Gy for MV3 tumors). (H) Dual-color detection of lung and lymph node metastases. Microscopic whole-organ screen (not depicted) was followed by analysis of cryosections (depicted). Scale bars, 100 µm (overview); 10 µm (inset). (I) Identification of minimal residual disease at the endpoint. The dorsal skin was screened from the deep fascia for presence or absence of fluorescent tumor remnants (left panel). In case of doubt, subregions were additionally sectioned for analysis by anti-EGFP immunohistochemistry (IHC; right panel). Images show typical tumor-negative outcome. Scale bar, 100 µm. (J) Examples of minimal residual lesions present at the tumor implantation site at the endpoint (day 180). Tumor remnants with strand-like pattern of green-fluorescent tumor nuclei (H2B-EGFP) followed by tissue sectioning and validation by anti-EGFP IHC. Dashed line, approximate position of tissue cross section. Arrowheads, intact H2B-EGFP–positive tumor nuclei. Right panel, validation of EGFP-positive tumor remnants and positive anti-EGFP IHC side by side. Scale bars, 100 µm (overview); 10 µm (details).
Figure 7.
Figure 7.
Dual-targeted but not individual anti-integrin therapy to enhance radiation response, tumor eradication, and long-term survival. (A) Treatment schemes for HT-1080 and MV3 tumors. Tumor cells were injected at day 0, resulting in an intradermally growing tumor located along the dorsal midline (dashed line). Example image, intradermal HT-1080 lesion. Time points of IR and antibody administration are indicated. (B) Tumor lesion (T) after implantation in imaging window–free mouse. Intradermal localization was confirmed by high-frequency ultrasound. (C) Collective invasion (CI) pattern in intradermal tumors in imaging window–free dermis (maximum-intensity projections). Number of multicellular strands per tumor was counted from 50-µm-thick tumor sections from nine (HT-1080) and seven (MV3) tumors. Scale bar, 100 µm. (D) Tumor-free overall survival of mice after application of treatment, including fractionated IR without and with individual and dual-targeted integrin inhibition with antibodies 4B4 and/or 17E6, compared with IR combined with isotypic control antibody (representing IR alone without integrin targeting). Mice were sacrificed after 180 d or earlier, upon humane endpoint criteria (tumor size of 2 cm3, ulceration, weight loss, or poor overall condition due to internal metastasis). See Table S1 for details on mouse numbers (8–12 mice per group), metastasis formation, and tumor remnants. Gray-shaded area, therapy phase. *, P = 0.01; **, P = 0.0003; ***, P < 0.0001; ns, not significant. Statistics, log-rank survival analysis (Bonferroni-corrected thresholds: P = 0.01 [HT-1080] and P = 0.008 [MV3]).

References

    1. Aceto N., Bardia A., Miyamoto D.T., Donaldson M.C., Wittner B.S., Spencer J.A., Yu M., Pely A., Engstrom A., Zhu H., et al. . 2014. Circulating tumor cell clusters are oligoclonal precursors of breast cancer metastasis. Cell. 158:1110–1122. 10.1016/j.cell.2014.07.013 - DOI - PMC - PubMed
    1. Ahmed K.M., Pandita R.K., Singh D.K., Hunt C.R., and Pandita T.K.. 2018. β1-integrin impacts Rad51 stability and DNA double-strand break repair by homologous recombination. Mol. Cell. Biol. 38:e00672–e17. 10.1128/MCB.00672-17 - DOI - PMC - PubMed
    1. Ahmed K.M., Zhang H., and Park C.C.. 2013. NF-κB regulates radioresistance mediated by β1-integrin in three-dimensional culture of breast cancer cells. Cancer Res. 73:3737–3748. 10.1158/0008-5472.CAN-12-3537 - DOI - PMC - PubMed
    1. Alexander S., and Friedl P.. 2012. Cancer invasion and resistance: interconnected processes of disease progression and therapy failure. Trends Mol. Med. 18:13–26. 10.1016/j.molmed.2011.11.003 - DOI - PubMed
    1. Alexander S., Koehl G.E., Hirschberg M., Geissler E.K., and Friedl P.. 2008. Dynamic imaging of cancer growth and invasion: a modified skin-fold chamber model. Histochem. Cell Biol. 130:1147–1154. 10.1007/s00418-008-0529-1 - DOI - PubMed

Publication types