. 2019 Dec 6;294(49):18934-18948.
doi: 10.1074/jbc.RA119.010047. Epub 2019 Oct 28.

On the mechanism of GIRK2 channel gating by phosphatidylinositol bisphosphate, sodium, and the Gβγ dimer

Affiliations

On the mechanism of GIRK2 channel gating by phosphatidylinositol bisphosphate, sodium, and the Gβγ dimer

Dailin Li et al. J Biol Chem. .

Abstract

G protein-gated inwardly rectifying K+ (GIRK) channels belong to the inward-rectifier K+ (Kir) family, are abundantly expressed in the heart and the brain, and require that phosphatidylinositol bisphosphate is present so that intracellular channel-gating regulators such as Gβγ and Na+ ions can maintain the channel-open state. However, despite high-resolution structures (GIRK2) and a large number of functional studies, we do not have a coherent picture of how Gβγ and Na+ ions control gating of GIRK2 channels. Here, we utilized computational modeling and all-atom microsecond-scale molecular dynamics simulations to determine which gates are controlled by Na+ and Gβγ and how each regulator uses the channel domain movements to control gate transitions. We found that Na+ ions control the cytosolic gate of the channel through an anti-clockwise rotation, whereas Gβγ stabilizes the transmembrane gate in the open state through a rocking movement of the cytosolic domain. Both effects alter the way in which the channel interacts with phosphatidylinositol bisphosphate and thereby stabilizes the open states of the respective gates. These studies of GIRK channel dynamics present for the first time a comprehensive structural model that is consistent with the great body of literature on GIRK channel function.

Keywords: G protein; GIRK2 channel; Gβγ dimer; PIP2; allosteric regulation; channel activation; gating; intracellular Na+; membrane protein; molecular dynamics; molecular dynamics simulations; molecular modeling; phosphoinositide; potassium channel; transmembrane domain.


Conflict of interest statement

The authors declare that they have no conflicts of interest with the contents of this article

Figures

Figure 1.
Figure 1.
Overall GIRK2 channel burst characteristics (each vertical line per ns) over simulation time. MD simulations were run on five systems: GIRK2–Apo, GIRK2–PIP2 (GIRK2), GIRK2–Na+, GIRK2–Gβγ, and GIRK2–Gβγ–Na+. Channels with their HBC and G-loop gates larger than a minimum distance (5.69 Å) that is required for permeation were considered to be open. This minimum distance estimate was derived from the least conductive system GIRK2–Na+ compared with the other two systems studied that have been shown experimentally to display measurable currents (i.e. GIRK2–Gβγ and GIRK2–Gβγ–Na+).
Figure 2.
Figure 2.
Unitary activity of GIRK4* mutants (using as control the highly active GIRK4-S143T). GIRK4* mutants mimic gating by Na+ (I229L), Gβγ (S176P), and Gβγ/Na+ (S176P and I229L) in compressed (A) and more expanded (B) time scales. Open probability of S176P (0.072 ± 0.019; n = 6), I229L (0.059 ± 0.014; n = 5), and S176P/I229L (0.322 ± 0.093; n = 7) are shown. These data obtained from mutants representing the endogenous gating molecules (PIP2, Na+, Gβγ, and Na+/Gβγ) are consistent with prior reports (53).
Figure 3.
Figure 3.
Minimal distances for HBC and G-loop gate opening. Histograms of distributions of minimum distances of the HBC gate (left column) and the G-loop gate (right column) based on the simulation (per ns) of the MD trajectory. The same five systems as in Fig. 1 were analyzed, namely GIRK2–Apo, GIRK2–PIP2 (GIRK2), GIRK2–Na+, GIRK2–Gβγ, and GIRK2–Gβγ–Na+. The red dashed line indicates the cutoff distance under which no K+ permeation took place.
Figure 4.
Figure 4.
GIRK2 channel burst characteristics for individual gates (each vertical line per ns) over simulation time. MD simulations were run on five systems: GIRK2–Apo, GIRK2–PIP2 (GIRK2), GIRK2–Na+, GIRK2–Gβγ, and GIRK2–Gβγ–Na+. Channels with their HBC (A) and G-loop (B) gates larger than a minimum distance (5.69 Å) that is required for permeation were considered to be open. The minimum distance estimate was derived as in Fig. 1 from the least conductive system GIRK2–Na+ compared with the other two systems studied that have been shown experimentally to display measurable currents (i.e. GIRK2–Gβγ and GIRK2–Gβγ–Na+).
Figure 5.
Figure 5.
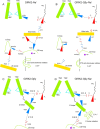
GIRK2 activation mechanism schemes: the closed and open structures are colored yellow and green, respectively, with both HBC and G-loop gates labeled. CTD rocking, TM2 helix tilting, and the local twists of the βL–βM and βD2–βE1 loops are indicated by the black/red arrows. A, view of two opposing subunits with the front and back subunits removed for clarity. B, 90° counter-clockwise rotation showing the two loops (βL–βM and βD2–βE1) that form the cleft where one Gβγ subunit binds each channel subunit individually.
Figure 6.
Figure 6.
Parameters describing HBC and G-loop gate opening. A, 3D plots of TM2 helix (Val-188–Ser-196) tilt angles, TM2–CTD dihedral angles (Cα atoms of Ser-196, Ile-244, Ile-281, and Gln-287), and average HBC Cα distances. B, 3D plots of TM2–CTD dihedral angles, relative rotation angles of TM2 and CTD, and average G-loop gate minimal distances. The arrow indicates the direction of increasing rotation angles and decreasing TM2–CTD dihedral angles that result in increasing G-loop minimal gate distances, best exemplified by the GIRK2–Na+ system.
Figure 7.
Figure 7.
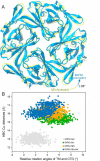
Movements during the opening of the HBC gate. A, the calculated anti-clockwise rotation angle of CTD of the X-ray crystal structures 3SYA (closed) and 4KFM (pre-open). The estimated 3.68° is consistent with the previously proposed angle of 4° (5). B, the average HBC Cα distances versus the relative anti-clockwise rotation angles of TMD and CTD domains by snapshot (per ns) of MD simulations shown for four systems: GIRK2–Apo and PIP2 containing GIRK2–Na+, GIRK2–Gβγ, and GIRK2–Gβγ–Na+. The system containing all gating molecules best exemplifies the most open HBC gate.
Figure 8.
Figure 8.
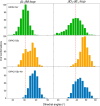
Changes in local conformations of the Gβγ-binding loops. The dihedral angles (°) of βL–βM (left column) and βD2–βE1 (right column) loop from trajectories with the largest distributions in GIRK2–Na+ labeled by dashed lines for comparison: the dihedral angle was defined by the Cα atoms of Tyr-349, Asp-346, Glu-345, and Glu-350 for βL–βM loop and Gln-248, Ser-250, Glu-251, and Gly-252 for the βD2–βE1 loop.
Figure 9.
Figure 9.
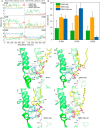
Changes in specific residue–PIP2 interactions leading to HBC gating. A, distances between the N atom of the proposed key Lys residues (C) and the P4 (left column) or P5 (right column) atoms of PIP2 taking the crystal structure (PDB code 4KFM) as a reference in red. B, PIP2-Lys pairwise Gibbs free energy change with a standard deviation bar. C–F, binding patterns between the key Lys that are involved in regulating HBC by the PIP2 identified in the crystal structure (PDB code 4KFM), GIRK2–Na+, GIRK2–Gβγ, and GIRK2–Gβγ–Na+. The major contributors to binding are highlighted in cyan.
Figure 10.
Figure 10.
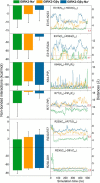
Changes in specific residue–PIP2 interactions leading to G-loop gating. Shown are the average nonbonded interactions with an error bar and the distances between the major residues involved in G loop gating over simulation time. The crystal structure (PDB code 4KFM) is taken as a distance reference in red. SC, side chain; MC, main chain.
Figure 11.
Figure 11.
Stabilization of the G-loop gate in the open state. Network of the nonbonded interactions among G loop, CD loop, slide helix, LM loop, N terminus, and βI strand for GIRK2–Na+ (A) and GIRK2–Gβγ–Na+ (B). Two adjacent subunits (yellow and green) are shown with the front PIP2 removed for clarity.
Figure 12.
Figure 12.
Cartoon of the PIP2-mediated gating mechanism of the G-loop gate. A, GIRK2–Na+. B, GIRK2–Gβγ–Na+ and the synergism effect caused by the C-linker rotation. C, GIRK2–Gβγ. D, GIRK2–Gβγ–Na+. The facing subunits are colored in green (A–D) with an adjacent in orange (A and B). One PIP2 only is shown in each panel for clarity. The sodium ion is shown as a purple ball. The positive and negative groups are designated blue and red, respectively, in Fischer projection style. Once the Arg-230–Arg-77–Asp-81 triad interaction pattern (A) other than the Arg-230–Asp-81 (B) is induced, the opening movement of G-loop gate is facilitated by a larger anti-clockwise rotation with the aid of Glu-315–His-233 and Glu-315–Arg-324 hydrogen bond interactions. The Lys-200–PIP2 interaction (C) is disrupted by a 7.74° rotation of the C-linker, which is induced by the shorter Asp-228–Arg-201 distance (D).

References

    1. Hibino H., Inanobe A., Furutani K., Murakami S., Findlay I., and Kurachi Y. (2010) Inwardly rectifying potassium channels: their structure, function, and physiological roles. Physiol. Rev. 90, 291–366 10.1152/physrev.00021.2009 - DOI - PubMed
    1. Logothetis D. E., Petrou V. I., Zhang M., Mahajan R., Meng X. Y., Adney S. K., Cui M., and Baki L. (2015) Phosphoinositide control of membrane protein function: a frontier led by studies on ion channels. Annu. Rev. Physiol. 77, 81–104 10.1146/annurev-physiol-021113-170358 - DOI - PMC - PubMed
    1. Logothetis D. E., Kurachi Y., Galper J., Neer E. J., and Clapham D. E. (1987) The βγ subunits of GTP-binding proteins activate the muscarinic K+ channel in heart. Nature 325, 321–326 10.1038/325321a0 - DOI - PubMed
    1. Mahajan R., Ha J., Zhang M., Kawano T., Kozasa T., and Logothetis D. E. (2013) A computational model predicts that Gβγ acts at a cleft between channel subunits to activate GIRK1 channels. Sci. Signal. 6, ra69 10.1126/scisignal.2004075 - DOI - PMC - PubMed
    1. Whorton M. R., and MacKinnon R. (2013) X-ray structure of the mammalian GIRK2–βγ G-protein complex. Nature 498, 190–197 10.1038/nature12241 - DOI - PMC - PubMed

Publication types

MeSH terms

Substances

LinkOut - more resources