. 2019 Oct 28;10(1):4907.
doi: 10.1038/s41467-019-12812-3.

A reference map of murine cardiac transcription factor chromatin occupancy identifies dynamic and conserved enhancers

Affiliations

A reference map of murine cardiac transcription factor chromatin occupancy identifies dynamic and conserved enhancers

Brynn N Akerberg et al. Nat Commun. .

Abstract

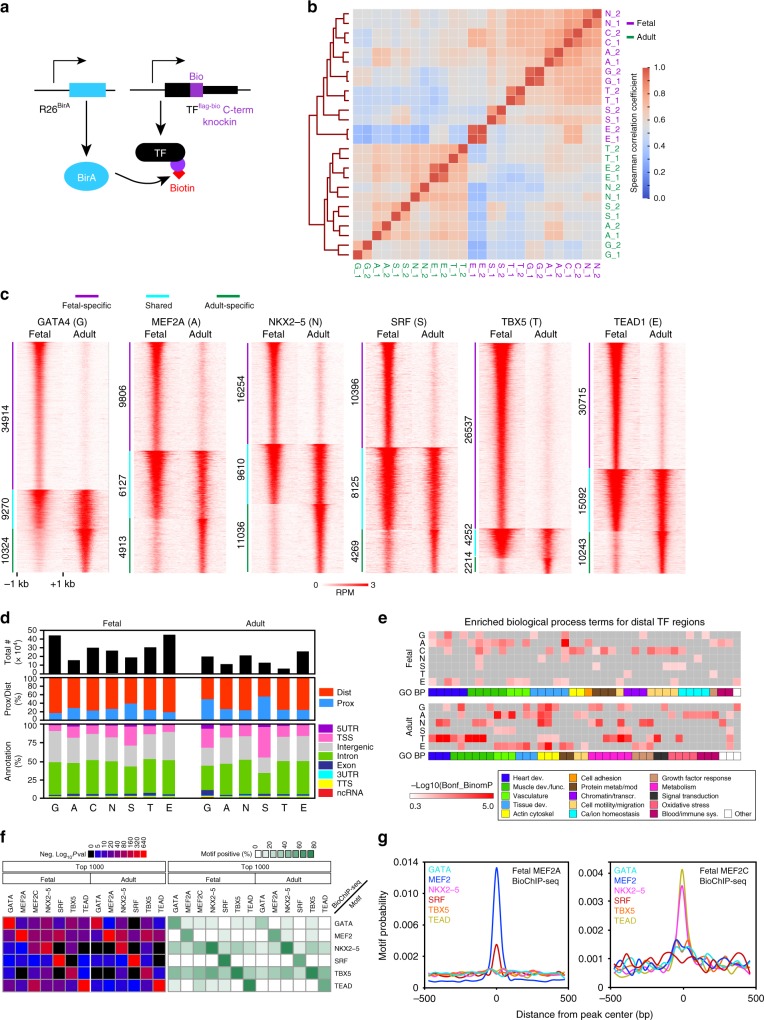
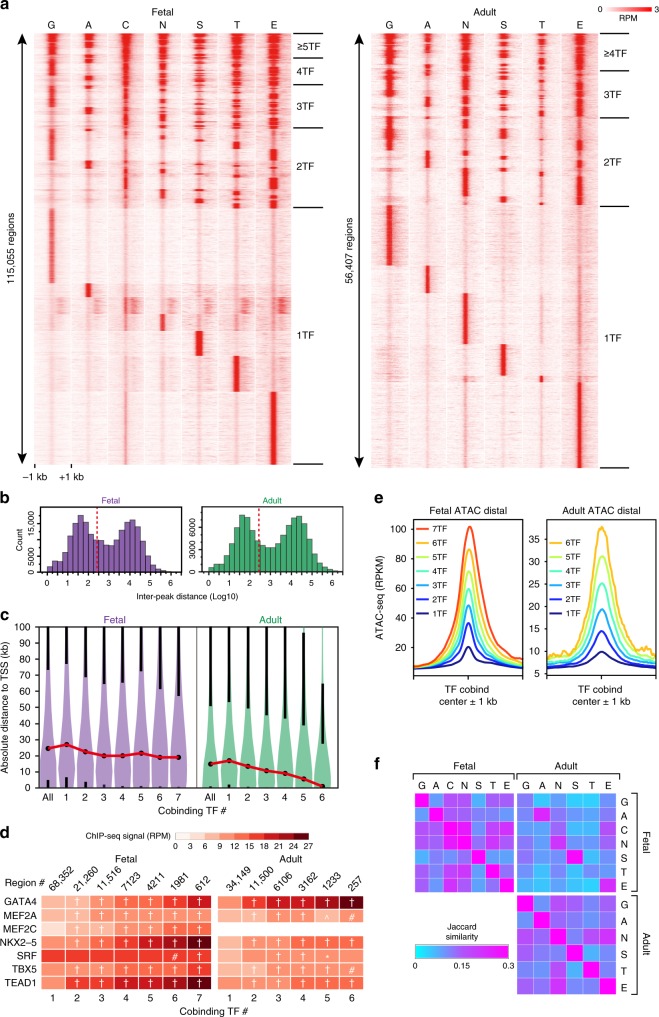
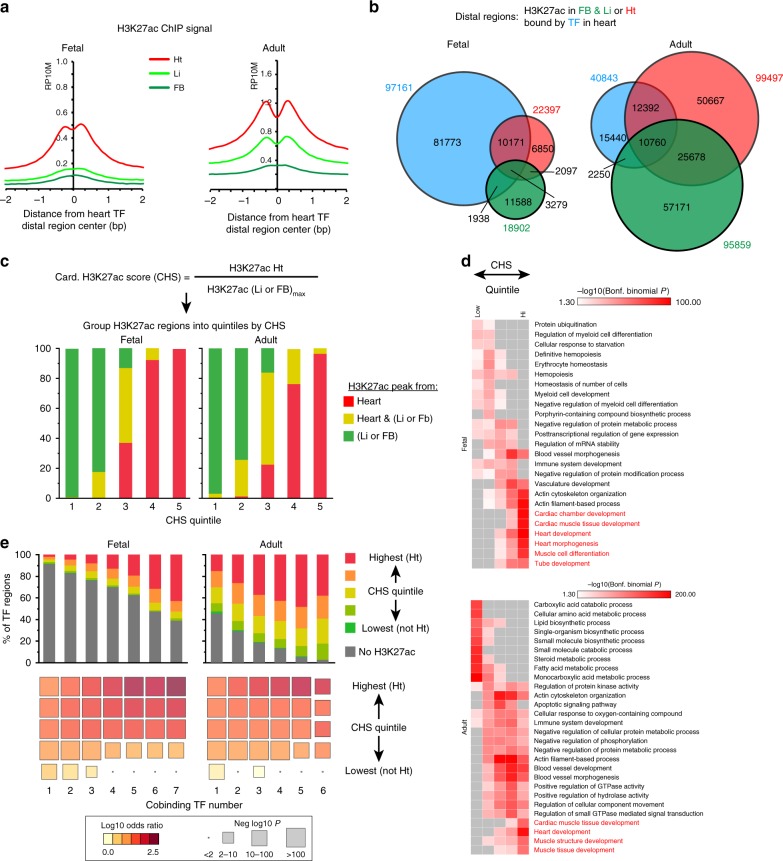
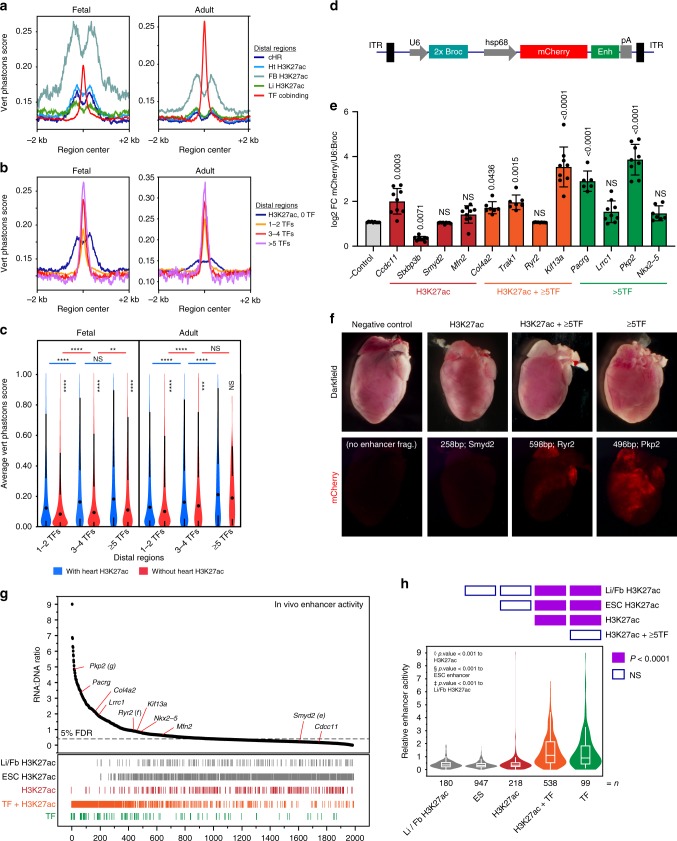
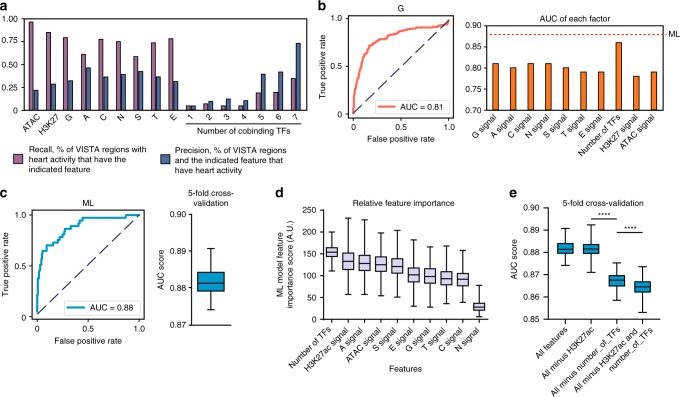
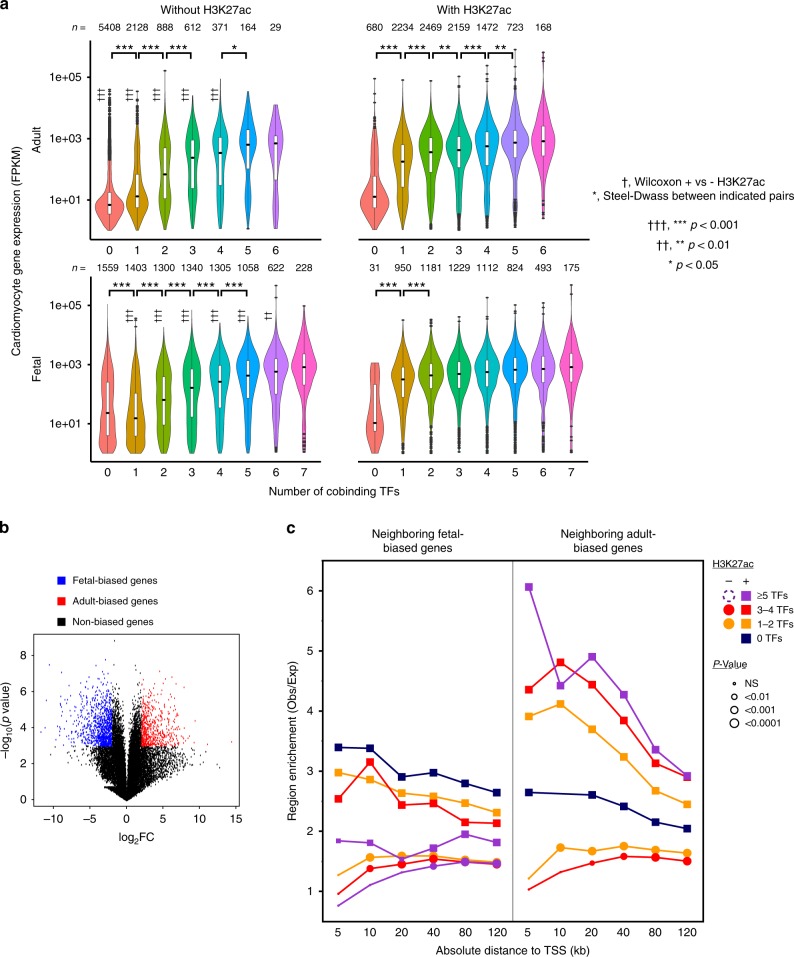
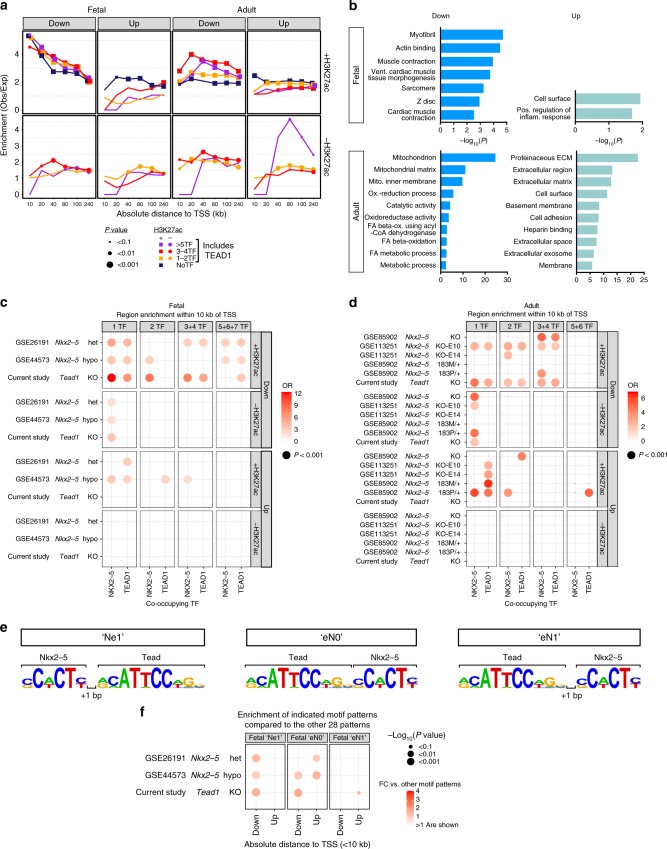
Mapping the chromatin occupancy of transcription factors (TFs) is a key step in deciphering developmental transcriptional programs. Here we use biotinylated knockin alleles of seven key cardiac TFs (GATA4, NKX2-5, MEF2A, MEF2C, SRF, TBX5, TEAD1) to sensitively and reproducibly map their genome-wide occupancy in the fetal and adult mouse heart. These maps show that TF occupancy is dynamic between developmental stages and that multiple TFs often collaboratively occupy the same chromatin region through indirect cooperativity. Multi-TF regions exhibit features of functional regulatory elements, including evolutionary conservation, chromatin accessibility, and activity in transcriptional enhancer assays. H3K27ac, a feature of many enhancers, incompletely overlaps multi-TF regions, and multi-TF regions lacking H3K27ac retain conservation and enhancer activity. TEAD1 is a core component of the cardiac transcriptional network, co-occupying cardiac regulatory regions and controlling cardiomyocyte-specific gene functions. Our study provides a resource for deciphering the cardiac transcriptional regulatory network and gaining insights into the molecular mechanisms governing heart development.


Conflict of interest statement

The authors declare no competing interests.

Figures

Fig. 1
Fig. 1
bioChIP-seq of major cardiac transcription factors in fetal and adult heart. a Strategy for bioChIP-seq. Murine knock-in alleles fuse a biotin acceptor peptide (BIO) to the C-terminus of target transcription factors (TFs). BirA expressed from the Rosa26 locus modifies BIO with biotin, permitting high affinity pull-down under consistent conditions. b Correlation between aligned bioChIP-seq data obtained from heart ventricles. Fetal (F_; purple) and adult (A_; green) data were acquired in biological duplicates (_1 and _2). Heatmap shows Spearman correlation coefficients for signal within the union of peak regions across all replicates. G, GATA4; A, MEF2A; C, MEF2C; N, NKX2-5; S, SRF; T, TBX5; E, TEAD1. c Dynamic changes in TF binding between fetal and adult stages. Heatmaps of TF-bound regions, arranged into fetal-specific (purple), adult-specific (green), and shared groups (cyan). d Number and location of TF regions with respect to gene annotations. Middle row, regions proximal (within 2 kb) or distal (>2 kb) to the TSS. Bottom row, more detailed genome annotations, using definitions from Homer. “TSS” is defined as 1 kb upstream to 0.1 kb downstream of the TSS. ncRNA, non-coding RNA. See also Supplementary Data 1. e Enriched biological process gene ontology (GO) terms for genes neighboring distal TF-occupied regions, as defined by the default settings of GREAT. The union of the five most significant terms for the top 1000 distal regions (ranked by BioChIP-seq signal) bound by each TF in fetal or adult stages. Color code indicates manual annotation of sets containing similar GO terms. Gray, non-significant P-value. See Supplementary Data 2 for the full table. f Motifs enriched among the top 1000 distal TF regions (summit ±100 bp). Regions were scanned for TF-binding motifs of the bioChIP’d TFs using Homer. Enrichment P-values (left) and percent positive regions (right) are shown. g Central enrichment plots for the top 1000 distal fetal MEF2A and MEF2C bioChIP-seq regions. MEF2A showed central enrichment for the MEF2 motif and weaker central enrichment for SRF. MEF2C showed central enrichment of TEAD, TBX5, and NKX2-5 that was greater than the MEF2 motif itself. Displayed motifs have E-value < 10-5. Source data for panels dg are provided as a Source Data file
Fig. 2
Fig. 2
TF co-occupancy patterns in fetal and adult heart. a Heatmap of TF co-occupied regions, defined by merging individual TF peaks whose summits were within 300 bp of one another. The same region is shown in each row, with each column representing the signal of the indicated factor across the region. Regions are sorted by the pattern of co-occupying TFs. b Histogram of the distance between neighboring TF summits. TF regions within 2 kb of the TSS were excluded. Note the bimodal distribution. Dotted red line indicates 300 bp, the threshold used to define TF co-occupancy. c Violin plots showing distance of regions co-occupied by multiple TFs relative to gene TSSs. Black dots indicate median values, black whiskers start at the 1st and 3rd quartiles and extend 1.5 times the interquartile distance. The red lines connecting median values highlight the trend in the data. In adult heart, the number of co-occupying TFs was inversely related to distance between TF regions and TSS. d Relationship of number of cobinding TFs and mean TF bioChIP-seq signal. The bioChIP-seq signal, expressed as reads per million (RPM), within 200 bp regions centered on the MACS2-predicted summit of each TF within a TF-cobound region, is plotted as a heatmap. Steel non-parametric test vs. 1 TF: *, #, ^, † indicate P < 0.05, P < 0.01, P < 0.001, and P < 0.0001, respectively. e Average ATAC-seq signal in reads per kilobase per million reads (RPKM), centered at distal regions co-occupied by the indicated number of TFs. Chromatin accessibility, as measured by ATAC-seq, increased with increasing number of co-occupying TFs. f Pairwise co-occupancy (Jaccard Similarity) of TFs in fetal and adult heart (upper left and bottom right matrices), and across stages (upper right matrix). Note stage-specific differences in pairwise co-occupancy. Source data for panels bd, f are provided as a Source Data file
Fig. 3
Fig. 3
Relationship of TF and H3K27ac occupancy. a Average plot of H3K27ac ChIP-seq signal from heart, liver, or forebrain at heart distal TF summits. RP10M, reads per 10 million reads. b Overlap of distal H3K27ac regions in heart (Ht), forebrain (FB), and liver (Li) with distal heart TF regions. c Distal regions with cardiac-enriched H3K27ac occupancy. Distal regions were ranked by their cardiac H3K27ac score (CHS), which was the ratio of the H3K27ac signal in heart to the maximum signal in either forebrain or liver. The highest two quintiles were designated as cardiac H3K27ac regions (cHRs). d Biological process gene ontology terms for distal H3K27ac regions by CHS quintile. The top five terms for each quintile are shown. Red text highlights heart-related terms. Gray boxes indicate non-significant enrichment P-values. e Overlap of distal TF co-occupied and H3K27ac regions, stratified by CHS quintile and number of co-occupying TFs. In the lower bubble plot, color signifies odds ratio, and size denotes −log10(Fisher test P-Value). Source data for panels ce are provided as a Source Data file
Fig. 4
Fig. 4
Transcriptional enhancer function of TF regions. a Average plot of 30-way vertebrate Phastcons scores at distal H3K27ac and TF regions. b Average plot of Phastcons scores at distal regions co-occupied by the indicated number of TFs, or by distal heart H3K27ac regions that do not overlap TF regions. c Average Phastcons scores in distal regions (center ± 150 bp) co-occupied by the indicated number of TFs with or without heart H3K27ac in fetal or adult heart. Steel-Dwass: ****P < 0.0001; ***P < 0.001; **P < 0.01; NS, not significant, mean values represented by dot (black). df Individual enhancer activity in murine cardiomyocytes was measured using an AAV9-based assay. Vector construct (d) contained minimal hsp68 promoter driving mCherry, with enhancer element (Enh) located in the 3′ UTR. U6:2xBroccoli was used to normalize transduction efficiency. Twelve enhancers belonging to three groups (H3K27ac+ TF; H3K27ac+ ≥5TF+; H3K27ac ≥5TF+) were individually tested in vivo. Normalized enhancer activity was compared to empty vector (AAV9;Hsp68:mCherry-no enhancer; n = 9) using Dunnett’s test. Error bars represent s.d. e Representative dark field and fluorescent wholemount images of adult (P28) mouse hearts showing enhancer activity for each group of cardiac enhancers. g, h AAV-based massively parallel reporter assay measurement of the activity of 1982 candidate enhancers and negative controls in cardiomyocytes in vivo. AAV library was delivered at P0 and measured in ventricles at P7. g Activity, expressed as enhancer reads in RNA normalized to enhancer abundance in AAV genomic DNA, was plotted versus region activity rank. Relative rank of individual regions of each class is represented by vertical lines below plot. 5% false discovery rate (FDR) threshold (dotted line) indicates the 95th percentile of ESC H3K27ac negative control region activity. h Relative activity of each class of regions tested is summarized displaying mean (line) and 95th confidence interval (box) with s.d. (whiskers). Heatmap above violin plot shows statistical significance of inter-group comparisons (Steel-Dwass). Source data for panels c, e, g are provided as a Source Data file
Fig. 5
Fig. 5
Multi-TF co-occupancy contributes to prediction of active heart enhancers. The VISTA enhancer database was used as the gold standard to develop classifiers of transcriptional enhancers based on TF co-occupancy, H3K27ac occupancy, and chromatin accessibility. a Recall and precision of VISTA heart enhancer activity based on heart chromatin features. b VISTA heart enhancer receiver-operating characteristic curve and area-under-the-curve (AUC) scores for each factor. An example ROC curve for enhancer prediction by fetal GATA4 bioChIP-signal is shown in the left panel. Similar analyses of other chromatin features is shown in Supplementary Fig. 13. The right plot summarizes the predictive accuracy, assessed by the AUC, for the indicated chromatin features. c Machine learning (ML) classifier performance for classification of VISTA heart enhancers. An ensemble decision tree-based classifier was trained using 80% of the data and tested on the remainder. Classifier performance receiver-operating characteristic curve (left) yielded AUC = 0.88. Performance in 100 permutations of five-fold cross-validation is shown by the box plot to the right. The average ML classifier AUC is indicated by the red dashed line in panel b. d Relative feature importance in the ML classifier. The box plots show the relative importance of individual chromatin features for classifier performance in 100 permutations of five-fold cross validation. e Effect of omission of top ranked classifier features on classifier performance. Omission of H3K27ac signal did not affect classifier performance, but omission of “number of TFs” impaired classifier performance. Box plots in figure; 1st through 3rd quartile represented by box and whiskers denoting min and max values, Source data for panels a-e are provided as a Source Data file
Fig. 6
Fig. 6
Stage-specific TF chromatin occupancy regulates stage-specific gene expression. a Cardiomyocyte gene expression association with TF regions and heart H3K27ac. Genes were assigned to the region within 100 kb with the highest number of cobinding TFs. This region was classified as with or without H3K27ac overlap. †, Wilcoxon test for expression with heart H3K27ac compared to without for same TF number and stage. *, Steel-Dwass for expression difference between indicated groups. n indicates group size and vertical line denotes s.e.m. with outliers plotted. b, c Fetal or adult-based cardiac gene expression association with fetal-TF or adult-TF regions. Volcano plot (b) of fetal vs. adult cardiomyocyte gene expression shows fetal-biased genes (blue) and adult-biased genes (red), defined as −log10(P value) > 3 and abs(log2FC) > 2. Right plot (c) shows enrichment (observed/expected) of TF or H3K27ac regions within the indicated distance of the TSS of fetal-biased or adult-biased genes. The expected number was determined by randomly permuting the TF or H3K27ac regions 10,000 times across the mappable genome (see the section Methods). The size of symbols indicates the permutation P-value. Squares and circles indicate regions with or without H3K27ac co-occupancy, respectively. TF co-occupied region sets containing <100 members were excluded (dashed symbol in figure legend). Source data for panels a, c are provided as a Source Data file
Fig. 7
Fig. 7
TEAD1 is an integral regulator of cardiac gene expression. a Enrichment of TF or H3K27ac regions adjacent to genes up-regulated and down-regulated in fetal or adult Tead1 knockout hearts. TF regions contained TEAD1. Enrichment (observed/expected) of TF or H3K27ac regions within the indicated distance of differentially expressed genes’ TSS was calculated by permutation testing. Expected values were determined by randomly distributing regions across the mappable genome in 3000 permutations. Size of symbols indicate permutation test P-value. TEAD1-occupied regions marked by H3K27ac were enriched adjacent to upregulated DEGs. b GO term analysis of genes down-regulated or up-regulated in TEAD1 knockout and adjacent to TEAD1-bound regions. Down-regulated, TEAD1-bound genes were enriched for biological process terms related to cardiomyocyte-specific functions. c, d Bubble plots indicating enrichment of regions occupied by the indicated TF (NKX2-5 or TEAD1) within 10 kb of the TSS of up-regulated or down-regulated genes in the indicated datasets involving either Tead1 knockout or Nkx2-5 mutation. NKX2-5 or TEAD1-bound regions marked by H3K27ac were enriched adjacent to genes downregulated by Nkx2-5 or Tead1 mutation. e “Preferred” arrangements of NKX2-5 and TEAD1 motifs in regions co-bound by these TFs (see Supplementary Fig. 10j). f Enrichment of regions co-bound by NKX2-5 and TEAD1 and containing the indicated motif arrangement adjacent to differentially expressed genes in fetal heart. Bubble size indicates permutation P-value (3000 permutations). Color indicates fold-change of enrichment compared to co-bound regions containing the 28 non-preferred motif arrangements. Source data for panels a, c, d, f are provided as a Source Data file

References

    1. Voss TC, Hager GL. Dynamic regulation of transcriptional states by chromatin and transcription factors. Nat. Rev. Genet. 2014;15:69–81. doi: 10.1038/nrg3623. - DOI - PMC - PubMed
    1. Farnham PJ. Insights from genomic profiling of transcription factors. Nat. Rev. Genet. 2009;10:605–616. doi: 10.1038/nrg2636. - DOI - PMC - PubMed
    1. He A, et al. Dynamic GATA4 enhancers shape the chromatin landscape central to heart development and disease. Nat. Commun. 2014;5:4907. doi: 10.1038/ncomms5907. - DOI - PMC - PubMed
    1. Zhou, P. et al. Mapping cell type-specific transcriptional enhancers using high affinity, lineage-specific Ep300 bioChIP-seq. eLife6, e22039 (2017). - PMC - PubMed
    1. Kathiriya IS, Nora EP, Bruneau BG. Investigating the transcriptional control of cardiovascular development. Circ. Res. 2015;116:700–714. doi: 10.1161/CIRCRESAHA.116.302832. - DOI - PMC - PubMed

Publication types