. 2020 Feb;19(2):227-238.
doi: 10.1038/s41563-019-0504-3. Epub 2019 Oct 28.

Extracellular matrix anisotropy is determined by TFAP2C-dependent regulation of cell collisions

Affiliations

Extracellular matrix anisotropy is determined by TFAP2C-dependent regulation of cell collisions

Danielle Park et al. Nat Mater. 2020 Feb.

Abstract

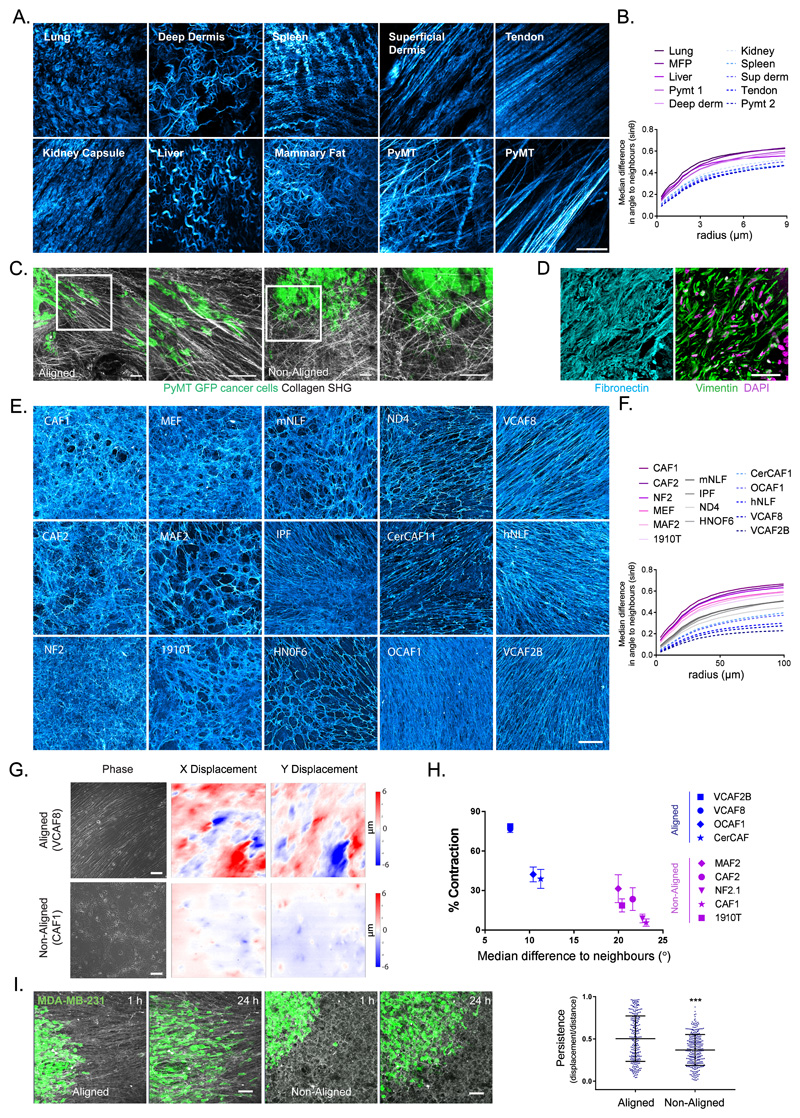
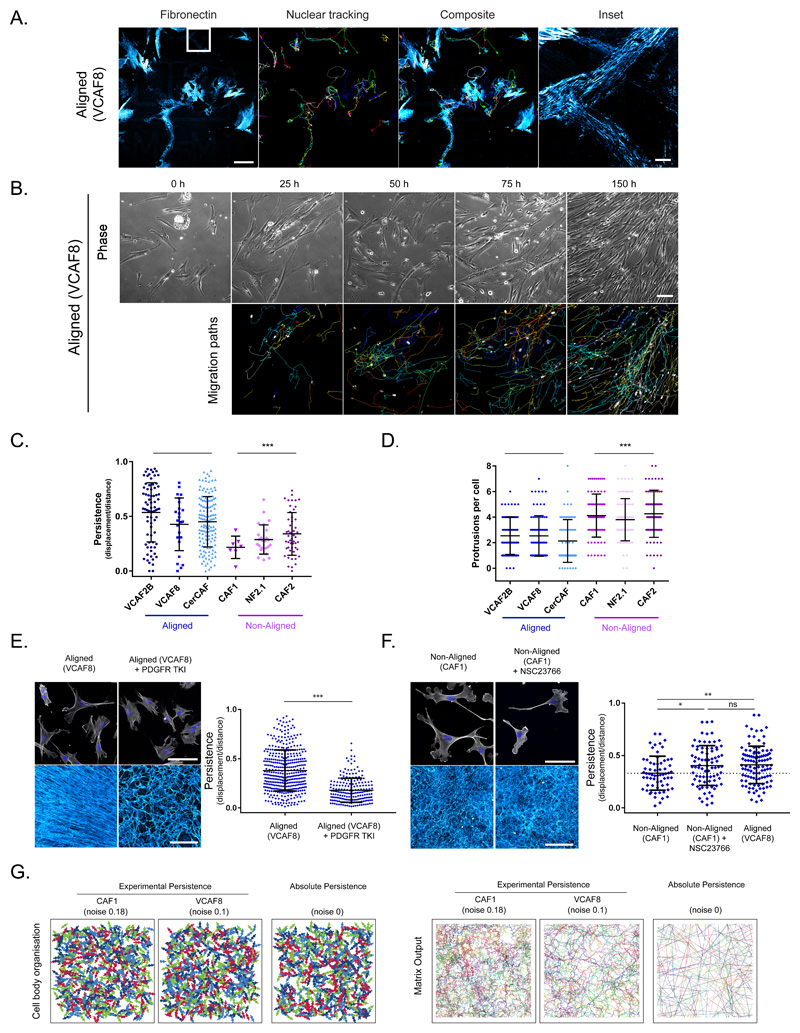
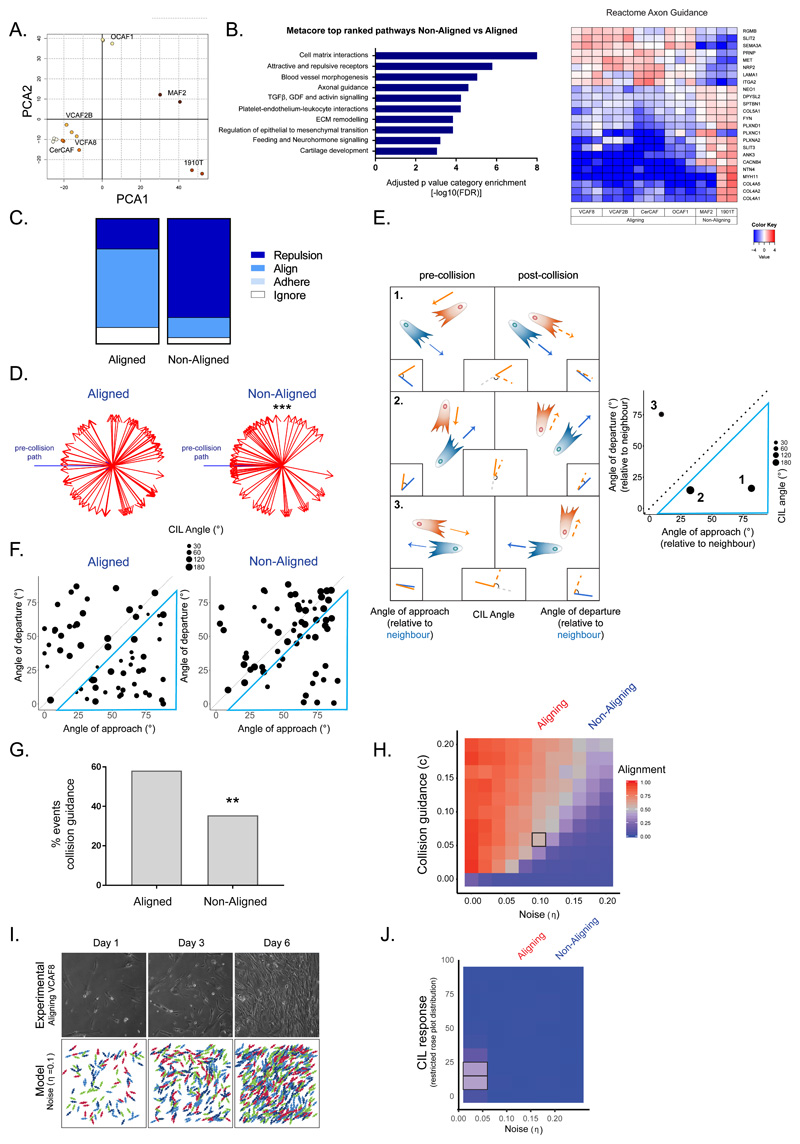
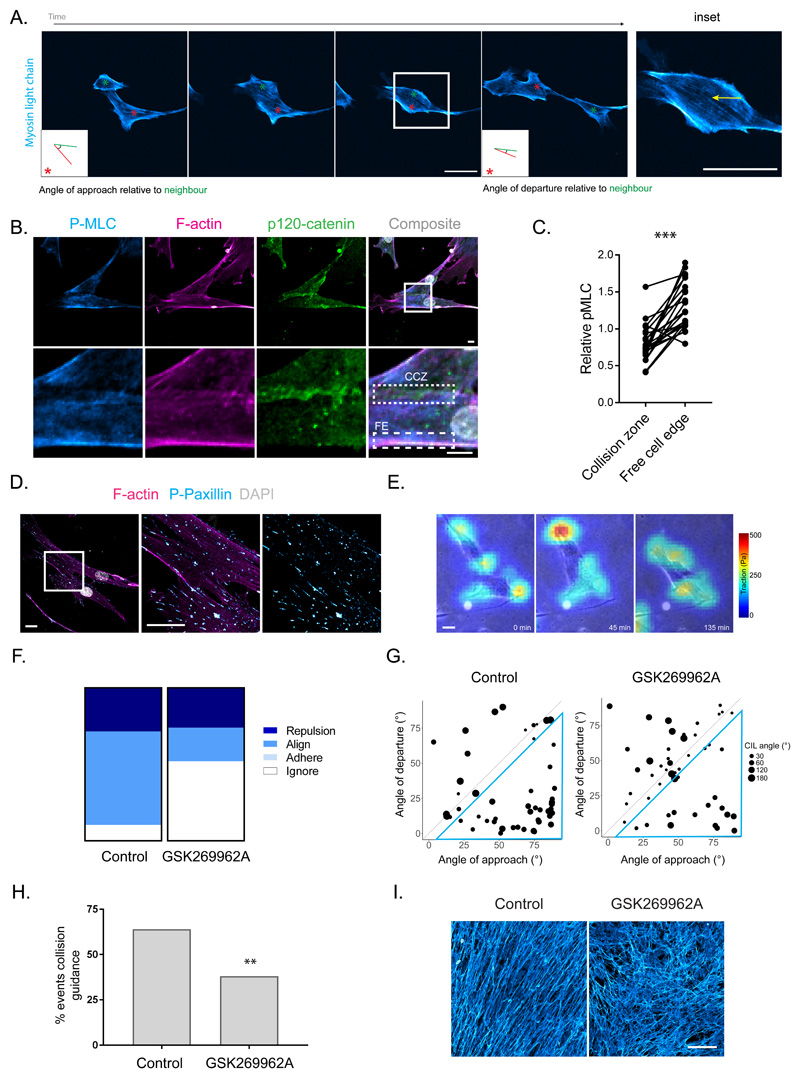
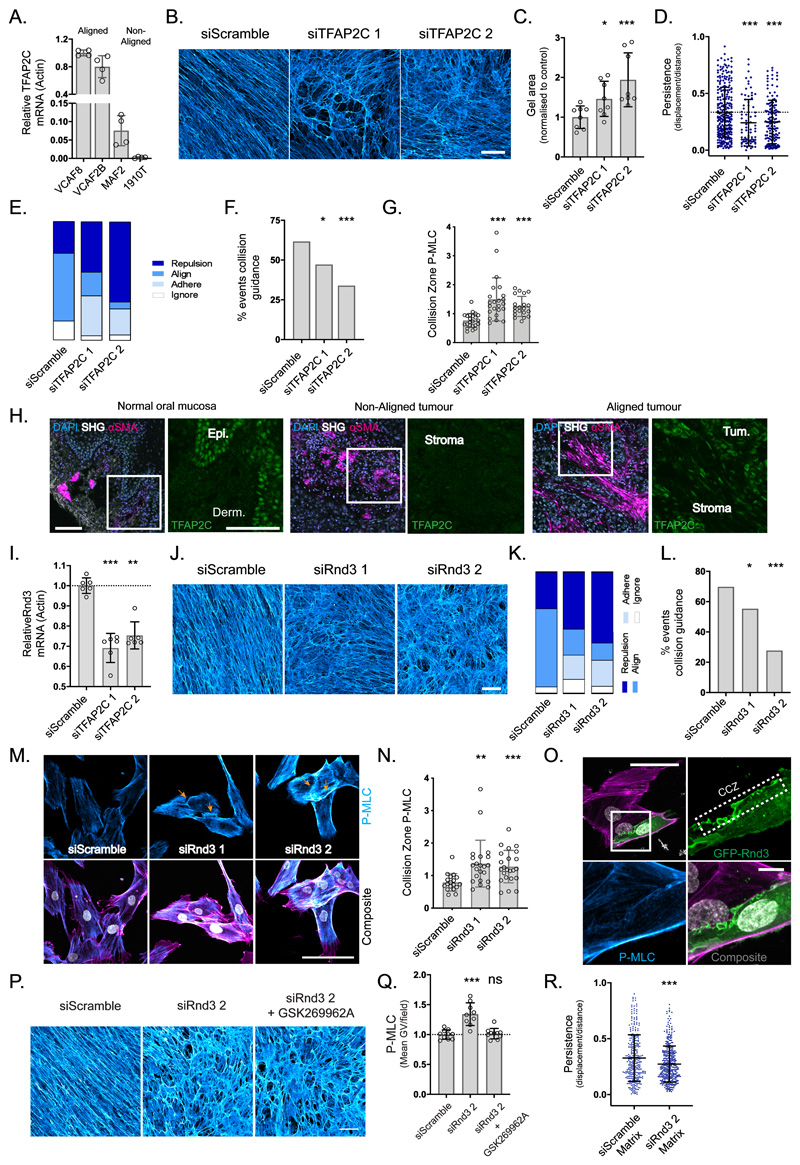
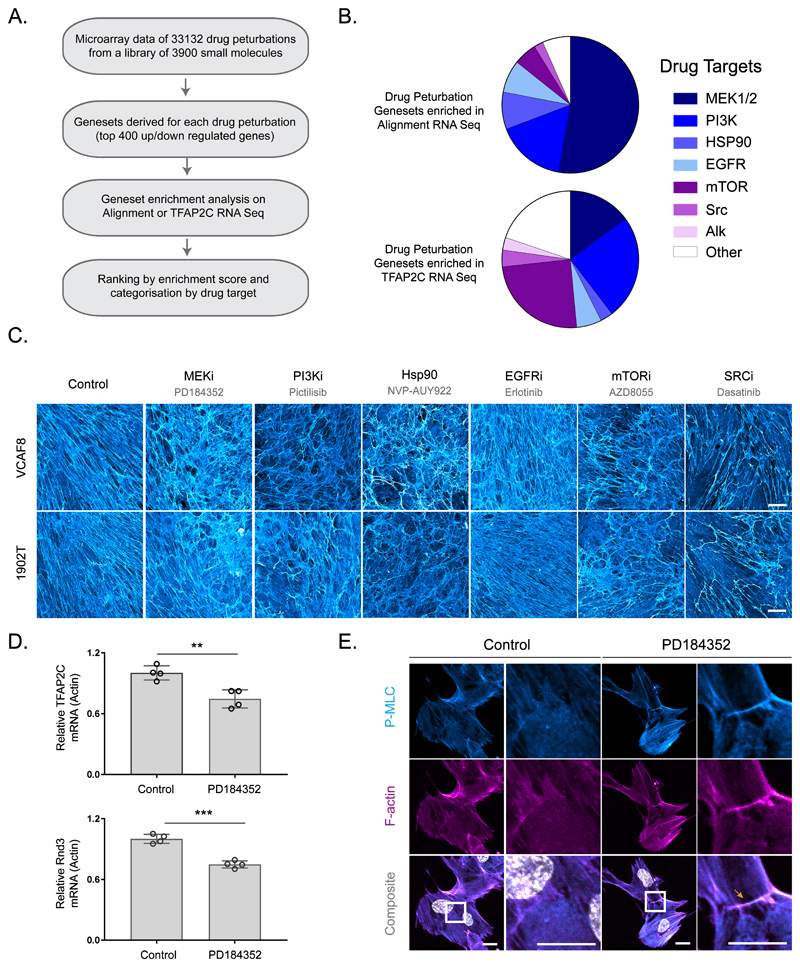
The isotropic or anisotropic organization of biological extracellular matrices has important consequences for tissue function. We study emergent anisotropy using fibroblasts that generate varying degrees of matrix alignment from uniform starting conditions. This reveals that the early migratory paths of fibroblasts are correlated with subsequent matrix organization. Combined experimentation and adaptation of Vicsek modelling demonstrates that the reorientation of cells relative to each other following collision plays a role in generating matrix anisotropy. We term this behaviour 'cell collision guidance'. The transcription factor TFAP2C regulates cell collision guidance in part by controlling the expression of RND3. RND3 localizes to cell-cell collision zones where it downregulates actomyosin activity. Cell collision guidance fails without this mechanism in place, leading to isotropic matrix generation. The cross-referencing of alignment and TFAP2C gene expression signatures against existing datasets enables the identification and validation of several classes of pharmacological agents that disrupt matrix anisotropy.


Conflict of interest statement

Competing Financial Interests

There are no competing financial interests to declare.

Figures

Figure 1
Figure 1. Extracellular matrix anisotrophy instructs cancer cell migration and enables the global co-ordination of force.
A. Collagen organisation in murine tissues imaged by second harmonic imaging (scale bar 20μm, representative image of 3 samples shown). B. Quantification of fibre alignment by median difference in angle to neighbours (sinθ) over expanding neighbourhoods (radii in μm). Higher values indicate greater disorder (images in A shown). C. Invasive patterns of PyMT-GFP tumour cells in aligned vs non-aligned collagen (visualised by second harmonic imaging - grey) (scale bar 100μm, representative images of three fields of view from two independent experiments shown). D. Human squamous cell carcinoma stained for fibronectin (cyan), vimentin (green) and DAPI (magenta) (scale bar 50μm, representative images from 6 individual samples). E. Panel of fibroblast derived matrices (FDMs) stained for fibronectin (cyan) (scale bar 100μm, representative images from three independent experiments shown). F. Quantification of ECM alignment of individual images in E. G. Traction force microscopy of aligned (VCAF8) and non-aligned (CAF1) fibroblasts at confluence, showing bright-field phase imaging of cell body organisation and substrate displacement in both x and y (scale bar 100μm, representative images of 5 fields of view from 2 independent experiments shown). H. Correlation analysis of collagen gel contraction with alignment metric (n=52 in total, from 2 independent experiments, mean and standard error of the mean (SEM) shown. Two tailed Pearson correlation test, r = -0.9187, p value= 0.0002). I. Migration of MDA-MD-23-GFP cells (green) on aligned (VCAF8 derived) or non-aligned (CAF1 derived) matrices over 24 hrs (scale bar =100μm, representative images from 3 independent experiments). Tumour cell persistence (displacement/distance) over 12 hr intervals (n=547 cells in total from 3 independent experiments, p<0.0001, two tailed unpaired t-test, bars indicate mean and standard deviation (SD)).
Figure 2
Figure 2. Aligned fibroblasts demonstrate higher intrinsic polarity and migratory persistence, but this is insufficient to drive alignment.
The migratory behaviour of fibroblasts determines their ultimate organisation. A. Correlative time-lapse microscopy of aligning (VCAF8) fibroblasts with nuclear tracking showing correlation of migration path with deposited fibronectin (cyan) over 16 hrs (representative images of 3 fields of view from 2 independent experiments shown). B. Time-lapse microscopy of aligning (VCAF8) fibroblasts over 7 days, showing bright field phase imaging and nuclear tracking. Migration paths of the previous 25 hrs are shown (representative images of 3 fields of view from 3 independent experiments shown). C. Persistence analysis (displacement/distance) over 16 hr intervals (n= 322 cells from 2 independent experiments, p<0.0001 two-tailed unpaired t-test, bars indicate mean and SD). D. Analysis of protrusions per cell (n=599 cells from 2 independent experiments, p<0.0001 two-tailed unpaired t-test, bars indicate mean and SD). E. Aligning VCAF8 stained for F-actin and DAPI, and their FDMs when treated with or without 100nM PDGFRi (representative images of 3 samples from two independent experiments). Persistence analysis of aligning VCAF8 with or without 100nM PDGFRi over 16 hr intervals (n=609 cells in total, p<0.0001 two-tailed unpaired t-test, bars indicate mean and SD). F. Non-aligning CAF1 stained for F-actin (white) and DAPI (blue) or fibroblast derived matrix (cyan) with or without 20μM NSC23766 treatment (representative images of 3 samples from two independent experiments). Persistence analysis of non-aligning CAF1 with or without NSC23766, compared to aligning VCAF8 over 16 hr intervals (n=249 cells from two independent experiments. CAF1 vs CAF1+NSC, p=0.0154, CAF1 vs VCAF8, 0.0041, CAF1+ NSC vs VCAF8, p=0.8112, two-tailed unpaired t-test, mean and SD are shown). G. Cell body and matrix organisation model outputs are shown with varying noise/persistence. Panels show persistence fitted to experimental data (noise: 0.1, aligned VCAF8, noise:0.18, non-aligned CAF1) as well as absolute persistence (noise:0) (representative images from 10 independent simulations shown).
Figure 3
Figure 3. Aligned fibroblasts show supressed contact inhibition of locomotion and elevated collision guidance.
A. Principal component analysis showing segregation of fibroblast RNAseq data (n=16 from 3 independent experiments). B. Top differentially regulated Metacore pathways are shown together with heatmap of reactome axon guidance genes. Fold change is shown in log2 scale (n=16 from 3 independent experiments, Benjamini Hochberg adjusted p-values, two-sided). C. Quantification of cell collisions in aligning fibroblasts (VCAF8 and VCAF2B) and non-aligning fibroblasts (CAF1, NF2.1 and CAF2) as either repulsion, alignment (collision guidance), adhere or ignore (n=124 collisions from three independent experiments). D. Analysis of CIL response in aligned (VCAF8, VCAF2B) and non-aligned (CAF1, NF2.1, CAF2) fibroblasts. Change in cell trajectory upon collision relative to the pre-collision path (blue arrow). (n=90 collisions from three independent experiments. p=5x10⁻⁵, one-sided t-test). E. Schematic of collisions between two cells. CIL is indicated by the repolarisation of the cell, relative to its pre-collision trajectory (angle between orange and orange-dashed line. Collision guidance is assessed by comparing the angle of approach (angle between orange and blue line) and departure, relative to its neighbour (angle between orange-dashed and blue line). Plot of example collisions. Diameter of dot indicates the strength of the repolarisation/CIL response. Collisions inside blue triangle reflect collision guidance events (departure angle is more than 10 degrees smaller than approach angle). F. Analysis of collision angles in aligned (VCAF8, VCAF2B) and non-aligned (CAF1, NF2.1, CAF2) fibroblasts. Collisions inside blue triangle reflect collision guidance events (n=124 collisions from two independent experiments). G. Quantification of collision guidance events (n=124 collisions from two independent experiments. p= 0.006, one-sided z-test). H. Model exploration of alignment as noise and collision guidance are co-varied. Text above indicates noise values fitted to experimental data for aligning (VCAF8, noise =0.1) and non-aligning (CAF1, noise=0.18) fibroblasts. Each square is the average of 10 independent simulations. I. Comparison of experimental alignment against model simulation with experimental persistence of VCAF8 (noise=0.1) and collision guidance=0.06 (indicated by black square in 3H). Experimental panels show bright field time-lapse microscopy of aligning VCAF8. Model panels show simulation of cell body organisation J. Model exploration of alignment as only CIL response and noise (persistence) are co-varied. Text above indicates noise values fitted to experimental data for aligning (VCAF8: noise =0.1) and non-aligning (CAF1: noise=0.18) fibroblasts. Each square is the average of 10 independent simulations.
Figure 4
Figure 4. Collision guidance entails the suppression of actomyosin contractility at cell:cell contacts.
A. Time-lapse imaging of MLC-GFP (cyan) in aligning fibroblasts (VCAF2B) during collision guidance. Metrics for collision guidance (angle of approach and departure relative to neighbour) are shown in boxed inlay. (Representative images from three independent experiments shown). B. Immunofluorescence of pS19-MLC (cyan), p120-catenin (green) and F-actin (magenta) in aligning VCAF8 (scale bar 10μm). CCZ – Cell-cell Collision Zone, FE – Free Edge (representative images from three independent experiments shown). C. Paired measurements of pS19-MLC at cell-cell collision zones vs free edge in cells. Data are normalised to cell body pS19-MLC (n=46 in total from three independent experiments, p<0.0001 two-tailed Wilcoxon matched-pairs signed rank test). D. Immunofluorescence of p-paxillin (cyan) and F-actin (magenta) in aligning VCAF8 (scale bar 20μm, representative images from three independent experiments shown). E. Overlaid traction force (false colour – red = high traction, cyan = low traction) and phase contrast (gray) images of VCAF8 undergoing collision guidance (scale bar 10μm, representative images from two independent experiments shown). F. Fibronectin stained FDMs from aligning (VCAF8) fibroblasts with or without ROCKi treatment (GSK269962A 20nM, scale bar 100μm, representative images from three independent experiments shown). G. Quantification of cell collisions in aligning fibroblasts (VCAF8) as either repulsion, alignment (collision guidance), adhere or ignore, with or without ROCKi treatment (n=100 collisions from two independent experiments). H. Analysis of collision guidance using the angle of approach (x axis) and departure (y axis) relative to the cell it collides with. Collisions in which angle of departure < angle of approach (inside blue triangle) reflect collision guidance events. Radius of dot indicates the CIL angle (n=100 collisions from two independent experiments). I. Quantification of collision guidance events in the presence of absence of ROCKi treatment (Collision guidance classified as collisions where angle of approach – angle of departure is between 10-90°, n=100 collisions from two independent experiments, p= 0.005, one-sided z-test).
Figure 5
Figure 5. TFAP2C acts through RND3 to facilitate collision guidance and alignment.
A. qRT-PCR of TFAP2C gene expression in aligning vs non-aligning fibroblasts (n=16 from two independent experiments, mean and SD shown). B. FDMs from aligning VCAF8 transfected with two separate TFAP2C siRNA vs non-targeting control (scale bar:100μm, representative images of three fields of view from three independent experiments). C. Collagen gel contraction of aligning VCAF8 with TFAP2C knockdown vs control (n=24 from two independent experiments, p= 0.0265, p= 0.0028, unpaired two-tailed t-test, bars show mean and SD). D. Migratory persistence of aligning VCAF8 with TFAP2C knockdown vs control over 12 hr intervals (n=482 cells from two independent experiments, p=0.001, p=0.0001, unpaired two-tailed t-test, bars show mean and SD). E. Relative contribution of cell repulsion, alignment (collision guidance), adhesion or ignoring in aligning VCAF8 with TFAP2C depletion vs control (n=230 collisions in total from two independent experiments). F. Collision guidance events as a proportion of total collisions in TFAP2C knockdown vs control VCAF8 (n=230 collisions from two independent experiments. p=0.048, p= 0.00085, one-sided z-test). G. pS19-MLC at the cell-cell collision zone in TFAP2C knockdown vs control VCAF8. Values normalised to cell body pS19-MLC (n=66 cells, p<0.0001 unpaired two-tailed t-test, mean and SD are shown). H. Normal human oral mucosa and squamous cell carcinomas stained for DAPI (light blue), αSMA (magenta) and TFAP2C (green), with second harmonic imaging (grey), (scale bar: 100μm, from 6 independent samples). I. qRT-PCR analysis of relative RND3 gene expression in TFAP2C depleted cells vs control (n= 18 from three independent experiments, p<0.0001, p= 0.0014, unpaired two-tailed t-test, mean and SD are shown). J. Fibronectin stained matrices from VCAF8 with RND3 siRNA knockdown vs control (scale bar:100μm, representative images of three fields of view, from three independent experiments shown). K. Relative contribution of cell repulsion, alignment (collision guidance), adhesion or ignoring in VCAF8 with RND3 knockdown vs control (n=216 collisions in total from two independent experiments). L. Quantification of collision guidance events as a proportion of total collisions in RND3 knockdown vs control VCAF8 (n=216 collisions from two independent experiments, p=0.046, p<0.00001, one-sided z-test). M. F-actin (magenta), pS19-MLC (cyan) and DAPI (white) in RND3 depleted VCAF8 vs control (scale bar:100μm, representative images of three separate fields of view from two independent experiments shown). N. pS19-MLC values at the cell-cell collision zone in RND3 knockdown vs control VCAF8. Values normalised to cell body pS19-MLC (n=63 in total, p= 0.0027, p=0.0006, unpaired two-tailed t-test. Mean and SD are shown). O. VCAF8 transfected with eGFP-RND3 (green) and stained for pS19-MLC (cyan) and F-actin (magenta). Cell-cell collision zone (CCZ) (scale bar: 50μm, representative images from three independent experiments). P. Fibronectin stained FDMs from aligning VCAF8 with RND3 knockdown vs control, in the presence of absence of ROCK inhibitor (GSK269962A, 0.5nM) (scale bar=100μm, representative images of three fields of view, from two independent experiments shown). Q. pS19-MLC fluorescence intensity in VCAF8 from the above experiment (n=28 fields of view in total from two independent experiments, p<0.0001, p= 0.6866, bars show mean and SD). R. Migratory persistence of MDA-MB-231-GFP cells on FDMs derived from VCAF8 with Rnd3 knockdown vs control measured over 12 hr intervals (n=694 cells from 2 independent experiments, p=0.0001, two tailed unpaired t-test, bars show mean and SD).
Figure 6
Figure 6. Predicting pharmacological perturbation of alignment.
A. Workflow of drug perturbation analysis. B. Enrichment of drug perturbation genesets in either aligned vs non-aligned or TFAP2C knock down RNA Seq analysis. The proportion of genesets with a particular drug perturbation are represented in the pie chart. C. Fibronectin stained FDMs from aligning VCAF8 and 1902T fibroblasts treated with PD148352 (1μM), Pictilisib (0.1μM), NVP-AUY922 (0.01μM), Erlotinib (1μM), AZD8055 (0.1μM) or Dasatanib (0.5μM) (scale bar=100μm, representative images of three separate fields of view from two independent experiments shown) D. qRT-PCR analysis of TFAP2C and RND3 gene expression in aligning VCAF8 in the presence or absence of MEK inhibitor PD148352 (1μM) (n=8 in total from two independent experiments. TFAP2C: Control vs PD148352 p = 0.0042, Rnd3: Control vs PD148352 p = 0.0001, unpaired two-sided t-test). E. pS19-MLC (cyan) and F-actin (magenta) in aligning VCAF8 in the presence or absence of PD148352 (1μM). PD148352 treated cells show pS19-MLC at cell:cell contacts (scale bar=20μm, representative images of three separate fields of view from two independent experiments shown).

References

    1. Mouw JK, Ou G, Weaver VM. Extracellular matrix assembly: a multiscale deconstruction. Nat Rev Mol Cell Biol. 2014;15:771–785. doi: 10.1038/nrm3902. - DOI - PMC - PubMed
    1. Conklin MW et al. Aligned collagen is a prognostic signature for survival in human breast carcinoma. Am J Pathol. 2011;178:1221–1232. doi: 10.1016/j.ajpath.2010.11.076. - DOI - PMC - PubMed
    1. Conklin MW et al. Collagen Alignment as a Predictor of Recurrence after Ductal Carcinoma In Situ. Cancer Epidemiol Biomarkers Prev. 2018;27:138–145. doi: 10.1158/1055-9965.EPI-17-0720. - DOI - PMC - PubMed
    1. Provenzano PP et al. Collagen reorganization at the tumor-stromal interface facilitates local invasion. BMC Med. 2006;4:38. doi: 10.1186/1741-7015-4-38. - DOI - PMC - PubMed
    1. Drifka CR et al. Highly aligned stromal collagen is a negative prognostic factor following pancreatic ductal adenocarcinoma resection. Oncotarget. 2016;7:76197–76213. doi: 10.18632/oncotarget.12772. - DOI - PMC - PubMed

Publication types

Substances