. 2019 Nov;37(11):1372-1379.
doi: 10.1038/s41587-019-0268-y. Epub 2019 Oct 28.

Diagnostic kit for rice blight resistance

Affiliations

Diagnostic kit for rice blight resistance

Joon-Seob Eom et al. Nat Biotechnol. 2019 Nov.

Abstract

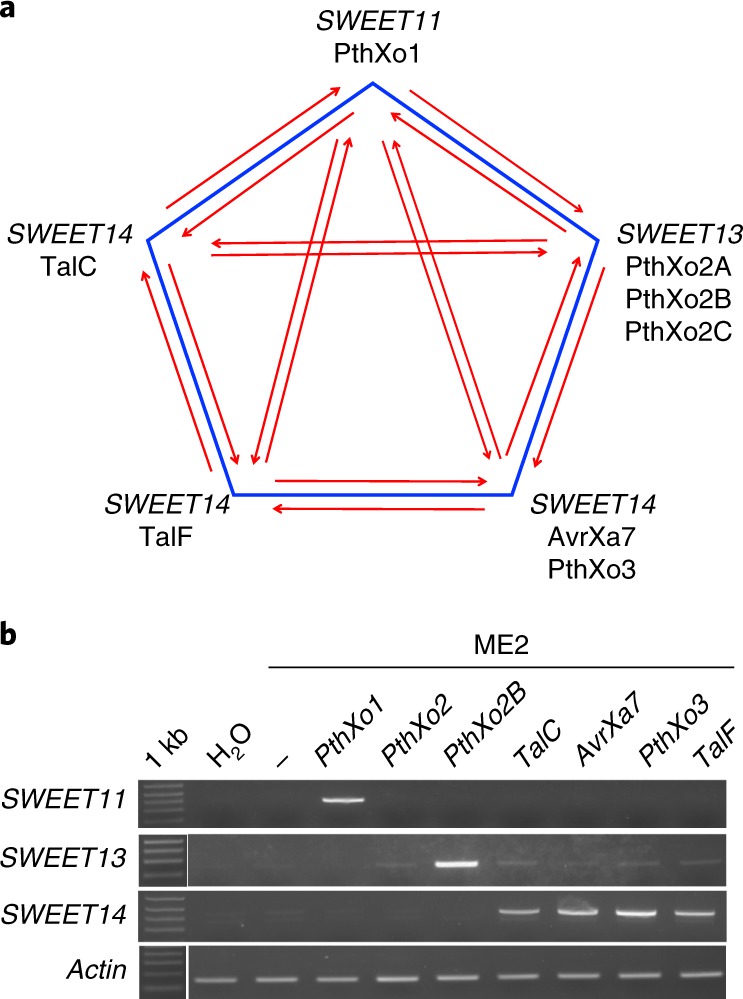
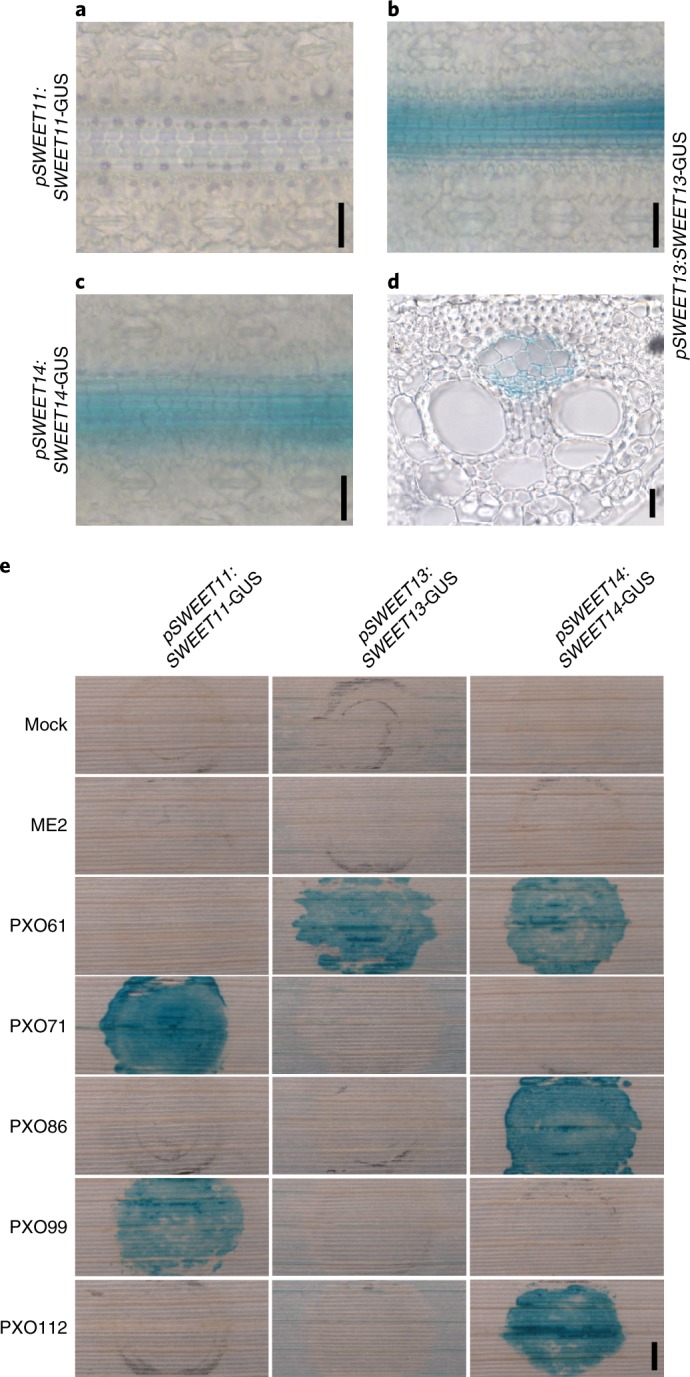
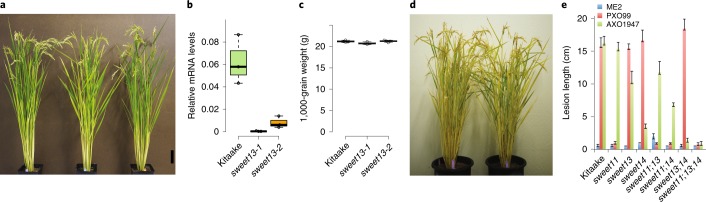
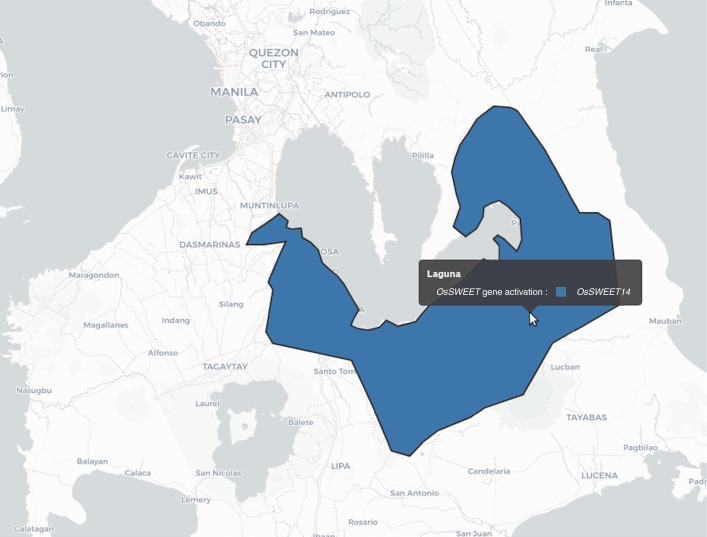
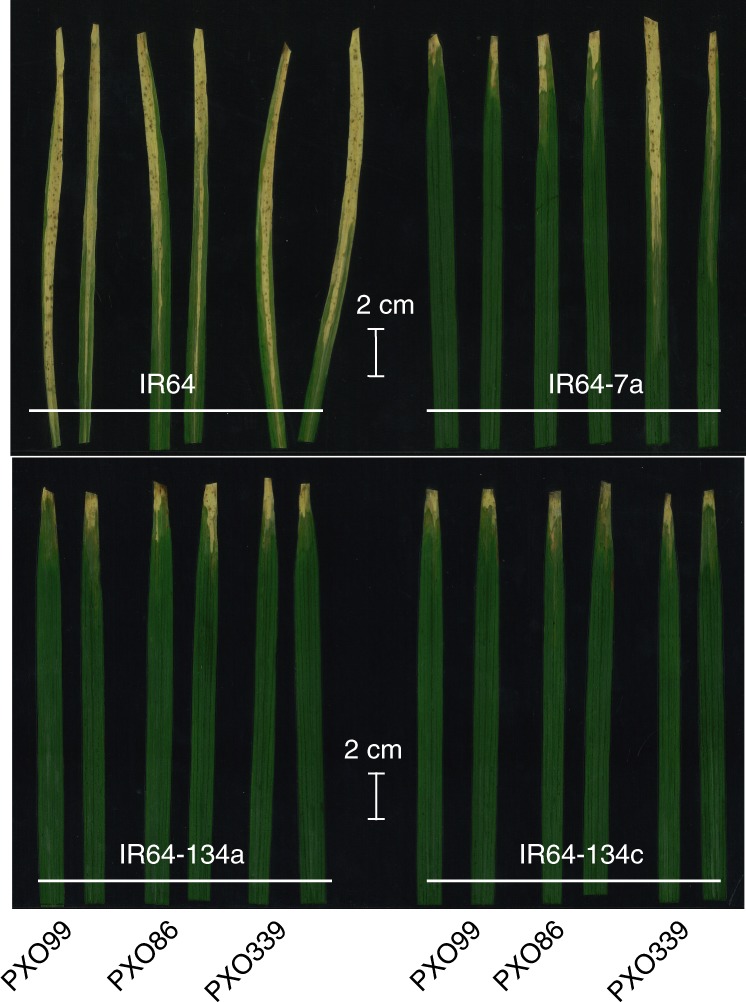
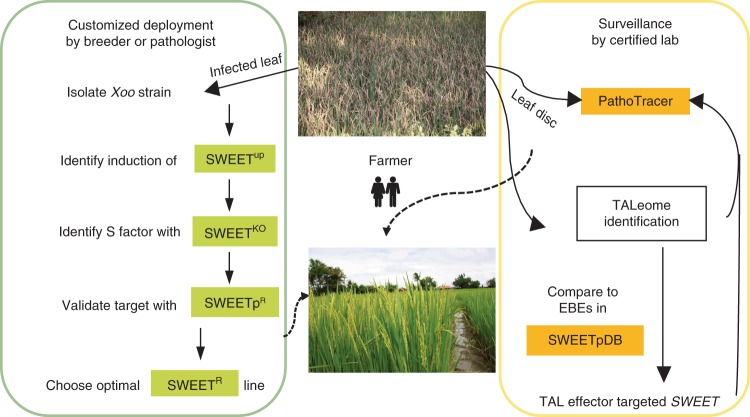
Blight-resistant rice lines are the most effective solution for bacterial blight, caused by Xanthomonas oryzae pv. oryzae (Xoo). Key resistance mechanisms involve SWEET genes as susceptibility factors. Bacterial transcription activator-like (TAL) effectors bind to effector-binding elements (EBEs) in SWEET gene promoters and induce SWEET genes. EBE variants that cannot be recognized by TAL effectors abrogate induction, causing resistance. Here we describe a diagnostic kit to enable analysis of bacterial blight in the field and identification of suitable resistant lines. Specifically, we include a SWEET promoter database, RT-PCR primers for detecting SWEET induction, engineered reporter rice lines to visualize SWEET protein accumulation and knock-out rice lines to identify virulence mechanisms in bacterial isolates. We also developed CRISPR-Cas9 genome-edited Kitaake rice to evaluate the efficacy of EBE mutations in resistance, software to predict the optimal resistance gene set for a specific geographic region, and two resistant 'mega' rice lines that will empower farmers to plant lines that are most likely to resist rice blight.


Conflict of interest statement

W.B.F., J.S.E., F.W., B.Y. and R.O. are inventors on US provisional patent application 62832300 that covers Kitaake, IR64 and Ciherang-Sub1 EBE-edited lines and kit components described here.

Figures

Fig. 1
Fig. 1. SWEET11SWEET13SWEET14 EBE pentagon and PCR detection of SWEET induction.
a, Arrows indicate which TAL effectors can overcome a particular resistance mechanism by activating any of the other SWEET genes or by activating the same SWEET gene via targeting another EBE in the same promoter. For example, xa13-based resistance (resulting from a variant in the SWEET11 promoter that is not recognized by PthXo1) can be overcome by other TAL effectors (e.g., PthXo2 and PthXo3) that target the EBEs in another SWEET gene promoter or, in the case of SWEET14, target different EBEs in the same promoter. b, Example of SWEET gene induction as detected by RT–PCR using the SWEETup primer set. RT–PCR products are shown for the SWEET11, SWEET13 and SWEET14 genes in Kitaake infected by Xoo strain ME2 lacking a SWEET-targeting TAL effector and ME2 transformed with plasmids encoding PthXo1 (targeting SWEET11), PthXo2 or PthXo2B (both targeting SWEET13) and PthXo3, TalC, TalF or AvrXa7 (all targeting SWEET14). Actin served as a control. Leaves were infected using leaf-clipping assays; scissors dipped in water served as an additional negative control. The experiment was repeated twice independently with similar results.
Fig. 2
Fig. 2. SWEET protein accumulation in uninfected and infected transgenic rice leaves.
a–c, GUS activity in flag leaf blades of rice for pSWEET11:SWEET11-GUS (event 10) (a), pSWEET13:SWEET13-GUS (event 22) (b) and pSWEET14:SWEET14-GUS (event 3) (c). d, A cross-section of the leaf blade from pSWEET13:SWEET13-GUS in b. e, SWEET protein accumulation upon infection with Xoo strains (pSWEET11:SWEET11-GUS event 10, pSWEET13:SWEET13-GUS event 15 and pSWEET14:SWEET14-GUS event 3). Scale bars: 20 µm (a–d); 1 mm (e). The experiment was repeated at least three times independently with similar results.
Fig. 3
Fig. 3. SWEETko knockout mutants as diagnostic tools.
a, Phenotypes of sweet13-1 and sweet13-2 knockout mutants relative to Kitaake controls at the mature stage. Scale bar, 10 cm. b, Relative mRNA levels of SWEET13 in flag leaf blades. Samples were harvested at 12:00 (mean ± s.e.m., n = 3 biological replicates with mRNA levels normalized to rice Ubiquitin1 levels; repeated independently three times with similar results). Center lines show medians; box limits indicate the 25th and 75th percentiles as determined by R software; and whiskers extend 1.5 times the interquartile range from the 25th and 75th percentiles. c, One-thousand-grain weight of greenhouse-grown Kitaake, sweet13-1 and sweet13-2 (mean ± s.e.m.; n = 4 biological replicates). The experiment was repeated at least three independent times with similar results. Center lines show medians; box limits indicate the 25th and 75th percentiles as determined by R software; and whiskers extend 1.5 times the interquartile range from the 25th and 75th percentiles. No significant differences (P = 0.051 for sweet13-1 and P = 0.758 for sweet13-2) were identified by Student’s t-test. d, Phenotypes of wild type and the sweet13;sweet14 double knockout grown in the greenhouse. No significant differences were identified. e, Length of lesions at 14 days after inoculation (DAI) caused by ME2 (negative control), PXO99 (positive control) and AXO1947 on single-, double- and triple-knockout (sweet11, sweet13 and sweet14) mutants relative to Kitaake wild type (mean ± s.e.m.; n = 10 inoculated leaves). The experiment was independently repeated twice with similar results. The difference observed for AXO1947 virulence between sweet14 and sweet11;14 in a single experiment was not significant when compared over a larger number of experiments (Supplementary Fig. 14).
Fig. 4
Fig. 4. PathoTracer visualization showing prevalence of Xoo strains with putative SWEET14 induction in the Philippines.
PathoTracer (http://webapps.irri.org/pathotracer/index.html) is an online repository that integrates genotypic and phenotypic pathogen data with the resistance profiles of rice accessions to support strategic deployment of varieties in the region. Tester- strain-based prediction of SWEET targets is provided here for SWEET14, using Xoo populations collected from 1972 to 2012 in Laguna, a disease-endemic area in the Philippines (n = 1,294 isolates). A screenshot of the full interface with the same map is shown in Supplementary Fig. 15.
Fig. 5
Fig. 5. Resistance of genome-edited rice lines to different Xoo strains.
Reactions of IR64 SWEET-promoter-edited lines to three representative Xoo strains (data from ref. ). Lesion lengths were measured at 14 DAI with strains PXO99A, PXO339 and PXO86. Infections were carried out at the maximum tillering stage by inoculating 3–6 leaf samples using a leaf clipping. Four replicate experiments with two plants each were performed per strain (four replicates per strain, two plants per replicate (n = 8)) and scored for 3–6 inoculated leaf samples per plant. The experiment was repeated three times independently.
Fig. 6
Fig. 6. Customized deployment of SWEETR lines with the help of the SWEETR kit 1.0.
Farmers with Xoo-infected rice fields will send samples to local breeders or pathologists, who will isolate respective Xoo strains. Pathologists will then identify induced and critically important SWEET genes using SWEETup primers for mRNA accumulation and SWEET knock-out (SWEETKO) mutants. After validation with SWEET EBE-edited Kitaake lines (SWEETpR), pathologists will identify the optimal SWEETR line, which is then provided to local breeders. In parallel, labs will isolate Xoo DNA from infected leaves, identify TAL effectors (the TALeome) and predict SWEET targets using SWEETpDB. PathoTracer provides additional region-specific recommendations for deployment of SWEETR variants.

References

    1. Mew TW. Current status and future prospects of research on bacterial blight of rice. Annu. Rev. Phytopath. 1987;25:359–382.
    1. Ke Y, Deng H, Wang S. Advances in understanding broad-spectrum resistance to pathogens in rice. Plant J. 2017;90:738–748. - PubMed
    1. Government of India. State of Indian Agriculture 2015–16 (Ministry of Agriculture & Farmers Welfare, Cooperation & Farmers Welfare Directorate of Economics & Statistics Department of Agriculture, 2016).
    1. Laha, G. S. et al. Changes in Rice Disease Scenario in India: An Analysis from Production Oriented Survey (ICAR–Indian Institute of Rice Research, 2016).
    1. Duku C, Sparks AH, Zwart SJ. Spatial modelling of rice yield losses in Tanzania due to bacterial leaf blight and leaf blast in a changing climate. Clim. Change. 2016;135:569–583.

Publication types

MeSH terms

Substances

Supplementary concepts