

X-ray computed tomography for quality inspection of agricultural products: A review
- PMID: 31660129
- PMCID: PMC6804772
- DOI: 10.1002/fsn3.1179
X-ray computed tomography for quality inspection of agricultural products: A review
Abstract
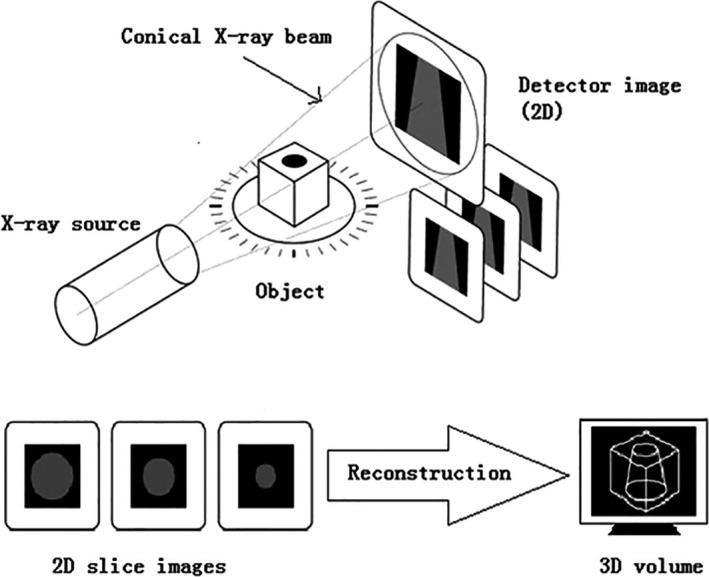
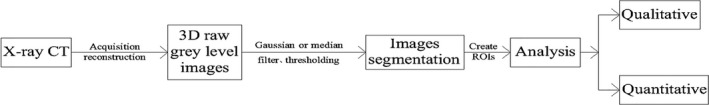
The quality of agricultural products relates to the internal structure, which has long been a matter of interest in agricultural scientists. However, inspection methods of the opaque nature of internal information on agricultural products are usually destructive and require sample separation or preparation. X-ray computed tomography (X-ray CT) technology is one of the important nondestructive testing (NDT) technologies without sample separation and preparation. In this study, X-ray CT technology is used to obtain two-dimensional slice images and three-dimensional tomographic images of samples. The purpose of the review was to provide an overview of the working principle of X-ray CT technology, image processing, and analysis. This review aims to focus on the development of the agricultural products (e.g., wheat, maize, rice, apple, beef) and its applications (e.g., internal quality evaluation, microstructure observation, mechanical property measurement, and others) using CT scanner. This paper covers the aspects regarding the advantages and disadvantages of NDT technology, especially the unique advantages and limitations of X-ray CT technology on the quality inspection of agricultural products. Future prospects of X-ray CT technology are also put forward to become indispensable to the quality evaluation and product development on agricultural products.
Keywords: agricultural products; computed tomography; nondestructive; quality inspection.
© 2019 The Authors. Food Science & Nutrition published by Wiley Periodicals, Inc.
Conflict of interest statement
The authors declare that they do not have any conflict of interest.
Figures
References
-
- Aguilera, J. M. (2005). Why food microstructure? Journal of Food Engineering, 67, 3–11. 10.1016/j.jfoodeng.2004.05.050 - DOI
-
- Anonymous . (2010, December 10). History of radiography. Retrieved from http://www.ndted.org/EducationResources/CommunityCollege/Radiography/Int...
-
- Arendse, E. , Fawole, O. A. , Magwaza, L. S. , & Opara, U. L. (2016). Non‐destructive characterization and volume estimation of pomegranate fruit external and internal morphological fractions using X‐ray computed tomography. Journal of Food Engineering, 186, 42–49. 10.1016/j.jfoodeng.2016.04.011 - DOI
-
- Baker, D. R. , Mancini, L. , Polacci, M. , Higgins, M. D. , Gualda, G. A. R. , Hill, R. J. , & Rivers, M. L. (2012). An introduction to the application of X‐ray microtomography to the three‐dimensional study of igneous rocks. Lithos, 148, 262–276. 10.1016/j.lithos.2012.06.008 - DOI
Publication types
LinkOut - more resources
Full Text Sources
