. 2020 Feb;86(2):303-317.
doi: 10.1111/bcp.14144. Epub 2020 Jan 7.

Population pharmacokinetics of vancomycin in obesity: Finding the optimal dose for (morbidly) obese individuals

Affiliations

Population pharmacokinetics of vancomycin in obesity: Finding the optimal dose for (morbidly) obese individuals

Cornelis Smit et al. Br J Clin Pharmacol. 2020 Feb.

Abstract

Aims: For vancomycin treatment in obese patients, there is no consensus on the optimal dose that will lead to the pharmacodynamic target (area under the curve 400-700 mg h L-1 ). This prospective study quantifies vancomycin pharmacokinetics in morbidly obese and nonobese individuals, in order to guide vancomycin dosing in the obese.

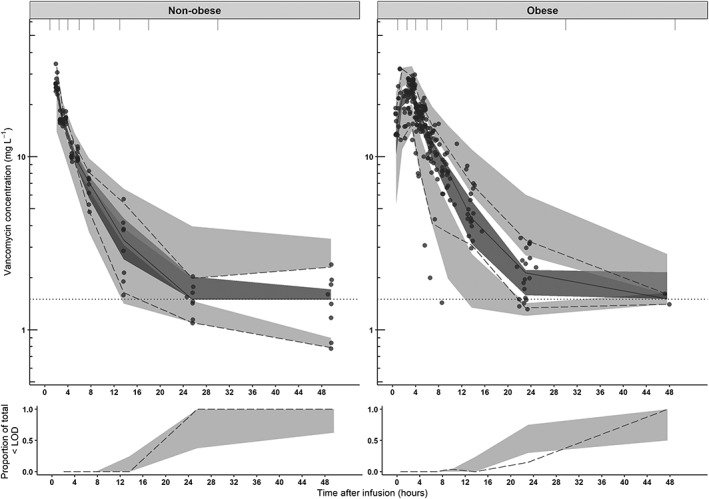
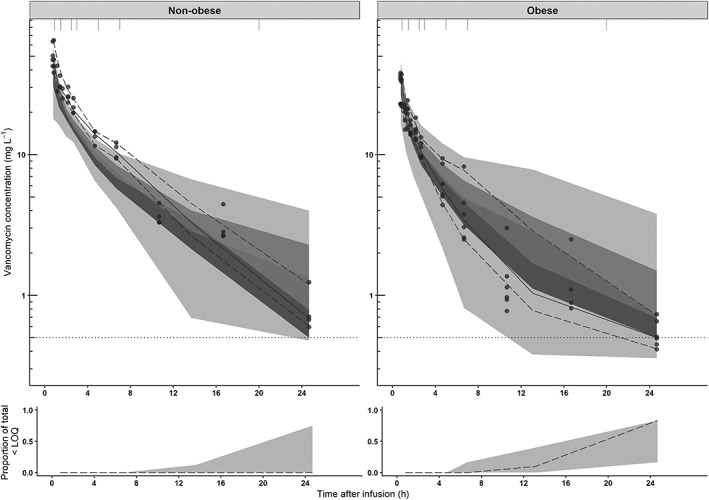
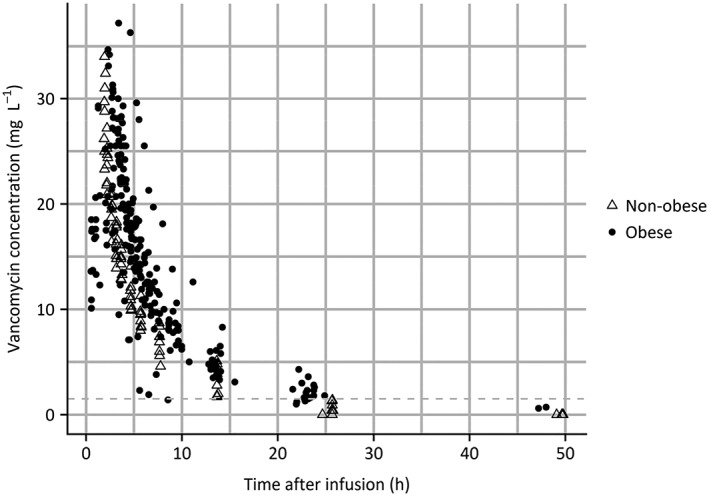
Methods: Morbidly obese individuals (n = 20) undergoing bariatric surgery and nonobese healthy volunteers (n = 8; total body weight [TBW] 60.0-234.6 kg) received a single vancomycin dose (obese: 12.5 mg kg-1 , maximum 2500 mg; nonobese: 1000 mg) with plasma concentrations measured over 48 h (11-13 samples per individual). Modelling, internal validation, external validation using previously published data and simulations (n = 10.000 individuals, TBW 60-230 kg) were performed using NONMEM.

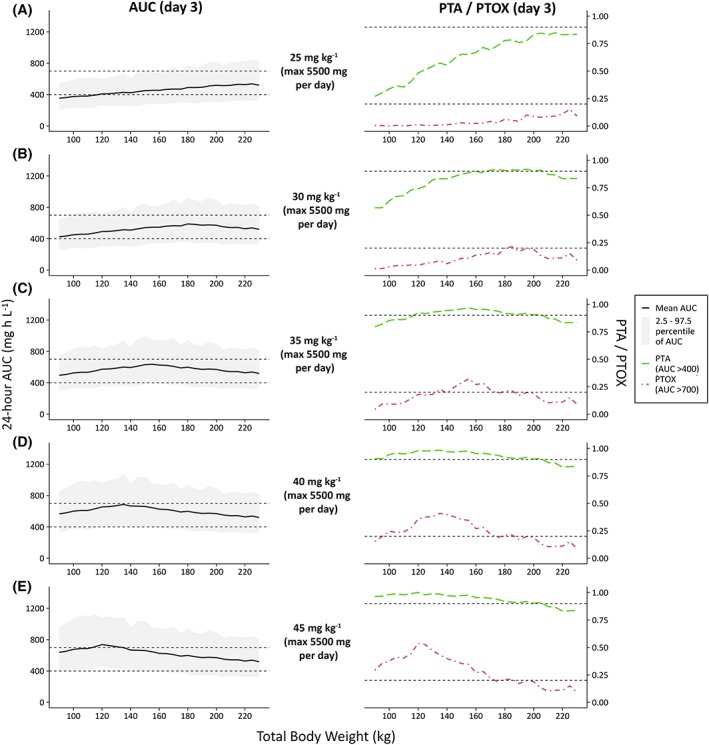
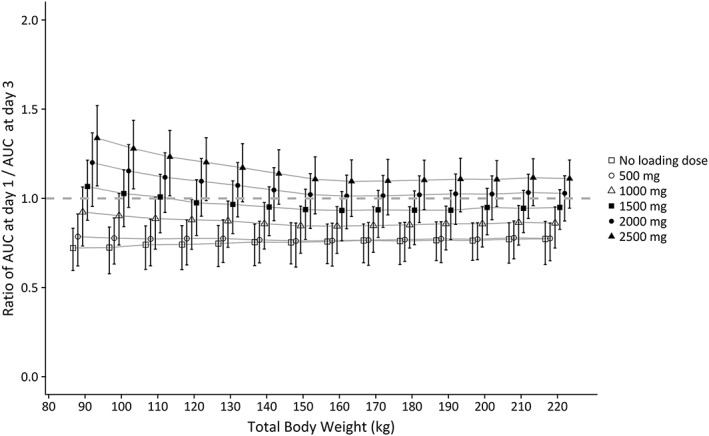
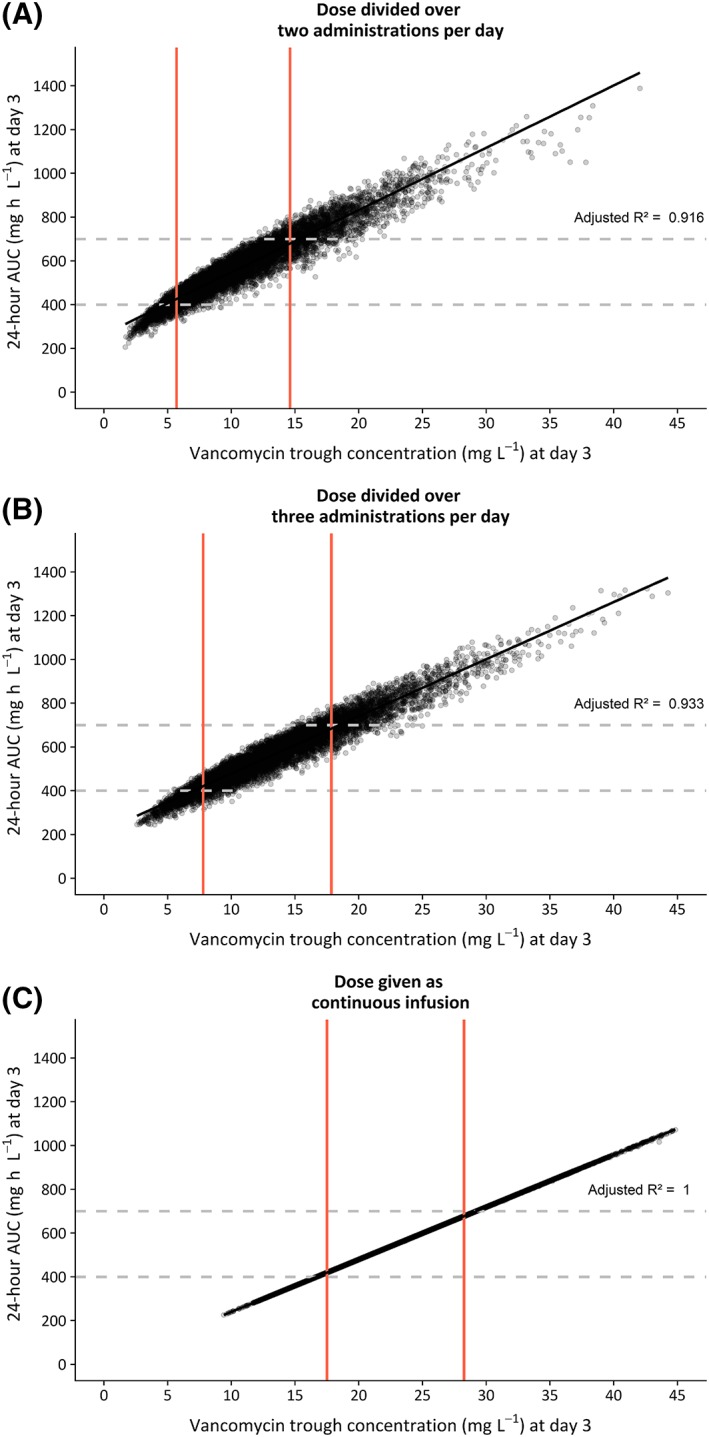
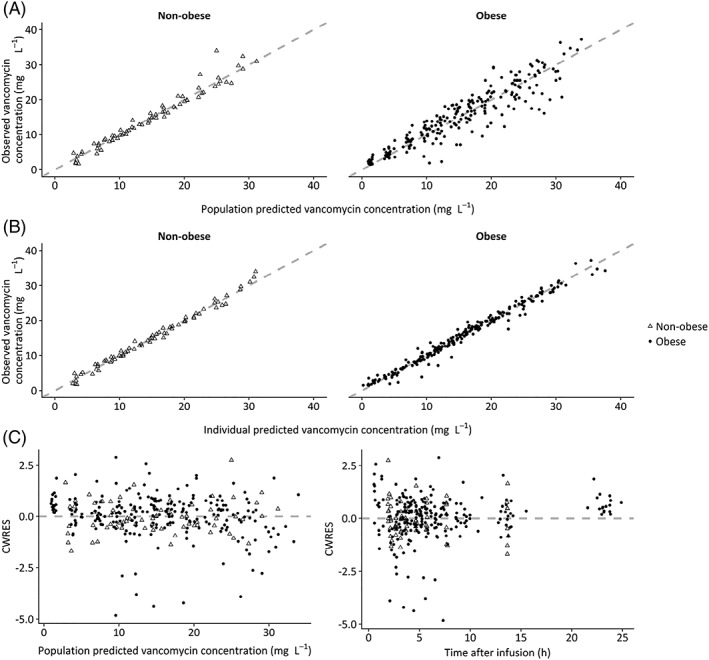
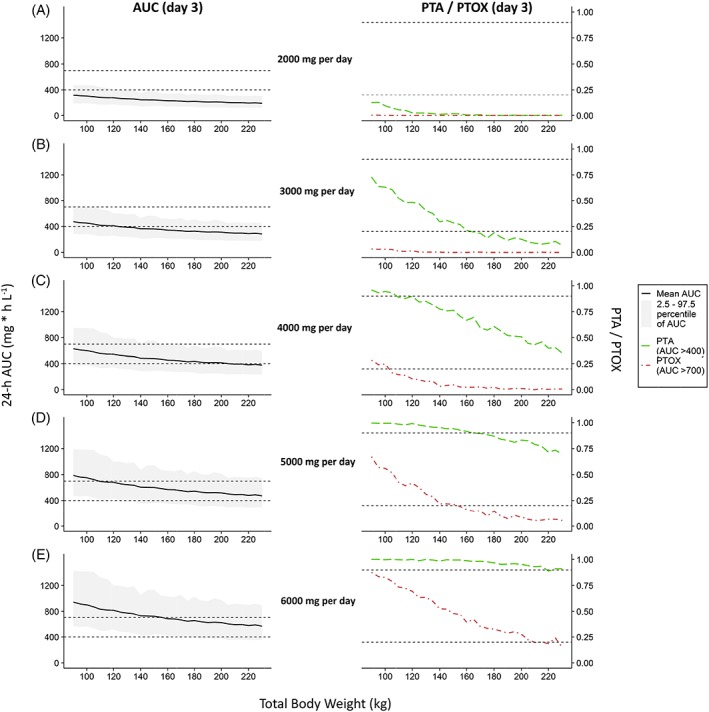
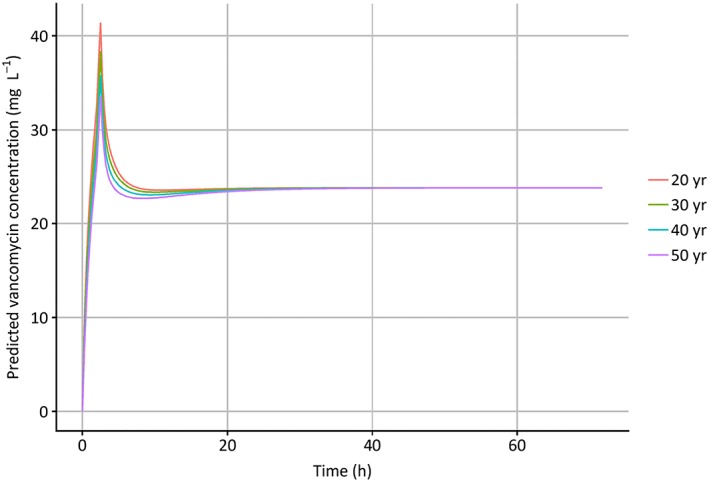
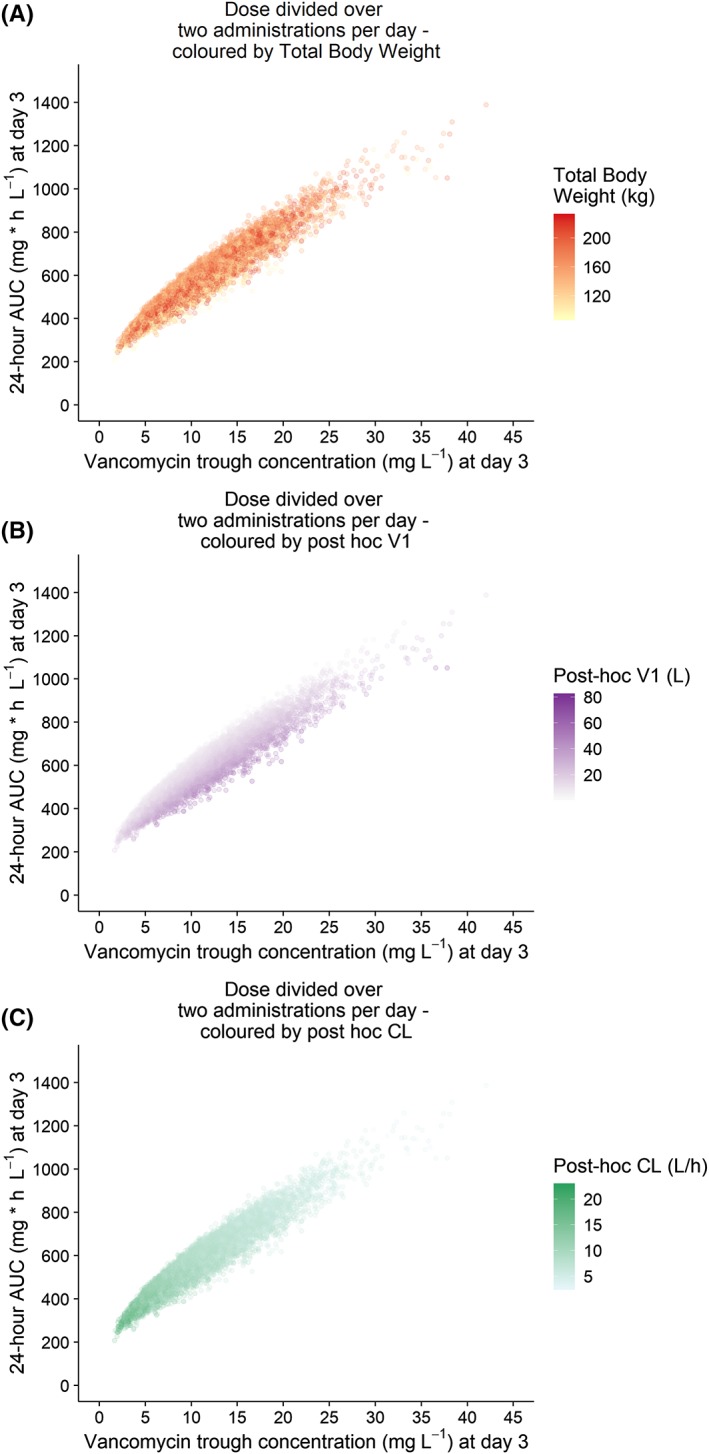
Results: In a 3-compartment model, peripheral volume of distribution and clearance increased with TBW (both p < 0.001), which was confirmed in the external validation. A dose of 35 mg kg-1 day-1 (maximum 5500 mg/day) resulted in a > 90% target attainment (area under the curve > 400 mg h L-1 ) in individuals up to 200 kg, with corresponding trough concentrations of 5.7-14.6 mg L-1 (twice daily dosing). For continuous infusion, a loading dose of 1500 mg is required for steady state on day 1.

Conclusion: In this prospective, rich sampling pharmacokinetic study, vancomycin clearance was well predicted using TBW. We recommend that in obese individuals without renal impairment, vancomycin should be dosed as 35 mg kg-1 day-1 (maximized at 5500 mg/day). When given over 2 daily doses, trough concentrations of 5.7-14.6 mg L-1 correspond to the target exposure in obese individuals.

Keywords: glycopeptides; morbid obesity; obesity; pharmacokinetics; pharmacology; vancomycin.


Figures

Figure 1
Figure 1
Prediction‐corrected visual predictive checks (pcVPC) of the final model split for nonobese (upper left panel) and obese (upper right panel) subgroups of the current study. The observed concentrations are shown as black circles, median, 2.5th and 97.5th percentiles of the observed data are shown as solid, lower and upper dashed lines. Grey shaded areas represent the 95% confidence intervals of the median (dark grey) and 2.5th and 97.5th percentiles (light grey) of simulated concentrations (n = 1000) based on the original dataset. The lower limit of detection (LOD) is depicted by the dotted grey line. Intervals of the bins are shown by the vertical ticks on the top of the plot. Lower panels show the observed proportion below the LOD (dashed line), where shaded areas represent the 95% confidence intervals based on simulated concentrations (n = 1000)
Figure 2
Figure 2
Prediction‐corrected visual predictive checks (pcVPC) of the final model split for nonobese (upper left panel) and obese (upper right panel) subgroups for the external dataset published by Blouin et al.21 The observed concentrations from the Blouin study are shown as black circles, median, 2.5th and 97.5th percentiles of the observed data are shown as solid, lower and upper dashed lines. Grey shaded areas represent the 95% confidence intervals of the median (dark grey) and 2.5th and 97.5th percentiles (light grey) of simulated concentrations (n = 1000) based on the original dataset. The lower limit of quantification (LOQ) is depicted by the dotted grey line. Intervals of the bins are shown by the vertical ticks on the top of the plot. Intervals of the bins are shown by the vertical ticks on the top of the plot. Lower panels show the observed proportion below the LOQ (dashed line), where shaded areas represent the 95% confidence intervals based on simulated concentrations (n = 1000)
Figure 3
Figure 3
Twenty‐four‐hour area under the curve (AUC) values at day 3 (left column) and probability of target attainment (PTA, AUC24h > 400) or toxicity (PTOX, AUC24h > 700) (right column), shown vs weight (90–230 kg) for several dose regimens (n = 10 000 per dose regimen). (A–E) Increasing dose regimens from 25 mg kg−1 day−1 to 45 mg kg−1 day−1, all maximized at 5500 mg day−1. In the left plots, the solid black line and grey area indicate mean observed AUC with 2.5–97.5 percentiles. Dashed grey line represents target AUC levels (400 and 700 mg h L−1). In the right plots, the dashed green line and dot‐dashed red line indicate PTA and PTOX, respectively. Dashed grey lines represent the threshold for PTA (0.9) and, for reference, 20% PTOX (0.2). AUC, 24 h area under the curve at day 3; PTA, probability of target attainment (AUC > 400 mg h L−1) at day 3; PTOX, probability of toxicity (AUC > 700 mg h L−1) at day 3
Figure 4
Figure 4
Mean ratio of AUC24h at day 1/AUC24h at day 3 with 95% confidence intervals, shown for different loading doses vs body weight (90–230 kg), based on Monte Carlo simulations (n = 10 000 per loading dose). Each line represents 1 loading dose regimen. All individuals received 35 mg kg−1 continuous infusion started 2 h after the loading dose (maximised at 5500 mg day−1). Grey dashed line represents a ratio of 1.AUC, 24‐h area under the curve
Figure 5
Figure 5
Twenty‐four‐hour area under the curve (AUC24h) at day 3 vs individual trough concentrations at day 3 (measured 0,5 h prior to the second dose) based on Monte Carlo simulation in obese patients (n = 10 000, weight ranging 90–230 kg), using the final model. Vancomycin dose was 35 mg kg−1 day−1, maximized at 5500 mg day−1, given over 2 infusions day−1 (A), 3 infusions day−1 (B) or as a continuous infusion regimen (C). Each dot represents 1 simulated individual. Dashed horizontal lines show the target AUC window (400–700 mg h L−1). Trough concentrations corresponding to 95% of AUC24h within this target are shown with red vertical lines. The black line represents the linear regression line, with corresponding adjusted R2 value shown in the graph
Figure A1
Figure A1
Measured vancomycin concentration vs time after infusion
Figure A2
Figure A2
Goodness‐of‐fit plots of the final pharmacokinetic model for nonobese individuals
Figure A3
Figure A3
Simulation based comparison of 24‐h area under the curve (AUC) values at day 3 and probability of target attainment (PTA) or toxicity (PTOX) for fixed dose regimens
Figure A4
Figure A4
Predicted vancomycin concentration when administered to 4 individuals with a weight of 130 kg and varying age (20–50 years) after administration of a 1500 mg vancomycin dose (infusion rate 10 mg min−1) followed after 2 h by a continuous infusion of 35 mg kg−1 day−1
Figure A5
Figure A5
Twenty‐four‐hour area under the curve (AUC24h) at day 3 vs individual trough concentrations at day 3 based on Monte Carlo simulation in obese patients, using the final model, coloured by individual body weight, volume of distribution (V1) and clearance (CL)

Similar articles

Cited by

References

    1. Flegal KM, Kruszon‐Moran D, Carroll MD, Fryar CD, Ogden CL. Trends in obesity among adults in the United States, 2005 to 2014. JAMA. 2016;315(21):2284‐2291. - PMC - PubMed
    1. Falagas ME, Kompoti M. Obesity and infection. Lancet Infect Dis. 2006;6(7):438‐446. - PubMed
    1. Smit C, De Hoogd S, Brüggemann RJM, Knibbe CAJ. Obesity and drug pharmacology: a review of the influence of obesity on pharmacokinetic and pharmacodynamic parameters. Expert Opin Drug Metab Toxicol. 2018;14(3):275‐285. - PubMed
    1. Knibbe CAJ, Brill MJE, Van Rongen A, Diepstraten J, van der Graaf PH, Danhof M. Drug disposition in obesity: toward evidence‐based dosing. Annu Rev Pharmacol Toxicol. 2015;55(1):149‐167. - PubMed
    1. Purrello SM, Garau J, Giamarellos E, et al. Methicillin‐resistant Staphylococcus aureus infections: a review of the currently available treatment options. J Glob Antimicrob Resist. 2016;7:178‐186. - PubMed

Publication types