. 2020 Jan;598(1):151-170.
doi: 10.1113/JP279012. Epub 2019 Dec 21.

Hair cell maturation is differentially regulated along the tonotopic axis of the mammalian cochlea

Affiliations

Hair cell maturation is differentially regulated along the tonotopic axis of the mammalian cochlea

Jing-Yi Jeng et al. J Physiol. 2020 Jan.

Abstract

Key points: Outer hair cells (OHCs) enhance the sensitivity and the frequency tuning of the mammalian cochlea. Similar to the primary sensory receptor, the inner hair cells (IHCs), the mature functional characteristics of OHCs are acquired before hearing onset. We found that OHCs, like IHCs, fire spontaneous Ca2+ -induced action potentials (APs) during immature stages of development, which are driven by CaV 1.3 Ca2+ channels. We also showed that the development of low- and high-frequency hair cells is differentially regulated during pre-hearing stages, with the former cells being more strongly dependent on experience-independent Ca2+ action potential activity.

Abstract: Sound amplification within the mammalian cochlea depends upon specialized hair cells, the outer hair cells (OHCs), which possess both sensory and motile capabilities. In various altricial rodents, OHCs become functionally competent from around postnatal day 7 (P7), before the primary sensory inner hair cells (IHCs), which become competent at about the onset of hearing (P12). The mechanisms responsible for the maturation of OHCs and their synaptic specialization remain poorly understood. We report that spontaneous Ca2+ activity in the immature cochlea, which is generated by CaV 1.3 Ca2+ channels, differentially regulates the maturation of hair cells along the cochlea. Under near-physiological recording conditions we found that, similar to IHCs, immature OHCs elicited spontaneous Ca2+ action potentials (APs), but only during the first few postnatal days. Genetic ablation of these APs in vivo, using CaV 1.3-/- mice, prevented the normal developmental acquisition of mature-like basolateral membrane currents in low-frequency (apical) hair cells, such as IK,n (carried by KCNQ4 channels), ISK2 and IACh (α9α10nAChRs) in OHCs and IK,n and IK,f (BK channels) in IHCs. Electromotility and prestin expression in OHCs were normal in CaV 1.3-/- mice. The maturation of high-frequency (basal) hair cells was also affected in CaV 1.3-/- mice, but to a much lesser extent than apical cells. However, a characteristic feature in CaV 1.3-/- mice was the reduced hair cell size irrespective of their cochlear location. We conclude that the development of low- and high-frequency hair cells is differentially regulated during development, with apical cells being more strongly dependent on experience-independent Ca2+ APs.

Keywords: action potentials; auditory; calcium signals; cochlea; development; hair cells.


Figures

Figure 1
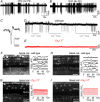
Figure 1. Early postnatal OHCs show spontaneous Ca2+‐induced action potentials
A and B, spontaneous inward currents recorded from P2 apical coil (Ac) and P0 basal coil (Bc) OHCs, respectively, using cell‐attached voltage clamp at body temperature (∼35°C). Recordings were performed using physiological 1.3 mm extracellular Ca2+. C, expanded view of a single spontaneous current from panel A. D, cell‐attached recordings of inward currents from a P3 apical OHC during the repeated application of a Ca2+‐free solution containing 0.5 mm EGTA, a condition that abolishes APs (Johnson et al. 2011b). E, example of cell‐attached recording from a basal‐coil OHC of a P1 CaV1.3 −/− mouse with no spontaneous currents. FI, representative ΔF/F 0 traces from 7 apical (F and G) and basal (H and I) OHCs each of a P2 wild‐type (F and H) and a P1 CaV1.3−/− (G and I) mouse. Traces are computed as pixel averages of regions of interest (white squares) centred on OHCs (Ceriani et al. 2019). Scale bars: 20 µm.
Figure 2
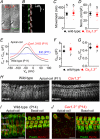
Figure 2. The number and size of pre‐hearing OHCs is normal in CaV1.3/ mice
A and B, DIC images of a region of the mouse cochlear apical coil (∼8–12 kHz) showing the presence of IHCs and OHCs at P10 and P12 for wild‐type (left top panels) and CaV1.3−/− (right top panels) mice. Note that the hair bundles of IHCs are also visible. The presence of normal hair bundles in OHCs is shown in the bottom panels. C, DIC images from a wild‐type (left) and CaV1.3−/− (right) mice, as described in panels A and B, but from a cochlea just after hearing onset (P13). Note that OHCs began to disappear in CaV1.3−/− mice. D, number of OHCs present in a 200 µm region from the apical and basal coil of wild‐type and CaV1.3−/− mice as a function of postnatal development. Numbers of cochleae tested at the various ages from left to right are: wild‐type apical 6, 7, 6, 6; CaV1.3−/− apical 4, 6, 7, 5. * P < 0.0001; wild‐type basal 3, 3; CaV1.3−/− basal 4, 4. E, membrane capacitance (C m) measured from apical OHCs of wild‐type and CaV1.3−/− mice during development. Numbers of OHCs measured: wild‐type 3, 6, 5, 0, 2, 9, 23, 4; CaV1.3−/− 4, 4, 5, 7, 1, 2, 10, 14. * P<0.0001. F, resting membrane potential (V m) of wild‐type and CaV1.3−/− OHCs during development. * P = 0.0013. Numbers of OHCs measured: wild‐type 3, 4, 2, 4, 8, 6, 4; CaV1.3−/− 3, 2, 2, 4, 3, 7. P11 data points are from Ceriani et al. 2019.
Figure 3
Figure 3. The Ca2+ binding protein oncomodulin is present in OHCs from wild‐type and CaV1.3/ mice
Confocal images taken from apical and basal coil OHCs of wild‐type (left panel) and CaV1.3−/− (right panel) mice at P11, which is after their onset of functional maturation at P8, but just before the onset of hearing (P12). Similar staining was seen in additional 4 mice for each genotype. Scale bar: 10 µm.
Figure 4
Figure 4. Acquisition of I K,n in developing OHCs
AE, typical current responses from E15.5, E18.5, P4 and P7 OHCs recorded from wild‐type mice. Note that most of the examples are from basal‐coil OHCs apart from the recordings in panel C (see panel F below for details). Also note that the y‐axis in panel D covers a larger current range than that in all the other panels (AC and E). Outward current was elicited by using depolarizing and hyperpolarizing voltage steps (10 mV increments) from –84 mV to the various test potentials shown by some of the traces. F, size of the total outward K+ current measured at 0 mV as a function of embryonic and early postnatal ages for OHCs positioned in the apical and basal cochlear region (including those shown in panels A–E). Note that the onset of I K,n occurs about 2 days earlier in basal OHCs. Numbers of basal OHCs measured at the various ages (E15.5–P8) are from left to right: 3, 4, 5, 3, 3, 4, 27, 15, 13, 3, 7, 4, 1; apical OHCs (E16.5–E18.5) 5, 4, 4 and (P0–P11) are from Marcotti & Kros (1999). Fits to the data are according to a sigmoidal logistic growth curve: A=Amin+(AmaxAmin)1+exp(k(tthalf)), where A is the size of the current, k is a slope factor and t half is the age where A is halfway between the maximal (A max) and minimal (A min) currents. t half was 2.2 days in basal and 3.8 days in apical OHCs.
Figure 5
Figure 5. The expression of the mature K+ current profile is impaired in CaV1.3 −/− OHCs
AC, current responses in wild‐type (left) and CaV1.3−/− (right) apical‐coil OHCs during immature stages (A, P1), at the onset of function when I K,n is first detected (B, P8: Marcotti & Kros, 1999) and at a more mature age when I K,n has almost reached its mature size in mice (C, P12: Marcotti & Kros, 1999). Note that even at P12 I K,n is very small and possibly contaminated by the inward rectifier I K1. D, size of the isolated I K,n as a function of postnatal age in wild‐type and CaV1.3−/− apical OHCs (measured as the deactivating tail currents at −124 mV from the holding potential of −84 mV). Numbers of cells from left to right: wild‐type: 3, 7, 5, 7, 0, 3, 15, 4; CaV1.3−/− 4, 4, 4, 7, 3, 2, 12, 11. Two‐way ANOVA with Bonferroni's post hoc test: * P = 0.0192 (P8); ** P = 0.0022 (P9), *** P < 0.0001 (at P11, P12 and P13). E, total steady‐state outward I K as a function of age in wild‐type and CaV1.3−/− OHCs (measured at 0 mV from the holding potential of −84 mV). *** P = 0.0002 (at P12 and P13). Number of OHCs investigated as in panel D. F and G, maximum intensity projections of confocal z‐stack images that were taken from apical (upper panels) and basal (lower panels) coil OHCs (P11) in wild‐type (F) and CaV1.3−/− (G) mice. Immunostaining for KCNQ4 is shown in white (arrows) and Myo7a is used as a cell marker (blue). Similar staining was seen in an additional 4 mice for each genotype. Scale bar: 10 µm.
Figure 6
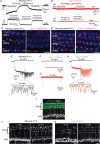
Figure 6. Prestin expression and electromotility are normal in OHCs from CaV1.3 −/− mice
A, images showing the patch pipette attached to an apical‐coil OHC from a CaV1.3−/− mouse at P12. The red lines indicate the position of the OHC basal membrane before (left: at –84 mV) and during a depolarizing voltage step from –84 mV to +36 mV (right). Note that membrane depolarization causes OHCs to shorten. Scale bar, 5 µm. B, kymograph showing the movement of the subnuclear region of the OHC shown in panel A as a function of time in response to the repetitive voltage steps described above. The red line indicates the resting position of the OHC basal membrane and the green line indicates the shortening. C and D, average movement in response to the depolarizing voltage step was not significantly different between wild‐type and CaV1.3−/− apical‐coil OHCs (C, P = 0.79), even after normalization to the average OHC membrane capacitance (D, P = 0.68). E, examples of voltage‐dependent non‐linear capacitance (C N‐L) recorded in apical‐coil hair cells by applying a voltage ramp from –154 mV to +96 mV over 2 s. Note that the cell membrane capacitance (C m) was added to the measured C N‐L. C N‐L was present in the OHCs from both genotypes, but absent in the IHC. F and G, average C N‐L was not significantly different between wild‐type and CaV1.3−/− apical‐coil OHCs (F), even after normalization to the individual OHC membrane capacitance C m (G). C N‐L was calculated as the difference between the peak of the recording near −40 mV and the lowest value at positive membrane potentials. Recordings in A–G are at room temperature. Number of cells investigated is shown near the columns. H, maximum intensity projections of confocal z‐stacks taken from the apical cochlear region of wild‐type (left) and CaV1.3−/− (right) mice at P11 using antibodies against prestin (white). I and J, images obtained as in H, but from the apical (left panels) and basal (right panels) cochlear of wild‐type (I) and CaV1.3−/− (J) post‐hearing mice (P14). The hair‐cell marker Myo7a (red) was used to better identify the synaptic, basal portion of OHCs that does not contain prestin (green); this was more evident in basal OHCs. Note that the different angle of the basal OHCs gives the incorrect impression that wild‐type OHCs are smaller than those in the CaV1.3−/− mice. Prestin labelling was also present in the few remaining OHCs of CaV1.3−/− mice (J, left panel). Scale bars in H–J: 10 µm.
Figure 7
Figure 7. Cholinergic efferent synapses are differentially affected in apical and basal OHCs of CaV1.3/ mice
A, inward (top) and outward (bottom) currents in wild‐type apical‐coil OHCs elicited during the extracellular application of 100 µM extracellular ACh at –90 mV and –40 mV, respectively. Note that at –90 mV the current was reversibly blocked by 1 µM strychnine, indicating the direct involvement of α9α10‐nAChRs; at –40 mV, the outward current was prevented by the absence of Ca2+ in the extracellular solution, indicating the presence of SK2 channels. B, same experiments as in panel A but performed in apical‐coil OHCs from CaV1.3−/− mice. Note that ACh produced very little or no responses at both potentials. C and D, maximum intensity projections of confocal z‐stack images that were taken from mature P11 apical (C) and basal coil (D) of wild‐type and CaV1.3−/− mice. Immunostaining for SK2 channels (green) and ChAT, which is used to visualize the efferent olivocochlear innervation of OHCs (red); Myo7a (blue) was used as the hair‐cell marker. Scale bars: 10 µm. E–H, whole‐cell voltage‐clamp recordings obtained from mature OHCs in wild‐type (E) and CaV1.3−/− (F–H) mice during the superfusion of 40 mm extracellular K+. Lower panels in E and H show an expanded time scale of the area shown in the panels above. IK, maximum intensity projections of confocal z‐stack images taken at two different frequencies along the cochlea (apical: 8 kHz; basal: 32 kHz) from P11 wild‐type (J) and CaV1.3−/− mice (K). Immunostaining for the OHC marker prestin (I: green) and ChAT (I: white), which is used to visualize the efferent terminals and fibres below the IHCs, tunnel crossing fibres (arrows), and terminals below the OHCs. In the cochlear apical coil of CaV1.3−/− mice (K) there were fewer ChAT‐labelled tunnel crossing fibres and OHC terminals than wild‐type mice (J). The ChAT‐labelled OHC terminals at 8 kHz were also disordered and larger than in the wild type. In the basal coil, the efferent innervation was visually comparable between the two genotypes. Scale bars: 10 µm.
Figure 8
Figure 8. DPOAE, but not ABR, thresholds are still present in the high‐frequency region of CaV1.3‐/ mice
A and B, auditory brainstem responses (ABRs) for click (A) and tone burst stimuli (B) in P16–P18 wild‐type (circles) and P16–P22 CaV1.3−/− mice (triangles) as a function of frequency position along the cochlea (3, 6, 12, 18, 24, 30, 36, 42 kHz). CaV1.3−/− mice were profoundly deaf at all cochlear frequencies tested. C, DPOAE thresholds (6, 12, 18, 24 kHz) from P16–P18 wild‐type and P16–P22 CaV1.3−/− mice. Data are means ± SD.
Figure 9
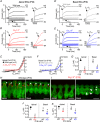
Figure 9. Potassium current expressed in post‐hearing IHCs of CaV1.3/ mutant mice
A and B, potassium currents recorded from P18 IHCs of the apical‐coil of the cochlea of wild‐type (A) and CaV1.3−/− mutant mice (B) using 10 mV depolarizing voltage steps from –64 mV to the various test potentials shown by some of the traces. The adult‐type currents (I K,f and I K,n) were only present in IHCs from wild‐type mice (A). IHCs from CaV1.3−/− mice retained the delayed rectifier current (B, I K) characteristic of immature cells (Marcotti et al. 2003a). The absence of the rapidly activating I K,f in CaV1.3−/− IHCs is also evident when comparing the activation time course of the total outward currents on an expanded time scale (see insets). C, average current‐voltage (I‐V) curves obtained from apical P18 IHCs of wild‐type and CaV1.3−/− mice. D and E, potassium currents recorded from P18 IHCs of the basal‐coil of the cochlea of wild‐type (D) and CaV1.3−/− mice (E) as described in panels A and B. Different from apical IHCs of CaV1.3−/− mice (B), basal cells retain I K,n and some I K,f (E). F, average current‐voltage curves obtained from P18 basal IHCs of wild‐type and CaV1.3−/− mice. G, average size of I K,f recorded from apical and basal IHCs of both genotypes. The isolated I K,f was measured as previously described (Marcotti et al. 2003a: current measured at 1.5 ms from the current onset and at the membrane potential of −25 mV). H and I, maximum intensity projections of confocal z‐stack images of IHCs taken from mature P18 wild‐type (H) and CaV1.3−/− mice (I) of both apical (left panels) and basal (right panel) coil of the cochlea. Immunostaining for BK channels (arrowheads) and Myo7a (IHC marker), which is used to visualize the IHCs. Note that BK puncta in IHCs from CaV1.3−/− mice were either absent in apical (I, left panel) or very few in basal cells (I, arrows in right panel). Scale bars: 10 µm. J, average size of I K,n recorded from apical and basal IHCs of both genotypes. The isolated I K,n was measured as previously described (Marcotti et al. 2003a: difference between the peak and steady‐state deactivating tail current at the membrane potential of −124 mV). K, average IHC membrane capacitance (C m) in both genotypes and as a function of cochlear position. In panels G, J and K, single cell value recordings (open symbols) are also plotted behind the average closed symbols. *Statistical significance (see Results).
Figure 10
Figure 10. Residual Ca2+ current in IHCs of CaV1.3−/− mice
A and B, calcium currents recorded from apical (A) and basal (B) IHCs from P6 CaV1.3−/− mice. Currents were elicited by depolarizing voltage steps of 10 mV increments (100 ms in duration) starting from the holding potential of –84 mV. For clarity only some of the traces are shown. Actual test potentials, corrected for voltage drop across uncompensated R s, are shown next to the traces. Residual capacitative transients have been blanked. C, comparison of the peak I Ca in apical (circles) and basal (triangles) IHCs. D, same data as in panel C, but normalized to the IHC membrane capacitance (C m). Recordings were obtained near body temperature (34–37°C) and using 1.3 mm extracellular Ca2+.

Comment in

Similar articles

Cited by

References

    1. Abe T, Kakehata S, Kitani R, Maruya S, Navaratnam D, Santos‐Sacchi J & Shinkawa H (2007). Developmental expression of the outer hair cell motor prestin in the mouse. J Membr Biol 215, 49–56. - PMC - PubMed
    1. Ashmore J (2008). Cochlear outer hair cell motility. Physiol Rev 88, 173–210. - PubMed
    1. Ashmore JF (1987). A fast motile response in guinea‐pig outer hair cells: the cellular basis of the cochlear amplifier. J Physiol 388, 323–347. - PMC - PubMed
    1. Ballesteros A, Fenollar‐Ferrer C & Swartz KJ (2018). Structural relationship between the putative hair cell mechanotransduction channel TMC1 and TMEM16 proteins. Elife 7, e38433. - PMC - PubMed
    1. Beurg M, Safieddine S, Roux I, Bouleau Y, Petit C & Dulon D (2008). Calcium‐ and otoferlin‐dependent exocytosis by immature outer hair cells. J Neurosci 28, 1798–1803. - PMC - PubMed

Publication types

MeSH terms

Substances