. 2019 Nov:49:172-188.
doi: 10.1016/j.ebiom.2019.09.045. Epub 2019 Oct 26.

Tumor cells hijack enteric glia to activate colon cancer stem cells and stimulate tumorigenesis

Affiliations

Tumor cells hijack enteric glia to activate colon cancer stem cells and stimulate tumorigenesis

Simon Valès et al. EBioMedicine. 2019 Nov.

Erratum in

Abstract

Background: Colon cancer stem cells (CSCs), considered responsible for tumor initiation and cancer relapse, are constantly exposed to regulatory cues emanating from neighboring cells present in the tumor microenvironment. Among these cells are enteric glial cells (EGCs) that are potent regulators of the epithelium functions in a healthy intestine. However, whether EGCs impact CSC-driven tumorigenesis remains unknown.

Methods: Impact of human EGC primary cultures or a non-transformed EGC line on CSCs isolated from human primary colon adenocarcinomas or colon cancer cell lines with different p53, MMR system and stemness status was determined using murine xenograft models and 3D co-culture systems. Supernatants of patient-matched human primary colon adenocarcinomas and non-adjacent healthy mucosa were used to mimic tumor versus healthy mucosa secretomes and compare their effects on EGCs.

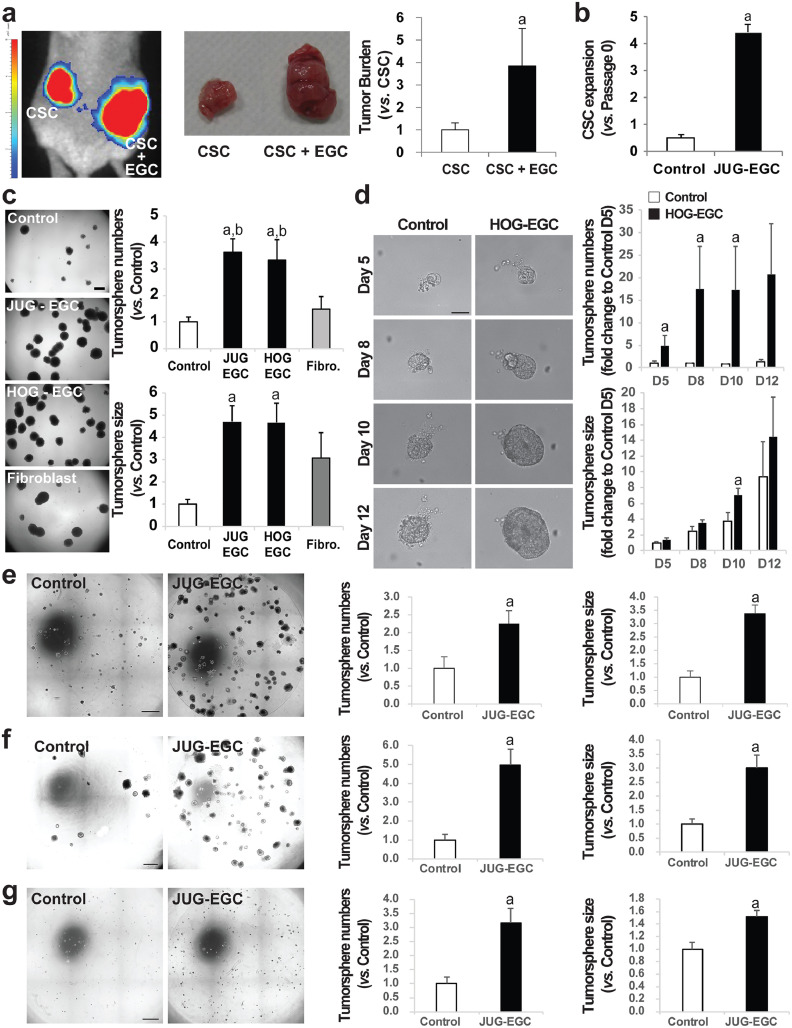
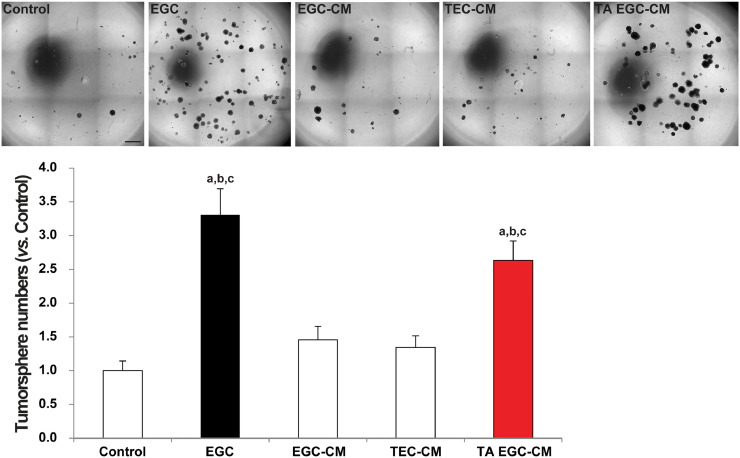
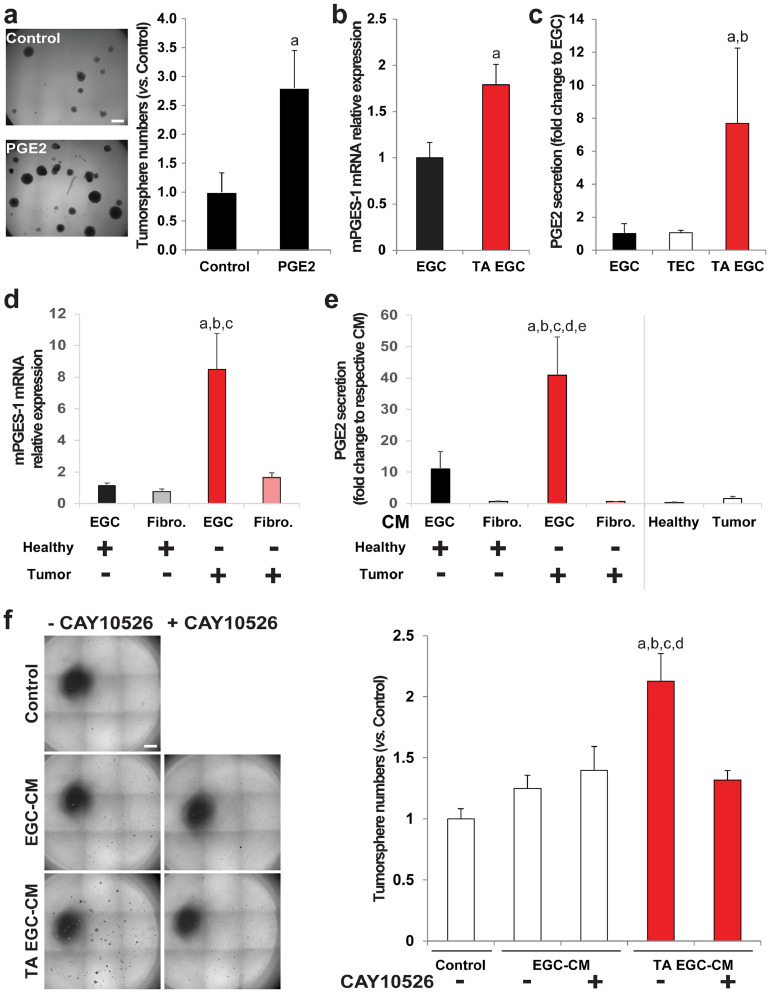
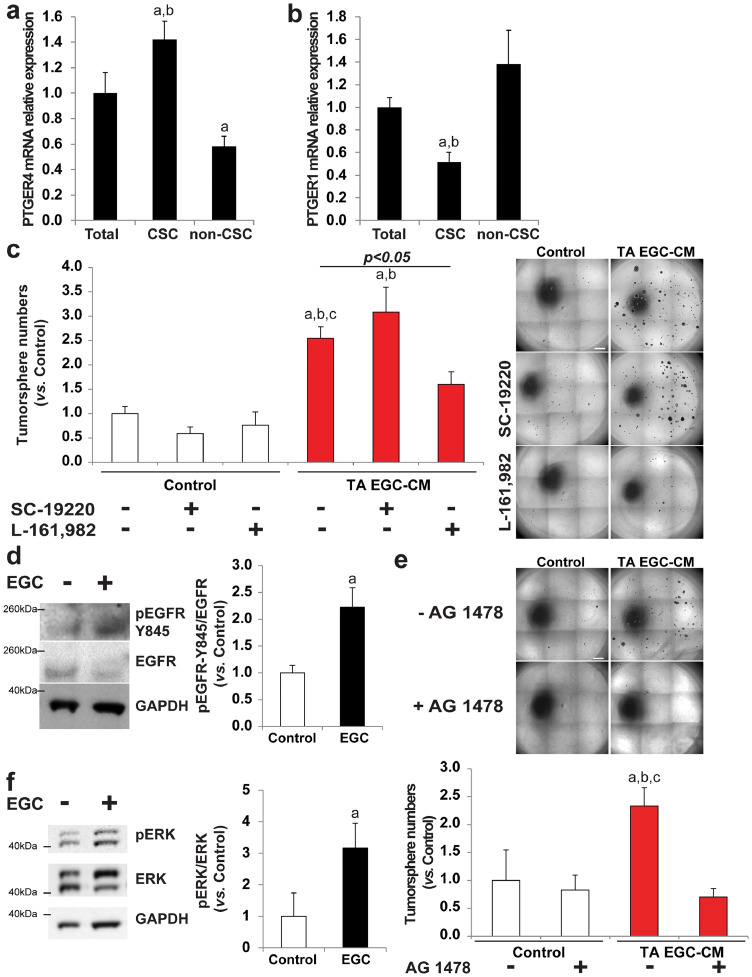
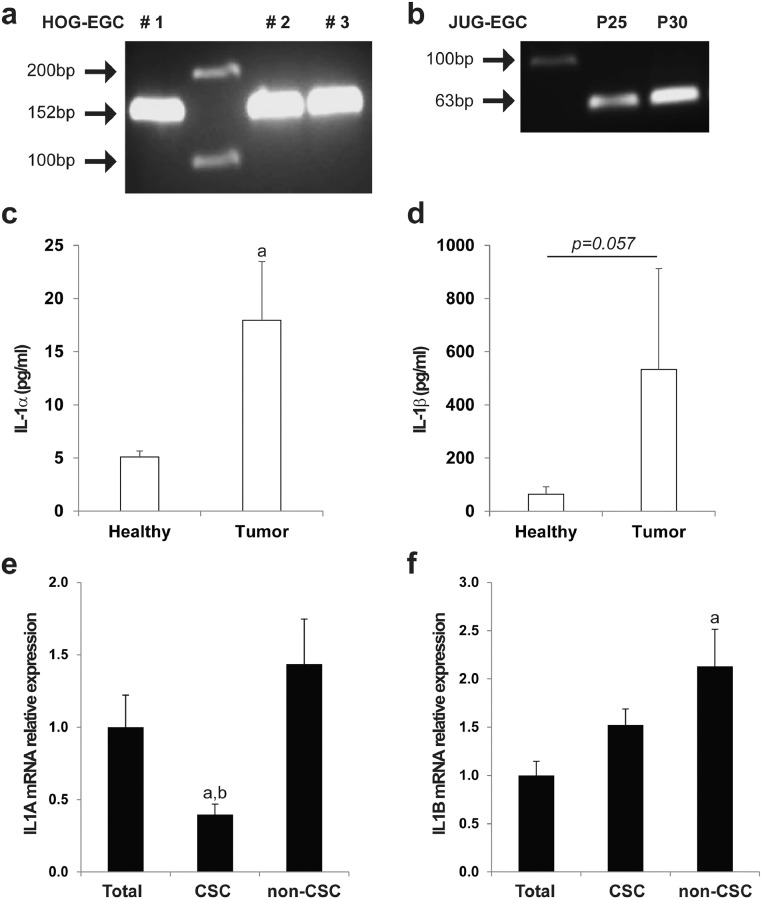
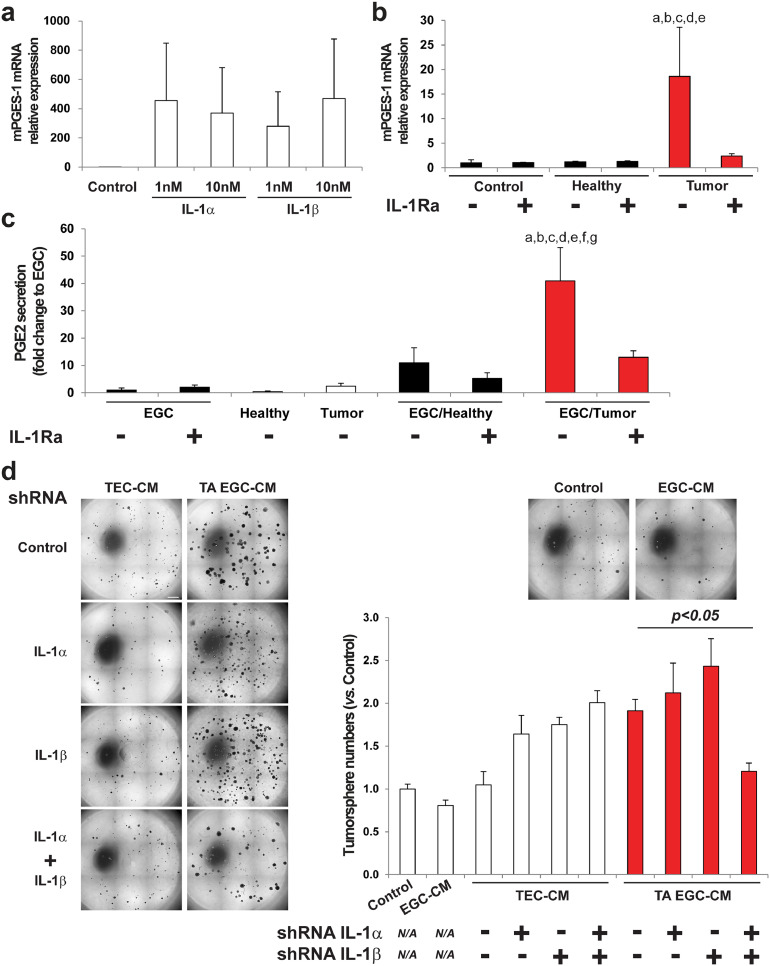
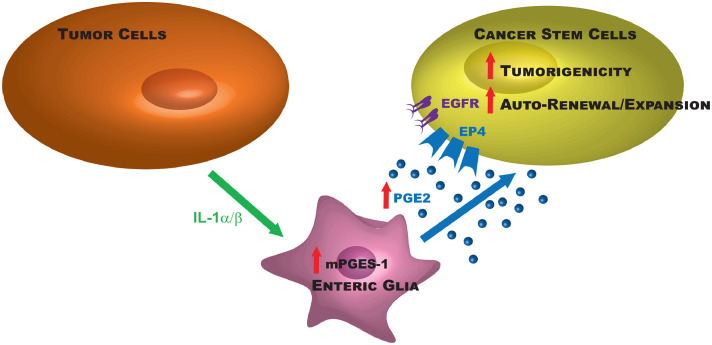
Findings: Our data show that EGCs stimulate CSC expansion and ability to give rise to tumors via paracrine signaling. Importantly, only EGCs that were pre-activated by tumor epithelial cell-derived soluble factors increased CSC tumorigenicity. Pharmacological inhibition of PGE2 biosynthesis in EGCs or IL-1 knockdown in tumor epithelial cells prevented EGC acquisition of a pro-tumorigenic phenotype. Inhibition of PGE2 receptor EP4 and EGFR in CSCs inhibited the effects of tumor-activated EGCs.

Interpretation: Altogether, our results show that EGCs, once activated by the tumor, acquire a pro-tumorigenic phenotype and stimulate CSC-driven tumorigenesis via a PGE2/EP4/EGFR-dependent pathway.

Funding: This work was supported by grants from the French National Cancer Institute, La Ligue contre le Cancer, the 'Région des Pays de la Loire' and the UNC Lineberger Comprehensive Cancer Center.

Keywords: Colon cancer stem cells; Colorectal cancer: Tumor microenvironment; Enteric glial cells; PGE2.


Conflict of interest statement

All the authors declare no potential conflict of interest.

Figures

Fig. 1:
Fig. 1
EGCs are part of the tumor microenvironment. a. 3D imaging of human colon adenocarcinoma using light sheet microscopy after clearing and staining for EpCAM (epithelial cell marker), S-100β (enteric glial cell marker) and PGP9.5 (pan-neuronal marker). Scale bar: 500 µm. b. Zoom-in of 1a (xy) and orthogonal projections centered on a cluster of neuronal and glial cell bodies indicated by quadrant (xz and yz). c. 3D imaging of human colon adenocarcinoma using light sheet microscopy after clearing and staining for EpCAM (epithelial cell marker), GFAP (enteric glial cell marker) and TH (marker of serotonin-producing neurons). Scale Bar: 500 µm. d. Zoom-in of 1c. A mask (grey) was created to isolate GFAP signal only where EpCAM signal is present (2 images on right side). e. Upper left panel shows xz maximal projection of the entire specimen. Upper right, lower right and lower left panels show respectively xz, xy and yz maximal projections of a 250 µm section inside the specimen (yellow rectangle in upper left panel). (EpCAM: white, GFAP: green). f. Other view of specimen shown in 1c (EpCAM: white, GFAP: green). g. 250 µm section of specimen shown in 1f (EpCAM: white, GFAP: green). h. Isolation (green mask) of GFAP-positive structure containing cell bodies and processes (green) overlaid with EpCAM staining (white) within the 250 µm section shown in 1 g. i/j. Views of isolated GFAP-positive structure containing cell bodies and processes (in green) overlaid with EpCAM staining (white) shown in full thickness specimen. (For interpretation of the references to color in this figure legend, the reader is referred to the web version of this article.)
Fig. 2:
Fig. 2
EGCs stimulate CSC-driven tumorigenesis. (ac.CSCs were isolated from the human HT29 cell line.)a.(left panel) Bioluminescence imaging of a representative mouse at 4 weeks after injection of luciferase-expressing CSCs alone (CSC) and a mix of CSCs + EGCs (CSC + EGC) at a 1:1 ratio in opposite flanks. (middle panel) Photographs of representative tumors at 6 weeks after injection of CSCs alone and a mix of CSCs + EGCs in opposite flanks. (right panel) Tumor burden corresponds to the tumor volume and is expressed as fold change relative to control (CSC) (mean ± SEM). n = 12; Mann and Whitney test, a: p < 0.01. b. Quantification of CSC expansion corresponds to [number of tumorspheres (Passage 1, P1) yielded from single cell suspension obtained from dissociation of P0 tumorspheres and cultured alone] / [initial number of tumorspheres (Passage 0, P0) yielded from CSCs cultured alone or in the presence of EGCs]. n = 5; Mann and Whitney test, a: p < 0.01. c.(left panel) Representative photographs of CSCs cultured alone (Control), in the presence of JUG-EGCs (non-transformed EGC line from rat embryo), HOG-EGCs (primary cultures of human EGC) or normal human fibroblasts (CCD18-Co). Scale Bar: 500 µm. Quantification of tumorsphere number (right, upper panel) and size (right, lower panel) is expressed as fold change relative to Control (mean ± SEM). n ≥ 3; ANOVA, Holm-Sidak multiple comparison test, a: p < 0.05 vs. Control, b: p < 0.05 vs. fibroblasts. d. Representative photographs (left panel) of tumorspheres derived from CSCs isolated from primary adenocarcinomas from colorectal cancer patients cultured alone (Control) or in the presence of primary cultures of human EGCs (HOG-EGC) from day 5 to day 12 post-plating illustrating that HOG-EGCs increased tumorsphere number (right, upper panel) and size (right, lower panel). n = 5; Mann and Whitney test, a: p < 0.05. Scale Bar: 20 µm. e-g. Representative photographs (left panel) of HCT116 (e), HCT15 (f) and SW1222 (g)-derived CSCs cultured alone (Control) or in the presence of EGCs (JUG-EGC) illustrating that EGCs increased tumorsphere number (middle panel) and size (right panel). n ≥ 4; Mann and Whitney test, a: p < 0.05. Scale Bar: 1 mm.
Fig. 3:
Fig. 3
Tumor epithelial cells activate EGCs to acquire pro-tumorigenic effects. Representative photographs and bar graph demonstrating that in contrast to the presence of EGCs on Transwell filters (EGC), EGC-conditioned medium (EGC-CM) did not impact CSC-derived tumorsphere yield. However, CM of tumor-activated EGCs (TA EGC-CM) induced a significant increase in tumorsphere numbers. CM of tumor epithelial cells (TEC-CM) had no effect. Quantification of tumorsphere number is expressed as fold change relative to Control (mean ± SEM). n ≥ 9; ANOVA, Holm-Sidak multiple comparison test, a: p < 0.05 vs. Control, b: p < 0.05 vs. EGC-CM, c: p < 0.05 vs. TEC-CM. Scale Bar: 1 mm.
Fig. 4:
Fig. 4
Tumor-activated EGCs stimulate CSC ability to give rise to tumorspheres via increased glial PGE2. a. (left panel) Photographs illustrating that PGE2 treatment (10 µM) increased the number of tumorspheres yielded from CSCs. Scale Bar: 500 µm. (right panel) Quantification is expressed as fold change to Control (mean ± SEM). n = 3; two tailed t-test, a: p < 0.05. b. RT-qPCR data showing that mPGES-1 gene expression was increased in tumor-activated EGCs (TA EGC) vs. control EGCs. n = 5; Mann and Whitney test, a: p < 0.01. c. PGE2 EIA analysis showed a significantly higher PGE2 concentration in TA EGC-CM vs.EGC-CM or TEC-CM. n ≥ 3; Kruskal-Wallis ANOVA, Dunn's multiple comparison test, a: p < 0.05 vs. EGC, b: p < 0.05 vs. TEC. d. Supernatant of human primary colon adenocarcinomas (Tumor) stimulated mPGES-1 gene expression in EGCs, but not in fibroblasts (CCD18Co), compared to supernatant of patient-matched healthy colon mucosa. n ≥ 4; ANOVA, Holm-Sidak multiple comparison test, a: p < 0.05 vs. EGC/Healthy, b: p < 0.05 vs. Fibro./Healthy, c: p < 0.05 vs. Fibro./Tumor. e. PGE2 EIA validated that supernatant of human primary colon adenocarcinomas (Tumor) stimulated PGE2 release in EGCs, but not in fibroblasts, compared to supernatant of healthy mucosa (CM = conditioned medium). n ≥ 4; ANOVA, Holm-Sidak multiple comparison test, a: p < 0.05 vs. EGC/Healthy, b: p < 0.05 vs. Fibro./Healthy, c: p < 0.05 vs. Fibro./Tumor, d: p < 0.05 vs. Healthy, e: p < 0.05 vs. Tumor. f. Representative photographs and quantification to illustrate that the addition of a specific inhibitor of mPGES-1 expression (CAY10526; 10 µM) to tumor epithelial cell-CM prevented TA-EGCs from acquiring pro-tumorigenic effects. n = 5; ANOVA, Holm-Sidak multiple comparison test, a: p < 0.05 vs. Control, b: p < 0.05 vs. EGC CM, c: p < 0.05 vs. EGC-CM+CAY10526, d: p < 0.05 vs. TA EGC-CM+CAY10526. Scale Bar: 1 mm.
Fig. 5:
Fig. 5
TA EGC stimulate CSC clonogenicity via EP4 activation as well as EGFR- and ERK-dependent pathways. a/b. RT-qPCR data showing that PTGER4 (EP4) mRNA was significantly enriched in CSCs compared to unsorted HT29 cells (Total) and compared to cells expressing lower levels of CSC markers (non-CSC) (a). In contrast, PTGER1 (EP1) was expressed at significantly lower levels in CSCs than in unsorted HT29 cells and non-CSCs (b). Data are expressed as fold change to Total (mean ± SEM). n = 5; ANOVA, Holm-Sidak multiple comparison test, a: p < 0.05 vs. Total, b: p < 0.05 vs. non-CSC. c. Representative photographs (right panel) and quantification (left panel) demonstrated that the addition of a selective antagonist of EP4 (L-161,982, 50 µM) but not EP1 (SC-19220, 50 µM) to TA EGC—CM abolished its pro-tumorigenic effects. n ≥ 4; ANOVA, Holm-Sidak multiple comparison test, a: p < 0.05 vs. Control, b: p < 0.05 vs. SC-19220, c: p < 0.05 vs. L-161,982. Scale Bar: 1 mm. d. Representative western blots and quantification demonstrating that EGCs increased pEGFR-Y845/EGFR in CSCs. Quantification is expressed as fold change to Control (mean ± SEM). n = 4, Mann and Whitney test, a: p < 0.05. e. Representative photographs and quantification of tumorspheres yielded from CSCs cultured alone (Control) or with tumor-activated EGC-CM (TA EGC-CM) supplemented or not with an inhibitor of EGFR tyrosine kinase activity (AG 1478; 10 µM). Data are expressed as fold change relative to Control (mean ± SEM). n = 4; ANOVA, Holm-Sidak multiple comparison test, a: p < 0.05 vs. Control, b: p < 0.05 vs. AG 1478, b: p < 0.05 vs. TA EGC-CM + AG 1478. Scale bar: 1 mm. f. Representative immunoblots illustrating that pERK/ERK was increased in CSCs cultured in the presence of EGCs compared to CSCs cultured alone. n = 4; Mann and Whitney test, a: p < 0.05.
Fig. 6:
Fig. 6
EGCs express IL-1R, and IL-1α/β are highly enriched in the tumor microenvironment. a/b. Agarose gel electrophoresis of PCR products corresponding to IL-1R cDNA amplicons in human primary EGC cultures (a) (HOG-EGC, amplicon size 152 bp) and in rat non-transformed EGC line (b) (JUG-EGC, amplicon size 63 bp). Lanes #1, #2 and #3 (a) correspond to 3 cultures derived from 3 different patients. Lanes P25 and P30 (b) correspond to 2 different passages. c/d. ELISA data showed that IL-1α (c) and IL-1β (d) were highly enriched in supernatants of human colon adenocarcinomas (Tumor) compared with supernatants of patient-matched healthy colonic mucosa (Healthy). n = 4; Wilcoxon rank-sum test, a: p < 0.05 vs. Healthy. e/f. Real-Time qPCR data demonstrated that IL-1α gene expression (e) was downregulated in CD44High-CD24HighCSCs as compared to unsorted HT29 (Total) and CD44Low-CD24Lownon-CSCs, and IL-1β mRNA (f) was enriched in non-CSCs. Data are expressed as fold change to unsorted HT29 cells (Total) (mean ± SEM). n = 4, ANOVA, a: p < 0.05 vs. Total, b: p < 0.05 vs. non-CSC.
Fig. 7:
Fig. 7
Tumor epithelial cell-derived IL1α/β activates a pro-tumorigenic phenotype in EGCs. a. RT-qPCR data demonstrating that addition of IL-1α or IL-1β strongly induced mPGES-1 gene expression in EGCs. n = 3. b. RT-qPCR data showing that addition of an antagonist of IL-1R (IL-1Ra, 10 µM) to supernatants of human primary colon adenocarcinomas (Tumor) abolished the tumor-induced up-regulation of mPGES-1 expression in EGCs. Healthy represents supernatants of patient-matched healthy colonic mucosa. n = 8; ANOVA, Holm-Sidak multiple comparison test, a: p < 0.05 vs. Control, b: p < 0.05 vs. IL-1Ra, c: p < 0.05 vs. Healthy, d: p < 0.05 vs. Healthy+IL-1Ra, e: p < 0.05 vs. Tumor+IL-1Ra. c. PGE2 EIA confirmed that addition of IL-1Ra blocked the increase in PGE2 release in EGCs activated by supernatants of human colon adenocarcinomas (EGC/Tumor). EGC, Healthy, Tumor and EGC/Healthy represent EGC-CM, supernatant of patient-matched healthy mucosa, supernatant of tumors, and CM of EGCs stimulated with supernatant of healthy mucosa, respectively. n ≥ 4; ANOVA, a: p < 0.05 vs. EGC, b: p < 0.05 vs. EGC+IL-1Ra, c: p < 0.05 vs. Healthy, d: p < 0.05 vs. Tumor, e: p < 0.05 vs. EGC/Healthy, f: p < 0.05 vs. EGC/Healthy+IL-1Ra, g: p < 0.05 vs. EGC/Tumor+IL-1RA. d. Representative photographs (left panel) and quantification (right panel) to show that double IL-1α and β knock-down tumor epithelial cells (TEC) had lost their abilities to activate a pro-tumorigenic phenotype in EGCs, while single IL-1α or β knock-down TECs had impact similar to that of Control TECs. n = 4, ANOVA. Scale Bar: 1 mm.
Fig. 8
Fig. 8
Molecular crosstalk between EGCs and colon cancer (stem) cells. The schematic summarizes the molecular pathways involved in the pro-tumorigenic effects of tumor-activated EGCs on colon CSC-driven tumorigenesis.

Similar articles

Cited by

References

    1. Ricci-Vitiani L., Lombardi D.G., Pilozzi E., Biffoni M., Todaro M., Peschle C. Identification and expansion of human colon-cancer-initiating cells. Nature. 2007 4;445(7123):111–115. - PubMed
    1. O'Brien C.A., Pollett A., Gallinger S., Dick J.E. A human colon cancer cell capable of initiating tumour growth in immunodeficient mice. Nature. 2007 4;445(7123):106–110. - PubMed
    1. Gao W., Chen L., Ma Z., Du Z., Zhao Z., Hu Z. Isolation and phenotypic characterization of colorectal cancer stem cells with organ-specific metastatic potential. Gastroenterology. 2013;145(3):636–646. - PubMed
    1. Colak S., Zimberlin C.D., Fessler E., Hogdal L., Prasetyanti P.R., Grandela C.M. Decreased mitochondrial priming determines chemoresistance of colon cancer stem cells. Cell Death Differ. 2014;21(7):1170–1177. - PMC - PubMed
    1. Huels D.J., Sansom O.J. Stem vs non-stem cell origin of colorectal cancer. Br J Cancer. 2015;113(1):1–5. - PMC - PubMed

MeSH terms