. 2020 Jan;182(1):597-611.
doi: 10.1104/pp.19.00916. Epub 2019 Oct 29.

Ascorbate Deficiency Does Not Limit Nonphotochemical Quenching in Chlamydomonas reinhardtii

Affiliations

Ascorbate Deficiency Does Not Limit Nonphotochemical Quenching in Chlamydomonas reinhardtii

André Vidal-Meireles et al. Plant Physiol. 2020 Jan.

Abstract

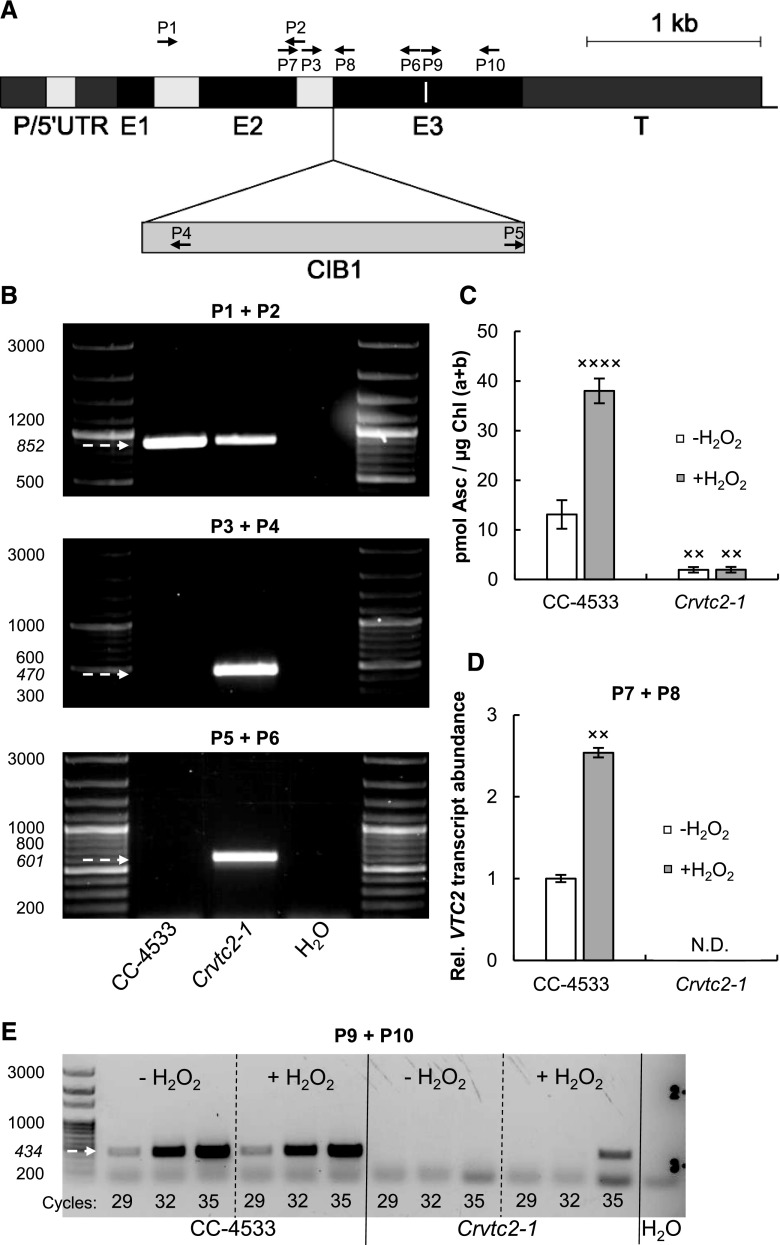
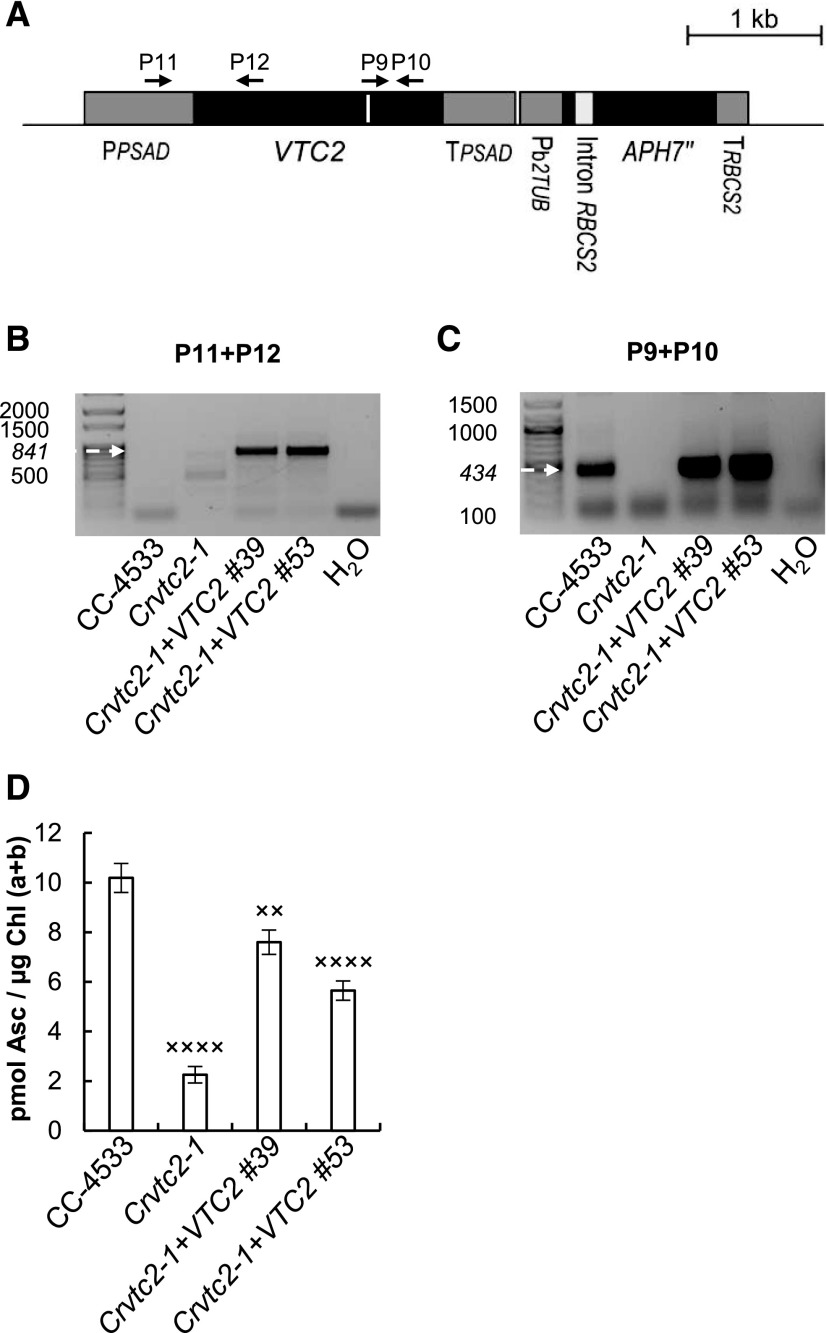
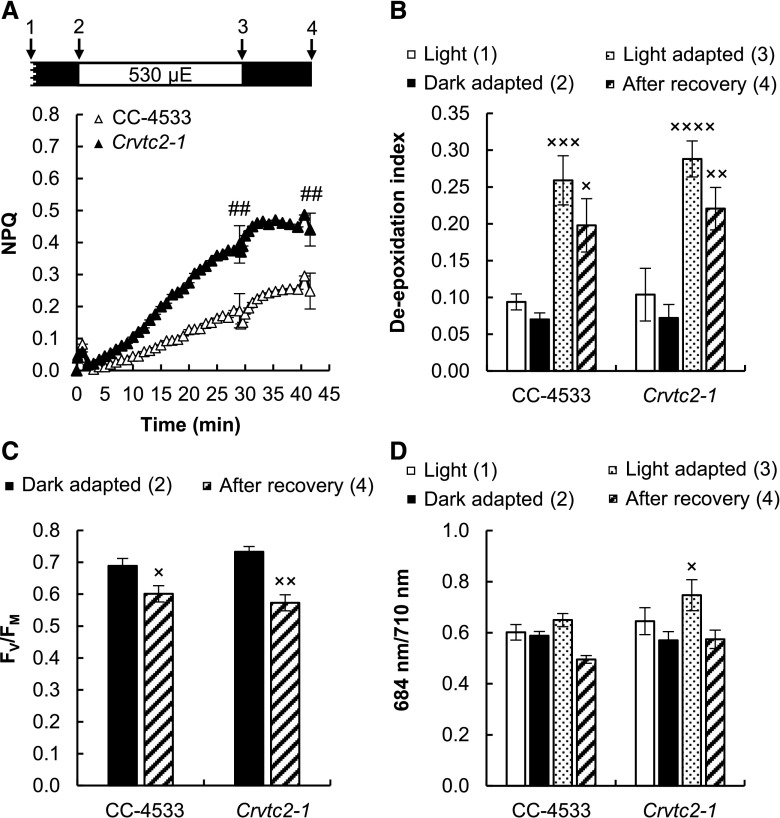
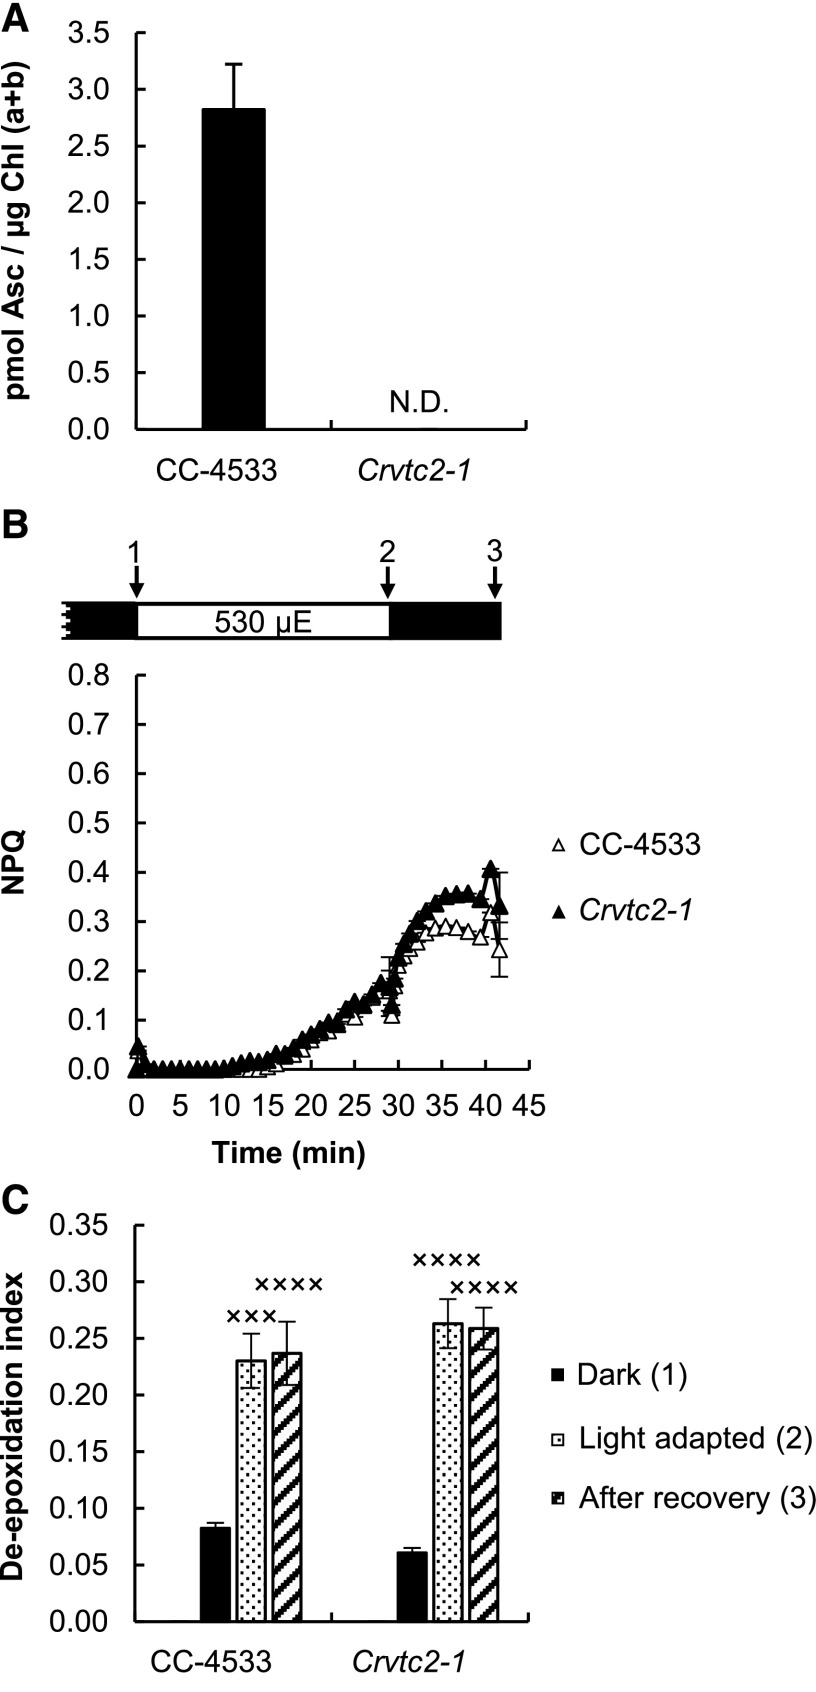
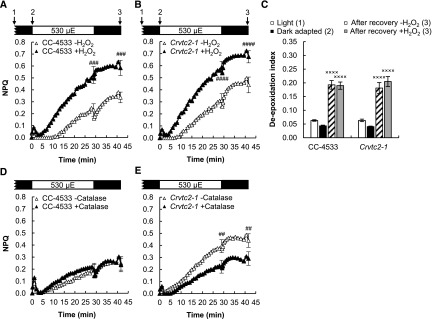
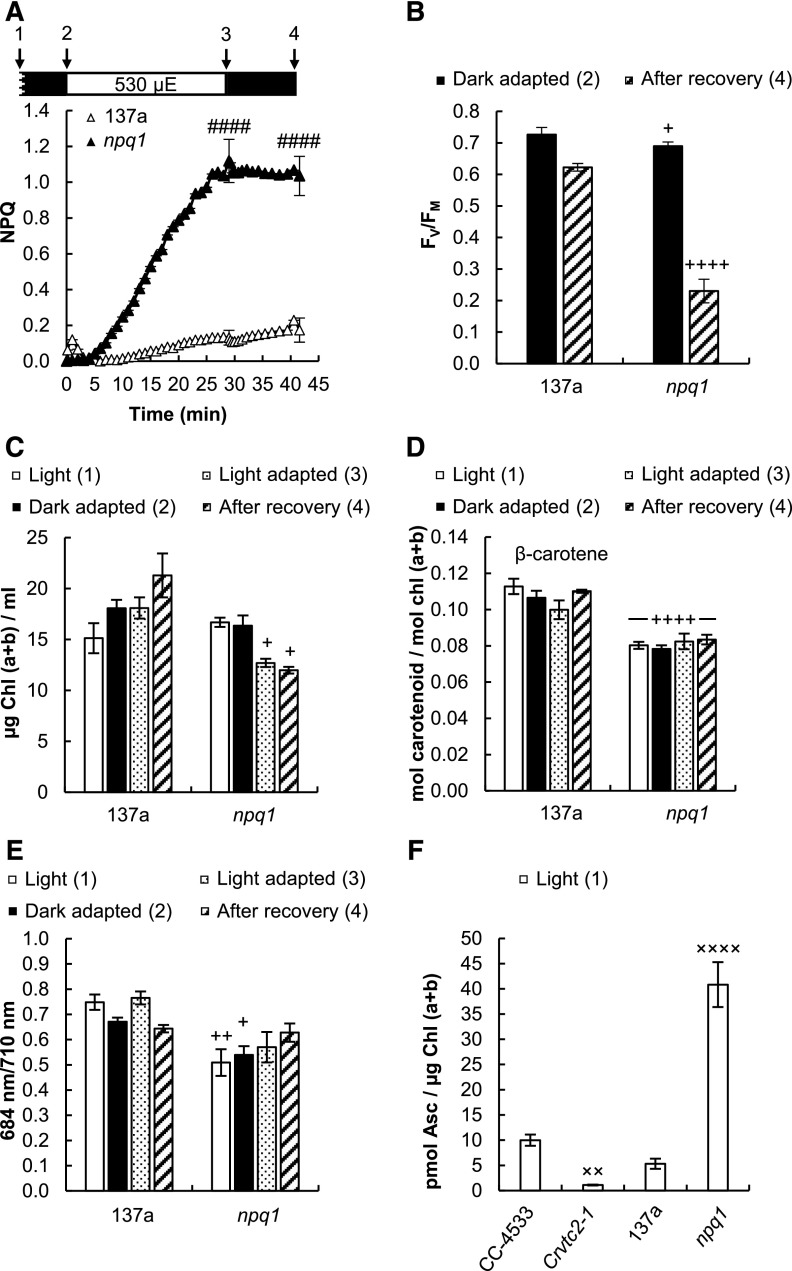
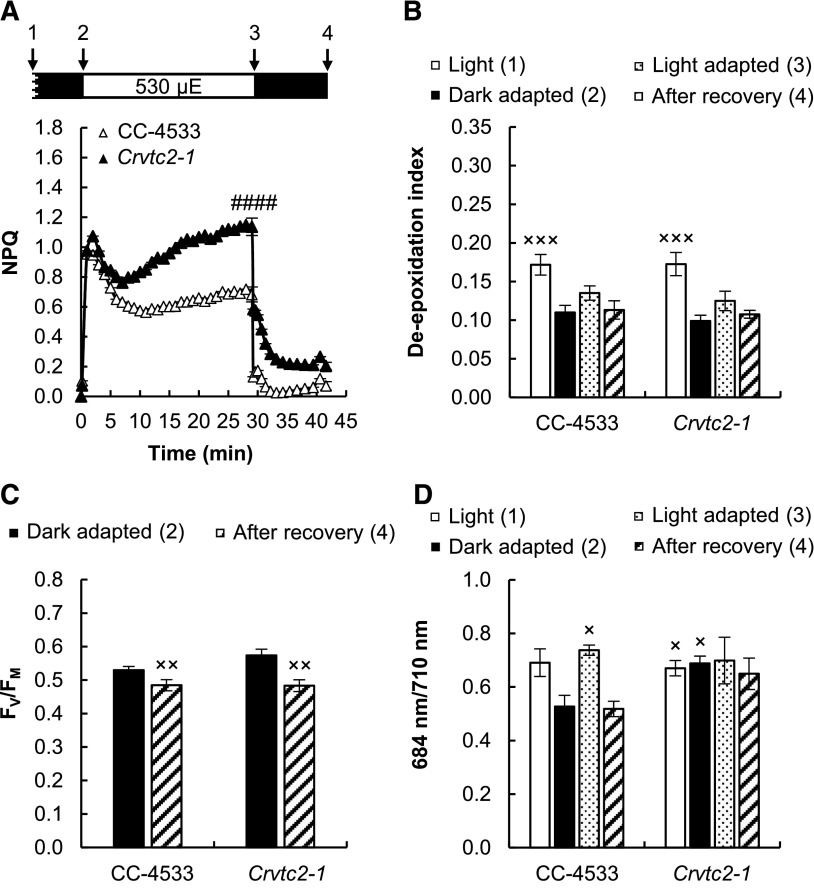
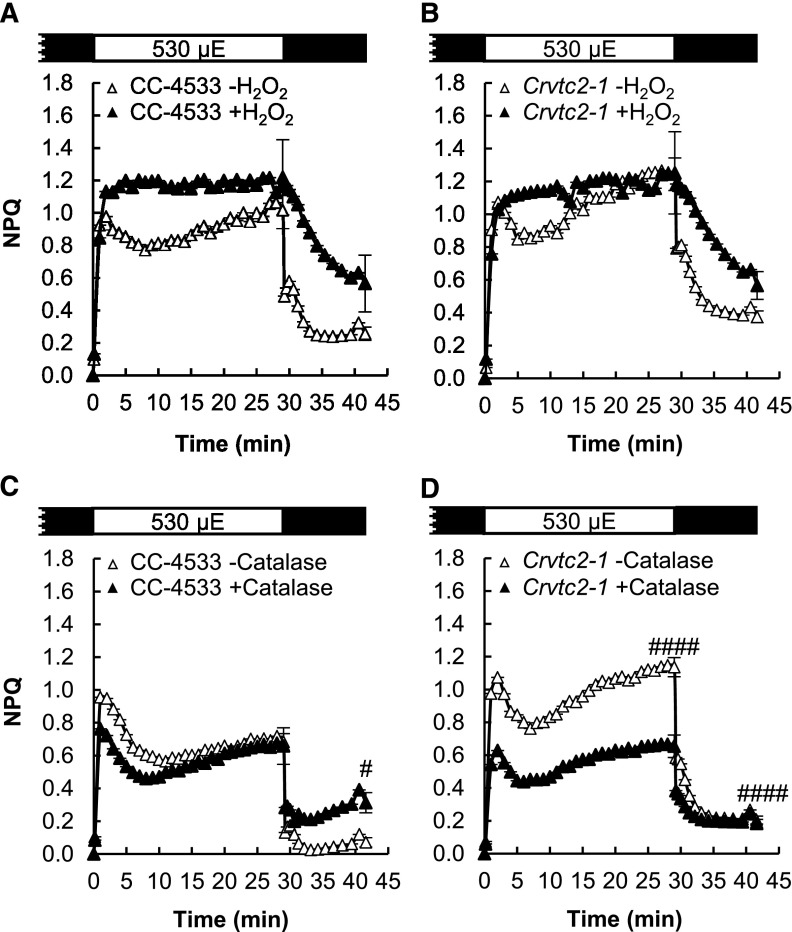
Ascorbate (Asc; vitamin C) plays essential roles in development, signaling, hormone biosynthesis, regulation of gene expression, stress resistance, and photoprotection. In vascular plants, violaxanthin de-epoxidase requires Asc as a reductant; thereby, Asc is required for the energy-dependent component of nonphotochemical quenching (NPQ). To assess the role of Asc in NPQ in green algae, which are known to contain low amounts of Asc, we searched for an insertional Chlamydomonas reinhardtii mutant affected in theVTC2 gene encoding GDP-l-Gal phosphorylase, which catalyzes the first committed step in the biosynthesis of Asc. The Crvtc2-1 knockout mutant was viable and, depending on the growth conditions, contained 10% to 20% Asc relative to its wild type. When C. reinhardtii was grown photomixotrophically at moderate light, the zeaxanthin-dependent component of NPQ emerged upon strong red illumination both in the Crvtc2-1 mutant and in its wild type. Deepoxidation was unaffected by Asc deficiency, demonstrating that the Chlorophycean violaxanthin de-epoxidase found in C. reinhardtii does not require Asc as a reductant. The rapidly induced, energy-dependent NPQ component characteristic of photoautotrophic C. reinhardtii cultures grown at high light was not limited by Asc deficiency either. On the other hand, a reactive oxygen species-induced photoinhibitory NPQ component was greatly enhanced upon Asc deficiency, both under photomixotrophic and photoautotrophic conditions. These results demonstrate that Asc has distinct roles in NPQ formation in C. reinhardtii as compared to vascular plants.


Figures

Figure 1.
Figure 1.
Characterization of an insertional CLiP mutant of C. reinhardtii (Crvtc2-1; LMJ.RY0402.058624) affected in the VTC2 gene that encodes GDP-l-Gal phosphorylase. A, Physical map of VTC2 (obtained from Phytozome, version 12.1.6) with the CIB1 cassette insertion site in the Crvtc2-1 mutant. Exons are shown in black, introns in light gray, and promoter/5′ UTR and terminator sequences in dark gray. The insertion site of the CIB1 cassette is indicated by the triangle, and the binding sites of the primers used for genotyping and gene expression analysis of Crvtc2-1 are shown as black arrows. The sequence encoding the catalytic site of GDP-l-Gal phosphorylase is marked as a white line within Exon 3. B, PCR performed using primers annealing upstream of the predicted cassette insertion site in VTC2 (top, primers P1+P2) and primers amplifying the 5′ and 3′ genome-cassette junctions (middle and bottom; P3+P4 and P5+P6, respectively). The expected sizes are marked with arrows. C, Ascorbate contents of the wild type (CC-4533) and the Crvtc2-1 mutant grown mixotrophically in TAP medium at moderate light with and without the addition of 1.5 mm H2O2. D, Transcript levels of VTC2, as determined by RT-qPCR in cultures supplemented, or not, with H2O2 using primers P7 and P8. E, Electrophoresis of RT-PCR products using primers P9 and P10, spanning the sequence that encodes the catalytic site of GDP-l-Gal phosphorylase. The number of PCR cycles is indicated at the bottom of the figure. The presented data are based on three independent experiments. When applicable, averages and ses (±se) were calculated. Data were analyzed by one-way ANOVA followed by Dunnett’s posttest: ×, P < 0.05, ××, P < 0.01, and ××××, P < 0.0001, compared to the untreated CC-4533 strain.
Figure 2.
Figure 2.
Complementation of the insertional CLiP mutant LMJ.RY0402.058624 (Crvtc2-1) affected in the VTC2 gene with the coding sequence of VTC2. A, Physical map of the Crvtc2-1+VTC2 plasmid containing the coding sequence of VTC2, the constitutive promoter PsaD, and the APH7″ resistance gene and the terminators TPSAD and TRBCS2. Exons are shown in black and promoter/5′ UTR terminator sequences in dark gray, and the sequence encoding the catalytic site of GDP-l-Gal phosphorylase is marked as a white line. The binding sites of the primers used are shown as black arrows. B, PCR performed using primers annealing in the promoter and VTC2 exon 1 (P11+P12). The expected size is marked with an arrow. C, Electrophoresis of RT-PCR products obtained using primers annealing to the sequence encoding the catalytic site of VTC2 (P9+P10). The expected size is marked with an arrow. D, Ascorbate contents of CC-4533, the Crvtc2-1 mutant, and the complementation lines Crvtc2-1+VTC2 grown for 3 d in TAP at 100 µmol photons m−2 s−1. The presented data are based on four independent experiments. When applicable, averages and ses (±se) were calculated. Data were analyzed by one-way ANOVA followed by Dunnett’s post-test: ××, P < 0.05 and ××××, P < 0.0001, compared to the CC-4533 strain. µE, µmol photons m−2 s−1.
Figure 3.
Figure 3.
Acclimation to 530 µmol photons m−2 s−1 of red light followed by recovery in CC-4533 (wild type) and Crvtc2-1 cultures grown photomixotrophically in TAP medium at 100 µmol photons m−2 s−1. A, NPQ kinetics. Data were analyzed by one-way ANOVA followed by Dunnett’s posttest: ##, P < 0.01, compared to the CC-4533 strain at the respective time point. µE, µmol photons m−2 s−1. B, De-epoxidation index. C, The FV/FM value, an indicator of photosynthetic efficiency, parameter measured after dark adaptation and after recovery from the 530 µmol photons m−2 s−1 red light. D, The 684/710 nm ratio of the 77 K fluorescence spectra. Samples were collected at the growth light of 100 µmol photons m−2 s−1 after 30 min of dark adaptation, at the end of the 30-min light period with 530 µmol photons m−2 s−1, and 15 min after the cessation of actinic illumination, as indicated by arrows in the scheme in A. The presented data are based on five independent experiments. When applicable, averages and ses (±se) were calculated. Data were analyzed by one-way ANOVA followed by Dunnett’s posttest: ×, P < 0.05, ××, P < 0.01, and ×××, P < 0.001, compared to the dark-adapted CC-4533 strain.
Figure 4.
Figure 4.
Effects of overnight (16 h) dark acclimation on CC-4533 and Crvtc2-1 grown in TAP medium at 100 µmol photons m−2 s−1. A, Ascorbate content after 16 h of dark acclimation. N.D., not detectable. B, NPQ, induced by 530 µmol photons m−2 s−1 of red light after overnight dark acclimation. µE, µmol photons m−2 s−1. C, De-epoxidation index, determined in the overnight dark-acclimated cultures following red-light illumination and recovery. The presented data are based on four independent experiments. When applicable, averages and ses (±se) were calculated. Data were analyzed by one-way ANOVA followed by Dunnett’s posttest: ×××, P < 0.001, and ××××, P < 0.0001, compared to the dark-acclimated CC-4533 strain.
Figure 5.
Figure 5.
The effects of H2O2 and catalase on NPQ induced by strong red light (530 µmol photons m−2 s−1) in the wild type (CC-4533) and the Crvtc2-1 mutant grown in photomixotrophic conditions in TAP medium at 100 µmol photons m−2 s−1. A, Effect of 1.5 mm H2O2 on NPQ induction in the CC-4533 strain. B, Effect of 1.5 mm H2O2 on NPQ induction in the Crvtc2-1 mutant. C, Effect of H2O2 addition on de-epoxidation. D, Effect of catalase on NPQ induction in the CC-4533 strain. E, Effect of catalase on NPQ induction in the Crvtc2-1 mutant. Samples were collected at the time points indicated by arrows in the schemes in A and B. The presented data are based on three independent experiments. When applicable, averages and ses (±se) were calculated. Data were analyzed by one-way ANOVA followed by Dunnett’s posttest: ##, P < 0.01, ###, P < 0.001, and ####, P < 0.0001, compared to the untreated CC-4533 culture at the respective time point; ×, P < 0.05, ××, P < 0.01, and ×××, P < 0.001, compared to the dark-adapted CC-4533 strain. µE, µmol photons m−2 s−1.
Figure 6.
Figure 6.
Effects of strong red light (530 µmol photons m−2 s−1) on the 137a wild type and the npq1 mutant of C. reinhardtii grown in TAP medium at 100 µmol photons m−2 s−1. A, NPQ induced by 530 µmol photons m−2 s−1 of red light followed by a recovery phase. µE, µmol photons m−2 s−1. B, FV/FM values determined before the strong red light illumination and after the recovery phase. C, Chl(a+b) content of the cultures determined before, during, and after the strong red light illumination. D, β-carotene content measured before, during, and after the strong red light illumination. E, The 684/710 nm ratio of the 77 K fluorescence spectra determined before, during, and after the strong red light illumination. F, Ascorbate contents of the npq1 and Crvtc2-1 mutants and the CC-4533 and 137a wild-type strains. Samples were collected at the time points indicated by arrows in the scheme in A. The presented data are based on five independent experiments. When applicable, averages and ses (±se) were calculated. Data were analyzed by one-way ANOVA followed by Dunnett’s posttest: ####, P < 0.0001 (A) compared to the 137a strain at the respective time point; +, P < 0.05, ++, P < 0.01, and ++++, P < 0.0001 (C–E), compared to the dark-adapted 137a strain; ××, P < 0.01, and ××××, P < 0.0001 (F), compared to the CC-4533 strain.
Figure 7.
Figure 7.
Acclimation to 530 µmol photons m−2 s−1 of red light followed by recovery in CC-4533 and Crvtc2-1 cultures grown photoautotrophically in HS medium at 530 µmol photons m−2 s−1. A, NPQ kinetics. Data were analyzed by one-way ANOVA followed by Dunnett’s posttest: ####, P < 0.0001, compared to the CC-4533 strain at the respective time poin. µE, µmol photons m−2 s−1. B, De-epoxidation index. C, FV/FM parameter measured after dark adaptation and after recovery from the 530 µmol photons m−2 s−1 red light illumination. D, The 684/710 nm ratio of the 77 K fluorescence spectra. The samples were collected at the growth light of 530 µmol photons m−2 s−1, after 30 min of dark adaptation, at the end of the 30 min red light illumination, and 12 min after the cessation of actinic illumination, as indicated in the scheme in A. The presented data are based on eight independent experiments. When applicable, averages and ses (±se) were calculated. Data were analyzed by one-way ANOVA followed by Dunnett’s posttest:×, P < 0.05, ××, P < 0.01, and ×××, P < 0.001, compared to the dark-adapted CC-4533 strain.
Figure 8.
Figure 8.
The effects of H2O2 and catalase on NPQ induced by strong red light (530 µmol photons m−2 s−1) in the wild-type (CC-4533) and Crvtc2-1 mutant strains grown photoautotrophically in HS medium at 530 µmol photons m−2 s−1. A, Effect of 1.5 mm H2O2 on NPQ induction in the CC-4533 strain. B, Effect of 1.5 mm H2O2 on NPQ induction in the Crvtc2-1 mutant. C, Effect of catalase on NPQ induction in the CC-4533 strain. D, Effect of catalase on NPQ induction in the Crvtc2-1 mutant. The presented data are based on four independent experiments. When applicable, averages and ses (±se) were calculated. Data were analyzed by one-way ANOVA followed by Dunnett’s posttest: #, P < 0.05, and ####, P < 0.0001, compared to the untreated CC-4533 culture at the respective time point. µE, µmol photons m−2 s−1.

Similar articles

Cited by

References

    1. Adams WW III, Muller O, Cohu CM, Demmig-Adams B (2013) May photoinhibition be a consequence, rather than a cause, of limited plant productivity? Photosynth Res 117: 31–44 - PubMed
    1. Allorent G, Tokutsu R, Roach T, Peers G, Cardol P, Girard-Bascou J, Seigneurin-Berny D, Petroutsos D, Kuntz M, Breyton C, et al. (2013) A dual strategy to cope with high light in Chlamydomonas reinhardtii. Plant Cell 25: 545–557 - PMC - PubMed
    1. Arnoux P, Morosinotto T, Saga G, Bassi R, Pignol D (2009) A structural basis for the pH-dependent xanthophyll cycle in Arabidopsis thaliana. Plant Cell 21: 2036–2044 - PMC - PubMed
    1. Asada K. (2006) Production and scavenging of reactive oxygen species in chloroplasts and their functions. Plant Physiol 141: 391–396 - PMC - PubMed
    1. Avenson TJ, Ahn TK, Zigmantas D, Niyogi KK, Li Z, Ballottari M, Bassi R, Fleming GR (2008) Zeaxanthin radical cation formation in minor light-harvesting complexes of higher plant antenna. J Biol Chem 283: 3550–3558 - PubMed

Publication types

MeSH terms