. 2019 Dec 13;294(50):18992-19011.
doi: 10.1074/jbc.RA119.010450. Epub 2019 Oct 29.

Proper secretion of the serpin antithrombin relies strictly on thiol-dependent quality control

Affiliations

Proper secretion of the serpin antithrombin relies strictly on thiol-dependent quality control

Benjamin M Adams et al. J Biol Chem. .

Abstract

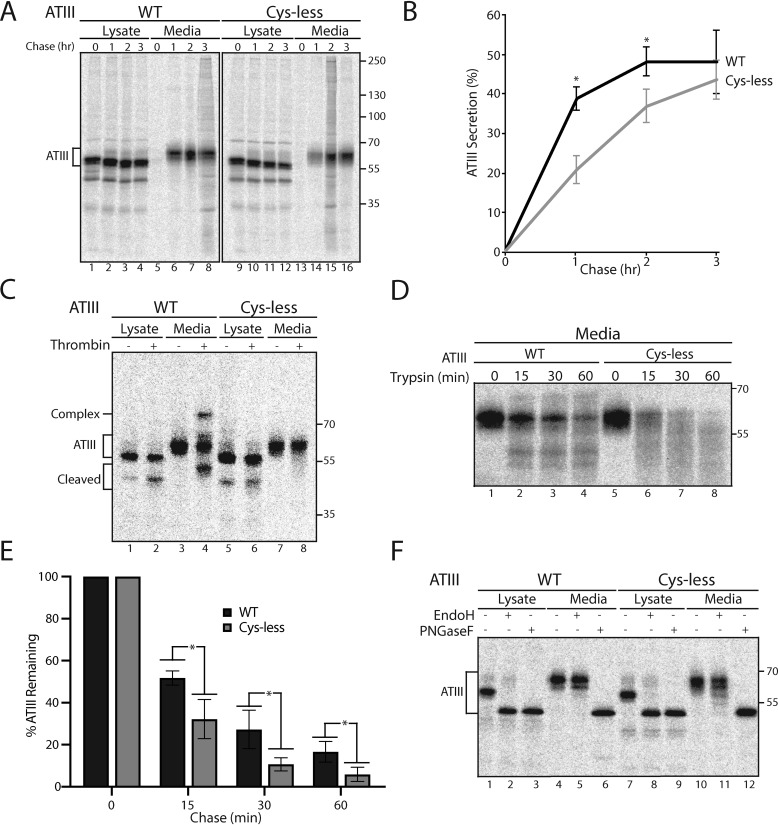
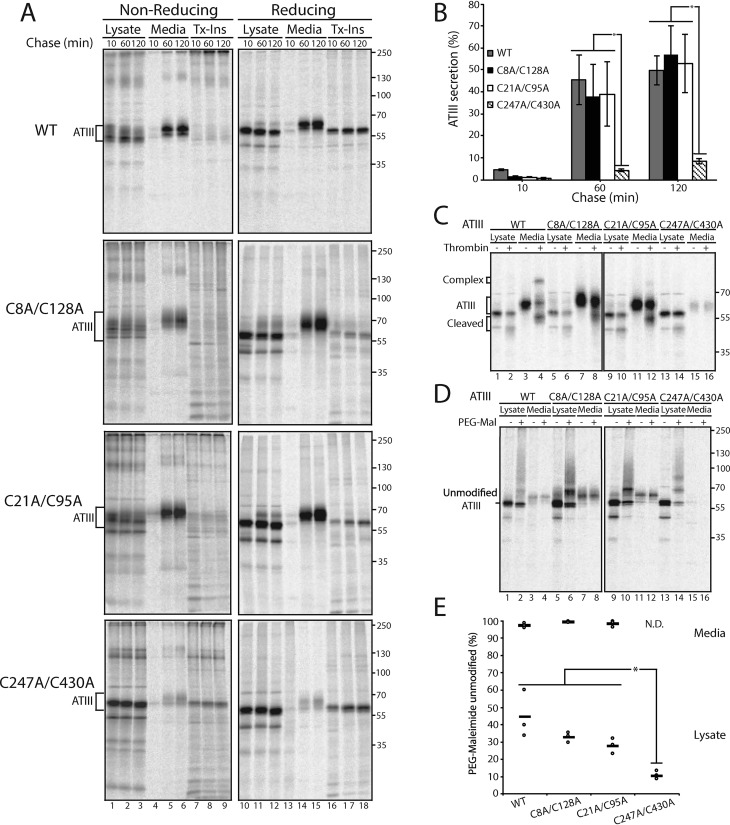
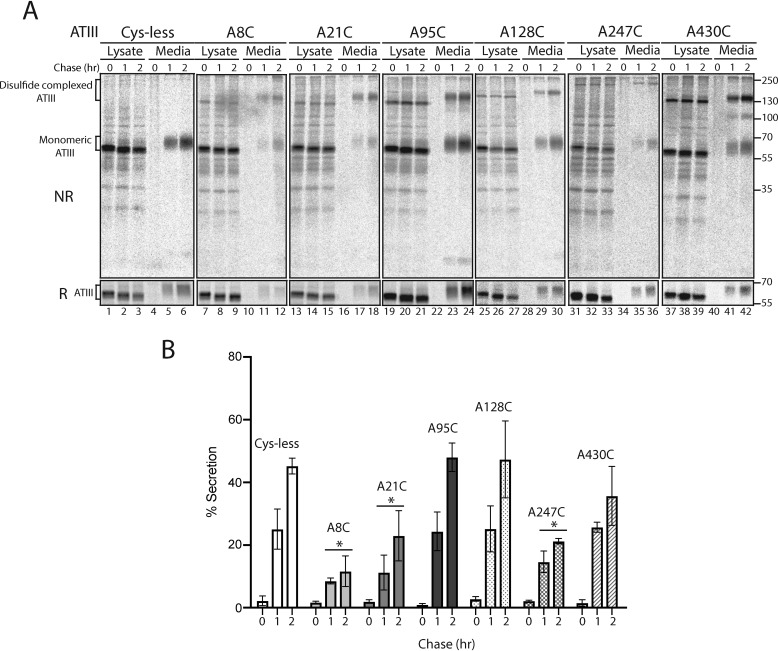
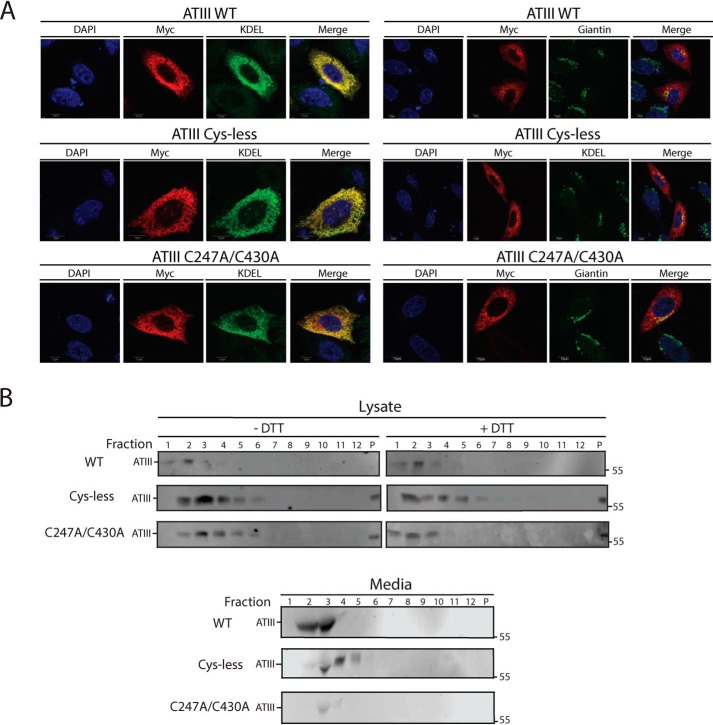
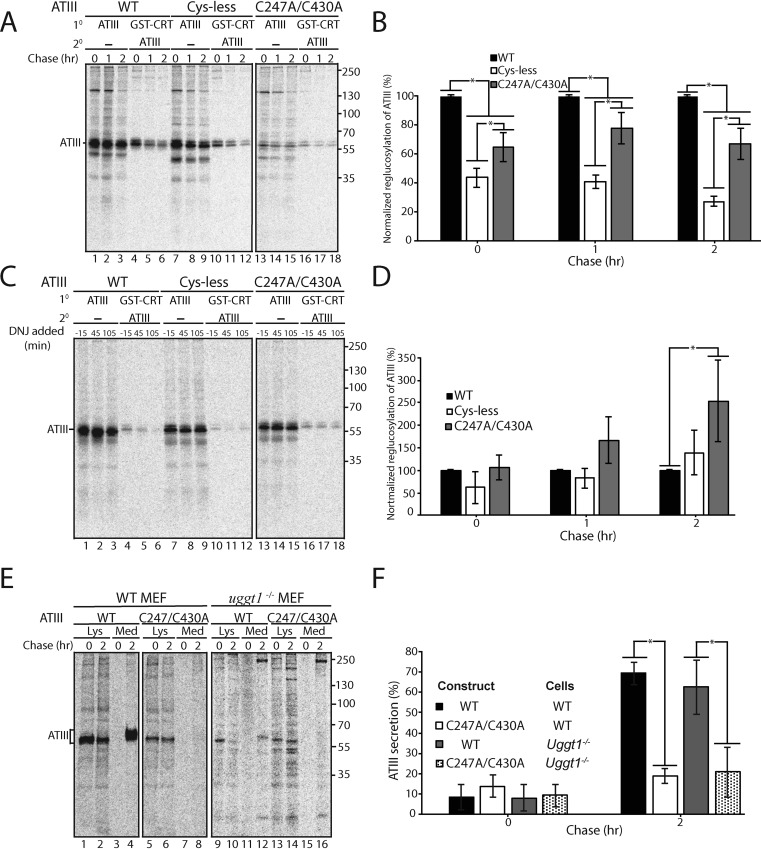
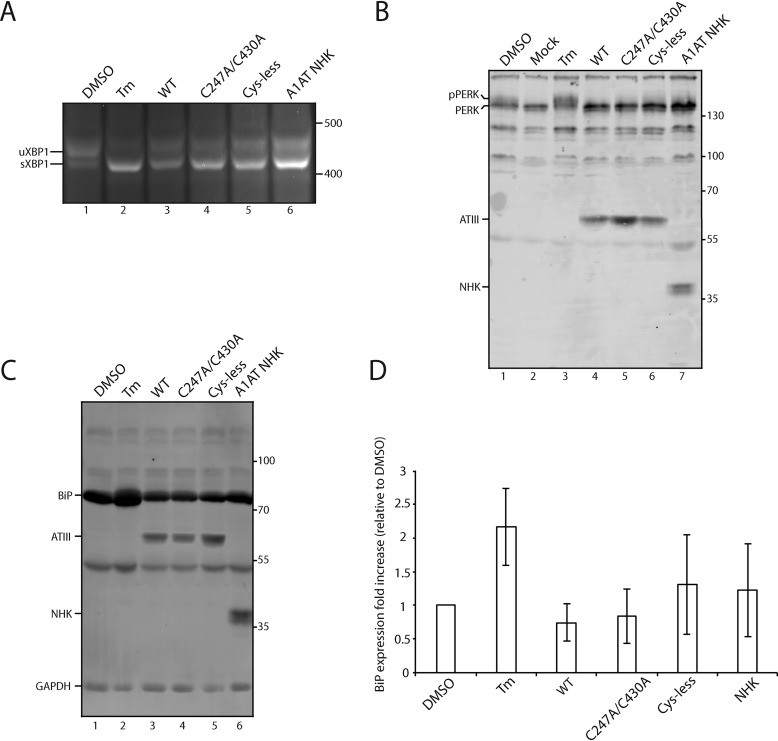
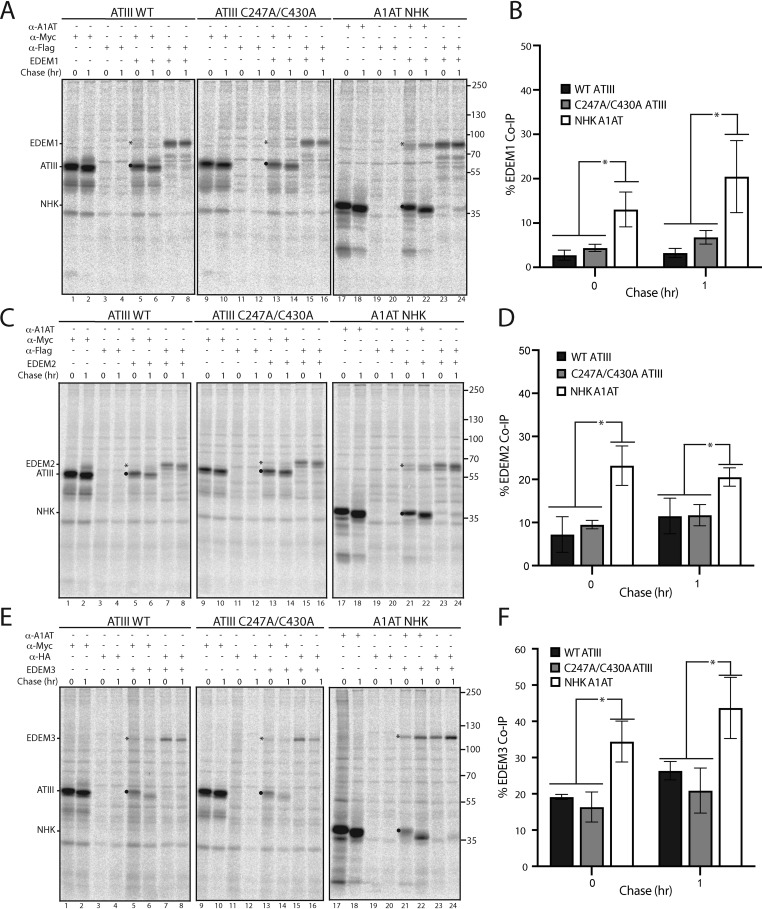
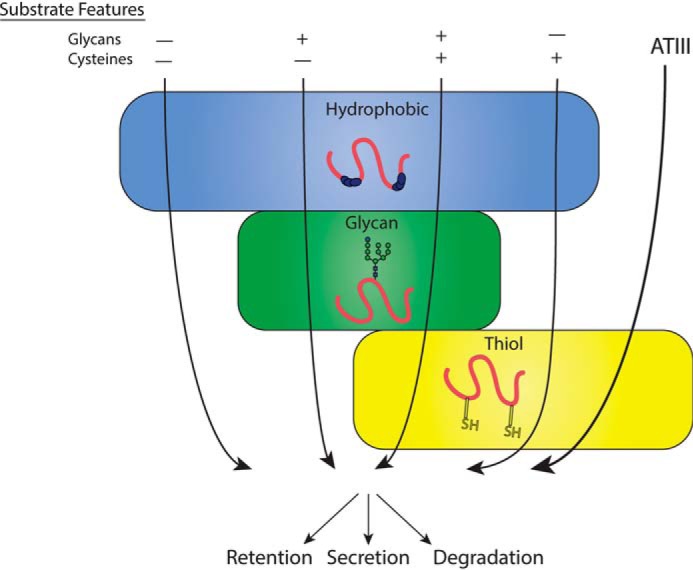
The protein quality control machinery of the endoplasmic reticulum (ERQC) ensures that client proteins are properly folded. ERQC substrates may be recognized as nonnative by the presence of exposed hydrophobic surfaces, free thiols, or processed N-glycans. How these features dictate which ERQC pathways engage a given substrate is poorly understood. Here, using metabolic labeling, immunoprecipitations, various biochemical assays, and the human serpin antithrombin III (ATIII) as a model, we explored the role of ERQC systems in mammalian cells. Although ATIII has N-glycans and a hydrophobic core, we found that its quality control depended solely on free thiol content. Mutagenesis of all six Cys residues in ATIII to Ala resulted in its efficient secretion even though the product was not natively folded. ATIII variants with free thiols were retained in the endoplasmic reticulum but not degraded. These results provide insight into the hierarchy of ERQC systems and reveal a fundamental vulnerability of ERQC in a case of reliance on the thiol-dependent quality control pathway.

Keywords: ER-mediated protein quality control (ERQC); N-linked glycosylation; UPR; disulfide; endoplasmic reticulum (ER); endoplasmic reticulum-associated protein degradation (ERAD); protein folding; protein homeostasis; protein maturation; serpin; unfolded protein response (UPR).


Conflict of interest statement

The authors declare that they have no conflicts of interest with the contents of this article

Figures

Figure 1.
Figure 1.
Inactive and misfolded ATIII Cys-less is improperly but efficiently secreted. A, ATIII and ATIII Cys-less were expressed in CHO cells. Cells were radiolabeled with [35S]Cys/Met for 30 min and chased for the indicated times. At each time point, cell lysate and media were collected. Cells were lysed in MNT buffer. ATIII was immunoprecipitated using anti-Myc antibodies. Samples were resolved by reducing 9% SDS-PAGE. B, quantification of ATIII secretion from A. The lysate and media were quantified, and ATIII secretion is presented as a percentage of ATIII in the media to ATIII in the 0-h lysate. C, ATIII WT and ATIII Cys-less were expressed in CHO cells and radiolabeled with [35S]Cys/Met for 30 min and chased for 3 h. Cells were lysed in MNT buffer. Cell lysate and media were collected, and ATIII was immunoprecipitated using anti-Myc antibodies and washed with buffer containing 0.5% CHAPS. ATIII was then eluted from the immunoprecipitation beads by incubation with 0.5 mg/ml c-Myc peptide for 1 h at 37 °C. Sample was then evenly split between treated and nontreated samples. 0.648 mg (2 units) of thrombin were added to treated samples, whereas nontreated samples received an equal volume of water. Samples were then incubated at 37 °C for 1 h and resolved by reducing 9% SDS-PAGE. D, ATIII WT and Cys-less were expressed in CHO cells. Cells were radiolabeled with [35S]Cys/Met for 30 min and chased for 3 h, and cell lysate and media were collected. Cells were lysed in MNT buffer. ATIII was immunoprecipitated using anti-Myc antibodies. 0.05 μg of trypsin was added to treated samples, and an equal volume of water was added to nontreated samples. Samples were then incubated for the indicated times at 37 °C and resolved by reducing 9% SDS-PAGE. E, quantification of ATIII remaining post-trypsin degradation from D. F, ATIII WT and Cys-less were expressed in CHO cells. Cells were radiolabeled for 30 min with [35S]Cys/Met and chased for 2 h, and cell lysate and media were collected. Cells were lysed in MNT buffer. ATIII was immunoprecipitated using anti-Myc antibodies. Lysate and medium samples were treated with Endo H or PNGase F or left untreated. Samples were then resolved on a reducing 9% SDS-PAGE. All experiments are representative of three independent experiments. Error bars, S.D.
Figure 2.
Figure 2.
Cellularly retained ATIII C247A/C430A is inactive and contains a higher level of free thiols. A, WT ATIII and ATIII disulfide mutants were expressed in CHO cells. Cells were radiolabeled with [35S]Cys/Met for 30 min and chased for the indicated times. At each time point, cell lysate and media were collected and processed as described in the legend to Fig. 1A. B, quantification of ATIII secretion from A. The lysate and media were quantified, and ATIII secretion is presented as a percentage of ATIII in the media to ATIII in the 10-min lysate. C, ATIII and ATIII disulfide mutants were expressed in CHO cells, radiolabeled with [35S]Cys/Met for 30 min, and chased for 3 h. Cells were lysed in MNT buffer. Cell lysate and media were collected, and ATIII was immunoprecipitated using anti-Myc antibody and washed with 0.5% CHAPS buffer. ATIII was then eluted from the immunoprecipitation beads by incubation with 0.5 mg/ml c-Myc peptide for 1 h at 37 °C. Samples were then evenly split between treated and nontreated samples. 0.648 mg (2 units) of thrombin were added to treated samples, whereas nontreated samples received an equal volume of water. Samples were then incubated at 37 °C for 1 h and resolved by reducing 9% SDS-PAGE. D, WT ATIII and ATIII disulfide mutants were expressed in CHO cells, radiolabeled with [35S]Cys/Met for 30 min, and chased for 30 min. Cells were lysed in MNT buffer. To treated samples, PEG-maleimide was added to a final concentration of 1.4 mm, and to the nontreated samples, N-ethyl maleimide was added to a final concentration of 5 mm. Samples were incubated at room temperature for 30 min. Treated samples were then quenched with DTT at a final concentration of 100 mm. ATIII was immunoprecipitated using anti-Myc antibodies, and samples were resolved by reducing 9% SDS-PAGE. E, quantification of PEG-maleimide–unmodified ATIII from D. The percentage PEG-maleimide–unmodified ATIII was determined by quantifying the amount of unmodified ATIII in PEG-maleimide–treated and –nontreated samples and dividing the treated sample by the untreated sample. All experiments are representative of three independent experiments. Error bars, S.D.
Figure 3.
Figure 3.
ATIII with a single free thiol is retained in the ER. A, ATIII Cys-less and ATIII single-Cys mutants were expressed in CHO cells. Cells were radiolabeled with [35S]Cys/Met for 30 min and chased for the indicated times. At each time point, cell lysate and media were collected and processed as described in the legend to Fig. 1A. Samples were resolved by both reducing (R) and nonreducing (NR) 9% SDS-PAGE. B, quantification from A. Asterisks, statistical significance relative to Cys-less. All experiments are representative of three individual experiments. Error bars, S.D.
Figure 4.
Figure 4.
ATIII C247A/C430A is retained and diffuse throughout the ER. A, ATIII WT, ATIII Cys-less, and ATIII C247A/C430A were expressed in CHO cells. Cells were fixed in buffer containing 3.7% formaldehyde; permeabilized in buffer containing 0.1% Triton X-100; and stained using anti-Myc antibodies, KDEL, and giantin primary antibodies, as indicated, goat anti-mouse IgG secondary antibody, and DAPI. Cells were imaged using a confocal epifluorescence microscope at ×100 oil immersion. B, ATIII WT, ATIII Cys-less, and ATIII C247A/C430A were expressed in CHO cells. Cells were lysed in MNT. Media and lysate fractions were collected and split equally between DTT-treated and -nontreated fractions. Sucrose gradients were generated by solubilizing sucrose into MNT, and a 10–40% gradient was established. Samples were then laid on top of the sucrose gradient. Gradients were then centrifuged at 38,000 rpm for 18 h. Samples were taken from the gradient by pipetting 1 ml from the top of the gradient. Samples were TCA-precipitated and then resolved on a 9% reducing SDS-PAGE and imaged by Western blotting with Myc tag antibody.
Figure 5.
Figure 5.
Retention of C247A/C430A in the ER does not require UGGT1. A, ATIII variants were expressed in MI8-5 CHO cells. 30 min prior to the pulse and throughout the chase, cells were treated with 0.5 mm DNJ. Cells were radiolabeled with [35S]Cys/Met for 30 min and chased for the indicated times. At each time point, cells were lysed in MNT buffer. 80% of the cell lysate was affinity-purified with GSH S-transferase–tagged calreticulin (GST-CRT), whereas 20% of the cell lysate was immunopurified with anti-Myc antibody. GST-tagged calreticulin affinity purifications were then eluted in buffer containing 1% SDS, diluted in MNT, and immunopurified using anti-Myc tag antibody. Samples were resolved by reducing 9% SDS-PAGE. B, quantification of reglucosylation in A. Percentage reglucosylation for each ATIII variant was calculated by quantifying the bands corresponding to ATIII, multiplying the lysate band by 4, and dividing the amount of ATIII in the sequential IP by the amount of ATIII in the nonsequential IP at each time point. All reglucosylation values are normalized to WT ATIII. C, same as A, except DNJ was added 15 min prior to each time point, not throughout the experiment. D, quantification of reglucosylation in C. Percentage reglucosylation was calculated as described in B. E, ATIII and ATIII C247A/C430A were expressed in both WT and UGGT1−/− MEF cells. Cells were radiolabeled with [35S]Cys/Met for 30 min and chased for the indicated times. At each time point, cell lysate and media were collected and processed as described in the legend to Fig. 1A. F, quantification of ATIII secretion from E. The lysate and media were quantified, and ATIII secretion is presented as a percentage of ATIII in the media to ATIII in the 0-h lysate. All experiments are representative of three independent experiments. Error bars, S.D.
Figure 6.
Figure 6.
ATIII C247A/C430A is poorly degraded. A, ATIII WT and disulfide mutants were expressed in CHO cells. Cells were radiolabeled with [35S]Cys/Met for 30 min and chased for the indicated times. At each time point, cell lysate, media, and Triton X-100–insoluble fractions were collected and processed as described in the legend to Fig. 1A. B, quantification of A. The percentage of each protein remaining was calculated by quantifying ATIII present in each fraction of the reducing gel and dividing by the amount of ATIII immediately after the chase (0 h). The amount of protein in the indicated fraction at each time point is represented as a fraction of the total amount of protein present at that time point. All experiments are representative of three independent experiments. Error bars, S.D.
Figure 7.
Figure 7.
IRE-1 but not ATF6 or PERK is activated by ATIII overexpression. A, ATIII variants and A1AT NHK were expressed in CHO cells for 24 h. Control cells were treated with DMSO or Tm for 24 h. Cells were lysed, and RNA was collected. cDNA was generated and amplified via PCR using XPB-1–specific primers. B, ATIII variants and A1AT NHK were expressed in CHO cells for 24 h. Control cells were treated with either DMSO or Tm for 24 h. Cells were then lysed with MNT and TCA-precipitated. 5% whole-cell lysate was then resolved on a 9% SDS-PAGE and imaged by Western blotting using anti-Myc antibody (ATIII), anti-PERK antibody, and anti-A1AT antibody. C, ATIII variants and A1AT NHK were expressed in CHO cells for 24 h. Control cells were treated with either DMSO or Tm for 24 h. Cells were then lysed with MNT and TCA-precipitated. 5% whole-cell lysate was then resolved on a 9% SDS-PAGE and imaged by Western blotting using the indicated antibodies. D, quantification of B. Relative BiP expression was calculated by normalizing all BiP levels to DMSO, using GAPDH as a loading control. All experiments are representative of three independent experiments. Error bars, S.D.
Figure 8.
Figure 8.
ATIII C247A/C430A binds poorly to EDEM1, EDEM2, and EDEM3. A, FLAG-tagged EDEM1 was co-expressed with Myc-tagged ATIII WT, Myc-tagged ATIII C247A/C430A, and A1AT NHK in CHO cells, as indicated. Cells were radiolabeled with [35S]Cys/Met for 30 min and chased for the indicated times. Cells were lysed in MNT buffer. Lysates were then split equally and immunoprecipitated with either anti-Myc, FLAG, or A1AT antibodies, as indicated. Samples were resolved by reducing 9% SDS-PAGE and imaged by phosphorimaging. EDEM1 is denoted by an asterisk, whereas ATIII and A1AT NHK are denoted by a filled circle. B, quantification of EDEM1 co-immunoprecipitation from A. Percentage co-immunoprecipitation was determined by dividing the amount of EDEM1 immunoprecipitated by ATIII or NHK by total EDEM1. C–F, either FLAG-tagged EDEM2 or HA-tagged EDEM3 was co-expressed with Myc-tagged ATIII WT, Myc-tagged ATIII C247A/C430A, and A1AT NHK in CHO cells. Lysates were treated the same as in previous panels and immunoprecipitated using the indicated antibodies. Quantifications were conducted as described in B. All experiments are representative of three independent experiments. Error bars, S.D.
Figure 9.
Figure 9.
ATIII quality control model. Substrate features are generally understood to dictate the ER quality control pathways substrates engage, as depicted by arrows corresponding to different combinations of substrate features traversing quality control pathways. ATIII does not follow expected quality control pathways, but rather engages only the thiol-dependent quality control.

References

    1. Lamriben L., Graham J. B., Adams B. M., and Hebert D. N. (2016) N-Glycan-based ER molecular chaperone and protein quality control system: the calnexin binding cycle. Traffic 17, 308–326 10.1111/tra.12358 - DOI - PMC - PubMed
    1. Lederkremer G. Z. (2009) Glycoprotein folding, quality control and ER-associated degradation. Curr. Opin. Struct. Biol. 19, 515–523 10.1016/j.sbi.2009.06.004 - DOI - PubMed
    1. Kozutsumi Y., Segal M., Normington K., Gething M.-J., and Sambrook J. (1988) The presence of malfolded proteins in the endoplasmic reticulum signals the induction of glucose-regulated proteins. Nature 332, 462–464 10.1038/332462a0 - DOI - PubMed
    1. Hwang J., and Qi L. (2018) Quality control in the endoplasmic reticulum: crosstalk between ERAD and UPR pathways. Trends Biochem. Sci. 43, 593–605 10.1016/j.tibs.2018.06.005 - DOI - PMC - PubMed
    1. McCracken A. A., and Brodsky J. L. (1996) Assembly of ER-associated protein degradation in vivo: dependence on cytosol, calnexin and ATP. J. Cell Biol. 132, 291–298 10.1083/jcb.132.3.291 - DOI - PMC - PubMed

Publication types

LinkOut - more resources