. 2019 Dec;30(4):50-57.
doi: 10.7171/jbt.19-3004-002.

Top-Down ETD-MS Provides Unreliable Quantitation of Methionine Oxidation

Affiliations

Top-Down ETD-MS Provides Unreliable Quantitation of Methionine Oxidation

Surendar Tadi et al. J Biomol Tech. 2019 Dec.

Abstract

Methionine oxidation plays a critical role in many processes of biologic and biomedical importance, including cellular redox responses and stability of protein pharmaceuticals. Bottom-up methods for analysis of methionine oxidation can suffer from incomplete sequence coverage, as well as an inability to readily detect correlated oxidation between 2 or more methionines. However, the methodology for quantifying protein oxidation in top-down analyses is lacking. Previous work has shown that electron transfer dissociation (ETD)-based tandem mass spectrometry (MS/MS) fragmentation offers accurate and precise quantification of amino acid oxidation in peptides, even in complex samples. However, the ability of ETD-based MS/MS fragmentation to accurately quantify amino acid oxidation of proteins in a top-down manner has not been reported. Using apomyoglobin and calmodulin as model proteins, we partially converted methionines into methionine sulfoxide by incubation in H2O2. Using top-down ETD-based fragmentation, we quantified the amount of oxidation of various ETD product ions and compared the quantified values with those from traditional bottom-up analysis. We find that overall quantification of methionine oxidation by top-down MS/MS ranges from good agreement with traditional bottom-up methods to vast differences between the 2 techniques, including missing oxidized product ions and large differences in measured oxidation quantities. Care must be taken in transitioning ETD-based quantitation of oxidation from the peptide level to the intact protein level.

Keywords: hydroxyl radical protein footprinting; post-translational modification; proteomics.


Figures

FIGURE 1
FIGURE 1
A) Deconvoluted mass spectrum of unoxidized intact apomyoglobin (inset: +23 charge state). All detected charge states showed no significant oxidized protein. B) Bottom-up measurement of oxidation of M55 and M131 of apomyoglobin after 6 h of peroxide incubation. The level of oxidation in the peroxide-free control was subtracted to correct for artifactual oxidation from the digestion and LC-MS process.
FIGURE 2
FIGURE 2
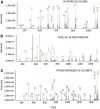
ETD MS/MS spectra of oxidized peptides from bottom-up analysis, as annotated by Byonic and validated manually. A, B) Representative ETD spectrum of singly oxidized peptides containing M55. C) Representative ETD spectrum of singly oxidized peptide containing M131. In no case was oxidation of any amino acid other than the 2 methionines detected at a level of 1% or higher.
FIGURE 3
FIGURE 3
Deconvoluted mass spectrum of intact protein apomyoglobin after peroxide incubation for 6 h (inset: +23 charge state). All detected charge states reflected a similar distribution of oxidation products.
FIGURE 4
FIGURE 4
ETD-based top-down analysis of all oxidized and unoxidized forms of the +23 charge state of apomyoglobin after peroxide oxidation for 6 h. A) Sequence coverage of apomyoglobin. Ions labeled in red were only detected as unoxidized. Ions labeled in green were detected in both oxidized and unoxidized forms and were used for oxidation quantification. Ions labeled in black were undetected or had insufficient intensity for quantification. B) Oxidation of c-ions, as measured based on oxidized vs. total product ion intensity for C55 and C59. Red hashed line represents the mean oxidation of M55 based on bottom-up data; error bars indicate 1 sd. C) Oxidation of z-ions as measured based on oxidized vs. unoxidized product ion intensity. Red hashed line represents the mean oxidation of M131 based on bottom-up data. D) Mean of all values of oxidation taken for M55 and M131 by top-down analysis (red), compared with (blue) values of oxidation from bottom-up analysis (blue).
FIGURE 5
FIGURE 5
ETD-based top-down analysis of all oxidized and unoxidized forms of the +27 charge state of apomyoglobin after peroxide oxidation overnight to yield comparable overall levels of oxidation to the previous sample. A) Sequence coverage of apomyoglobin. Ions labeled in red were only detected as unoxidized. Ions labeled in green were detected in both oxidized and unoxidized forms and were used for oxidation quantification. Ions labeled in black were undetected or had insufficient intensity for quantification. B) Oxidation of c-ions, as measured based on oxidized vs. total product ion intensity for C58 and C59. Red hashed line represents the mean oxidation of M55 based on bottom-up data from a 6-h peroxide oxidation; error bars indicate 1 sd. C) Oxidation of z-ions as measured based on oxidized vs. unoxidized product ion intensity. Red hashed line represents the mean oxidation of M131 based on bottom-up data from a 6-h peroxide oxidation. D) Mean of all values of oxidation taken for M55 and M131 by top-down analysis.
FIGURE 6
FIGURE 6
Bottom-up measurement of oxidation of calmodulin after 1 h of peroxide incubation. The level of oxidation in the peroxide-free control was subtracted to correct for artifactual oxidation from the digestion and LC-MS process.
FIGURE 7
FIGURE 7
Deconvoluted mass spectrum of the intact protein calmodulin after peroxide incubation for 1 hr (inset: +15 charge state). All detected charge states reflected a similar distribution of oxidation products.
FIGURE 8
FIGURE 8
ETD-based top-down analysis of all oxidized and unoxidized forms of the +15 charge state of calmodulin after peroxide oxidation for 1 hr. A) Sequence coverage of calmodulin. Ions labeled in red were only detected as unoxidized. Ions labeled in green were detected in both oxidized and unoxidized forms and were used for oxidation quantification. Ions labeled in black were undetected or had insufficient intensity for quantification. B) Oxidation of c-ions, as measured based on oxidized vs. total product ion intensities. Red hashed line represents the mean total oxidation of M71, M72, and M76 based on bottom-up data; error bars indicate 1 sd. C) Mean of all values of oxidation taken for M76 from top-down analysis and bottom-up analysis.

Similar articles

Cited by

References

    1. Dean RT, Fu S, Stocker R, Davies MJ. Biochemistry and pathology of radical-mediated protein oxidation. Biochem J. 1997;324:1–18. - PMC - PubMed
    1. Hoshi T, Heinemann S. Regulation of cell function by methionine oxidation and reduction. J Physiol. 2001;531:1–11. - PMC - PubMed
    1. Levine RL, Mosoni L, Berlett BS, Stadtman ER. Methionine residues as endogenous antioxidants in proteins. Proc Natl Acad Sci USA. 1996;93:15036–15040. - PMC - PubMed
    1. Janssen-Heininger YMW, Mossman BT, Heintz NH, et al. . Redox-based regulation of signal transduction: principles, pitfalls, and promises. Free Radic Biol Med. 2008;45:1–17. - PMC - PubMed
    1. Berlett BS, Stadtman ER. Protein oxidation in aging, disease, and oxidative stress. J Biol Chem. 1997;272:20313–20316 - PubMed

Publication types

MeSH terms

LinkOut - more resources