. 2020 Jan;19(1):e13054.
doi: 10.1111/acel.13054. Epub 2019 Oct 30.

Activation of PKA/SIRT1 signaling pathway by photobiomodulation therapy reduces Aβ levels in Alzheimer's disease models

Affiliations

Activation of PKA/SIRT1 signaling pathway by photobiomodulation therapy reduces Aβ levels in Alzheimer's disease models

Zhan Zhang et al. Aging Cell. 2020 Jan.

Abstract

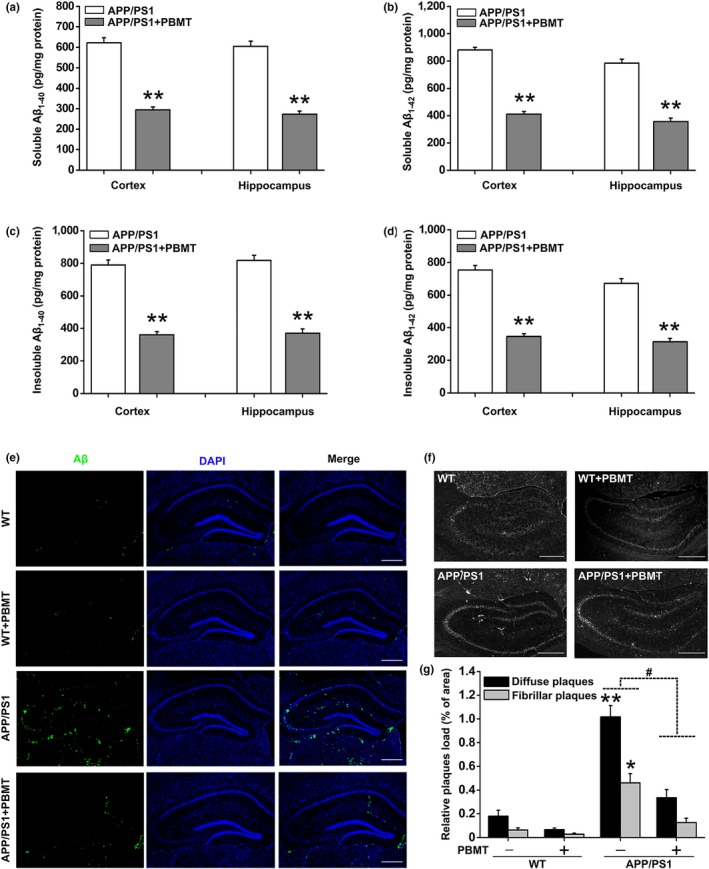
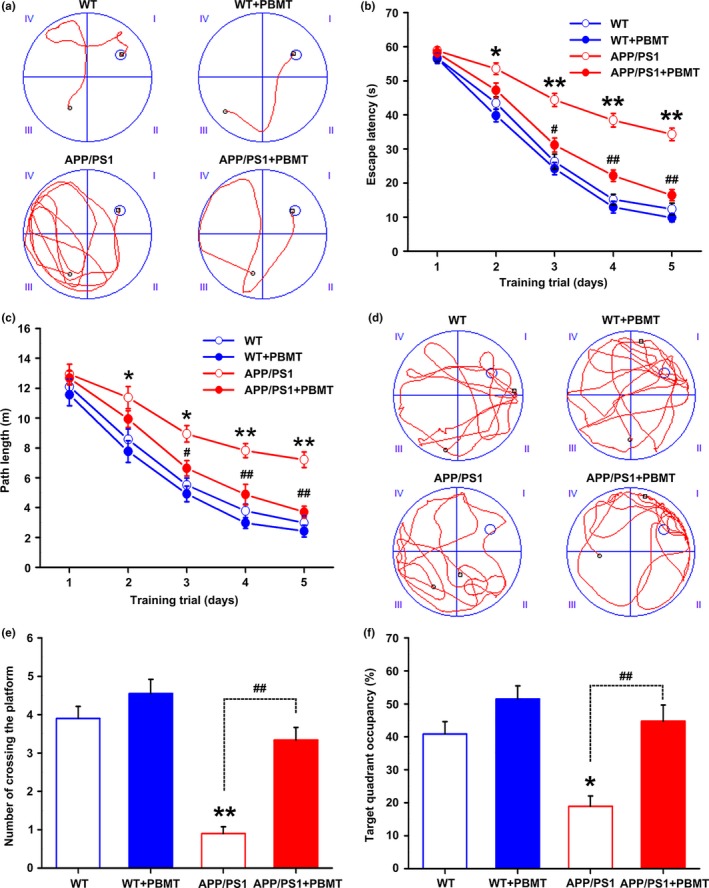
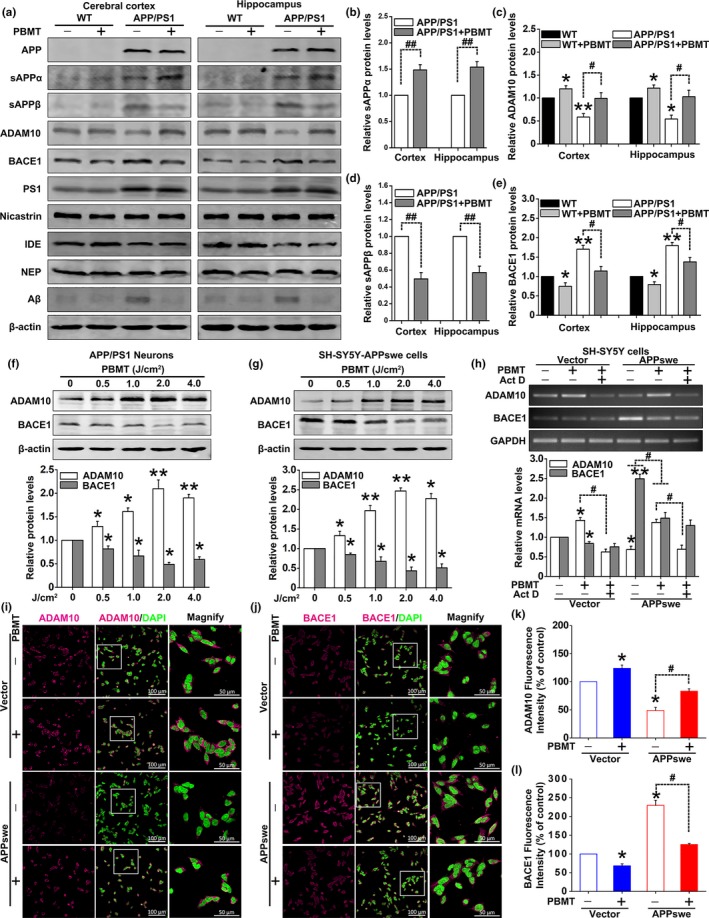
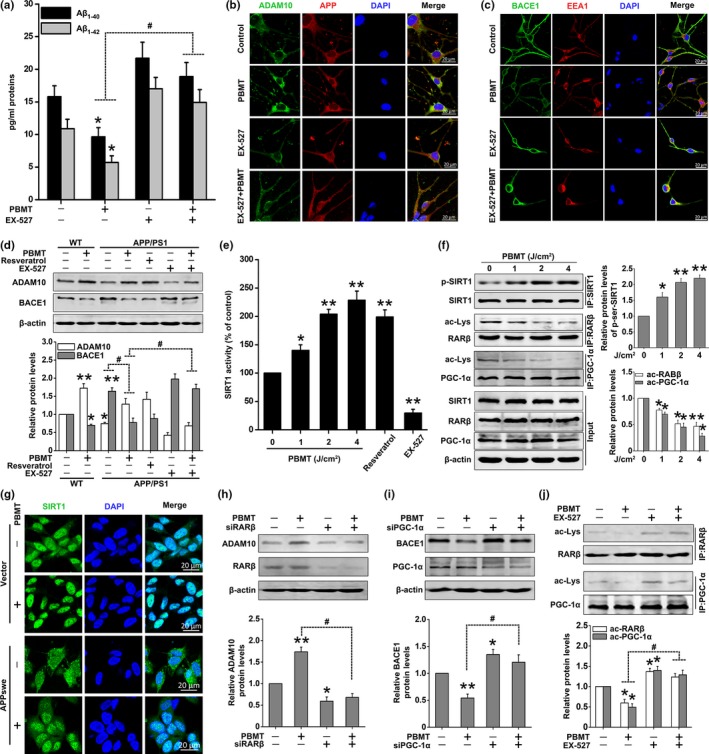
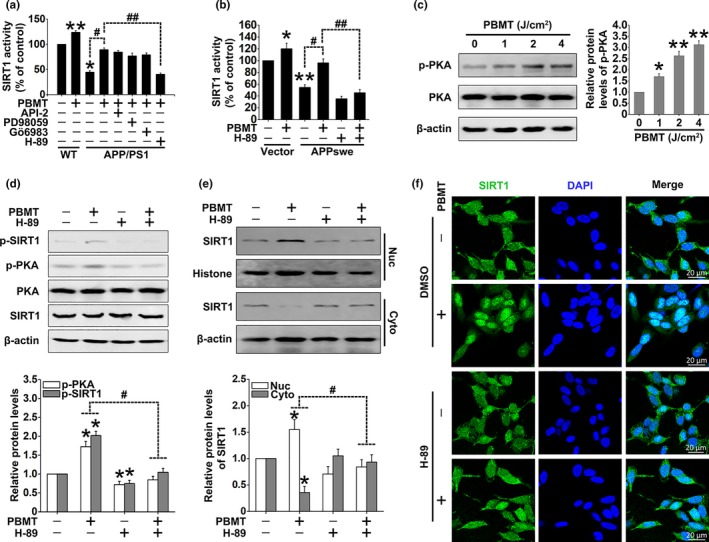
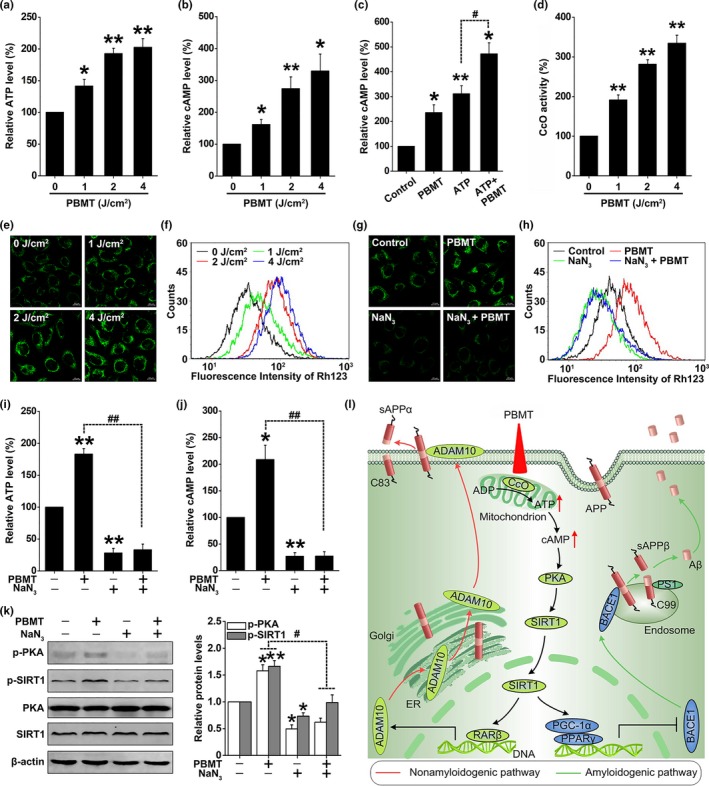
A hallmark of Alzheimer's disease (AD) is the accumulation of amyloid-β (Aβ), which correlates significantly with progressive cognitive deficits. Although photobiomodulation therapy (PBMT), as a novel noninvasive physiotherapy strategy, has been proposed to improve neuronal survival, decrease neuron loss, ameliorate dendritic atrophy, and provide overall AD improvement, it remains unknown whether and how this neuroprotective process affects Aβ levels. Here, we report that PBMT reduced Aβ production and plaque formation by shifting amyloid precursor protein (APP) processing toward the nonamyloidogenic pathway, thereby improving memory and cognitive ability in a mouse model of AD. More importantly, a pivotal protein, SIRT1, was involved in this process by specifically up-regulating ADAM10 and down-regulating BACE1, which is dependent on the cAMP/PKA pathway in APP/PS1 primary neurons and SH-SY5Y cells stably expressing human APP Swedish mutation (APPswe). We further found that the activity of the mitochondrial photoacceptor cytochrome c oxidase (CcO) was responsible for PBMT-induced activation of PKA and SIRT1. Together, our research suggests that PBMT as a viable therapeutic strategy has great potential value in improving cognitive ability and combatting AD.

Keywords: APP processing; Alzheimer's disease; SIRT1; amyloid-β; cAMP/PKA pathway; photobiomodulation therapy.


Conflict of interest statement

None declared.

Figures

Figure 1
Figure 1
PBMT reduces cerebral Aβ levels and amyloid plaque burden in APP/PS1 transgenic mice. (a–d) Cerebral cortex and hippocampus Aβ measurements were performed by ELISA. APP/PS1 mice (n = 7) under PBMT treatment showed dramatic reductions in the levels of soluble Aβ1‐40 (a) and Aβ1‐42 (b), insoluble Aβ1‐40 (c) and Aβ1‐42 (d) compared with control transgenic mice (n = 7). (e) Representative images immunostained with Aβ‐specific 6E10 antibody in the brain of PBMT‐treated WT and APP/PS1 mice (n = 5). Scale bar: 300 μm. (f) Representative images of thioflavin T‐stained senile plaques in the brains of different groups of mice (n = 5). Scale bar: 300 μm. (g) The values in the bar graph are expressed in the percentage area occupied by diffuse plaques and fibrillar plaques. All the data are reported as mean ± SEM. *p < 0.05 and **p < 0.01 versus the control group; #p < 0.05 versus the indicated group
Figure 2
Figure 2
PBMT improves spatial learning and memory of APP/PS1 mice in the MWM. (a) Representative swimming traces on day 5 during the place navigation trial showing the effects of PBMT on the spatial memory of WT and APP/PS1 mice. (b) The escape latency of mice to find the hidden platform was recorded on each training day. (c) Mean distance per day for path length was shown during acquisition of the hidden platform task. (d) Representative swimming traces of the four groups of mice exhibited after the training trial. (e) The number of crossing the platform during a 60‐s probe trial of MWM test. (f) Percentage of time spent in target quadrant of the original platform position. All the data are reported as mean ± SEM. n = 9 animals per group. *p < 0.05 and **p < 0.01 versus the WT group; #p < 0.05 and ##p < 0.01 versus the APP/PS1 group
Figure 3
Figure 3
Effects of PBMT on APP processing in vivo and in vitro. (a) Representative Western blot bands of Aβ, APP, sAPPα, sAPPβ, ADAM10, BACE1, PS1, nicastrin, IDE, and NEP in the cerebral cortex and hippocampus of WT and APP/PS1 mice (n = 5), whether or not with PBMT. (b–e) Densitometric quantification of exogenous human sAPPα (b) and sAPPβ (d), endogenous mouse ADAM10 (c) and BACE1 (e) expressions after indicated treatments. (f, g) Representative Western blot assays for detecting the dose‐dependent effects of PBMT on endogenous ADAM10 and BACE1 expressions in APP/PS1 neurons (f) and SH‐SY5Y‐APPswe cells (g). (h) ADAM10 and BACE1 mRNA levels were detected by PCR stimulated with PBMT in the presence of Act D (10 μM) in SH‐SY5Y cells. (i, j) Representative immunofluorescent images of ADAM10 (i) and BACE1 (j) in SH‐SY5Y cells. Staining with DAPI to visualize nucleus. (k, l) The fluorescence intensity data of ADAM10 (k) and BACE1 (l) were recorded by confocal microscopy. All the data are reported as mean ± SEM of four independent experiments. *p < 0.05 and **p < 0.01 versus the control group; #p < 0.05 and ##p < 0.01 versus the indicated group
Figure 4
Figure 4
PBMT‐induced SIRT1‐coupled RARβ and PGC‐1α deacetylations are responsible for ADAM10 and BACE1 expressions, respectively. (a) EX‐527 (20 μM) blocked the effects of PBMT in which Aβ1‐40 and Aβ1‐42 released into the culture media are reduced, in APP/PS1 neurons. (b) Representative immunofluorescent images of ADAM10 in APP/PS1 neurons. Staining with DAPI to visualize the nucleus. (c) Representative immunofluorescent images of BACE1 in APP/PS1 neurons. Staining with EEA1 antibody to visualize endosome. (d) Western blot analysis of ADAM10 and BACE1 expressions after treatment with PBMT in the presence of EX‐527 (20 μM) and resveratrol (20 μM) in primary neurons. (e) Relative SIRT1 deacetylase activity for detecting the dose‐dependent effects of PBMT in APP/PS1 neurons. EX‐527 was used as a negative control, and resveratrol was used as a positive control. (f) Immunoprecipitates were analyzed for detecting the dose‐dependent effects of PBMT on p‐SIRT1, ac‐RARβ, and ac‐PGC‐1α levels in SH‐SY5Y‐APPswe cells. (g) Representative immunofluorescent images of SIRT1 in SH‐SY5Y cells. (h, i) Western blot analysis of ADAM10 expression after treatment with RARβ siRNA (h) and BACE1 expression after treatment with PGC‐1α siRNA (i) in PBMT‐treated SH‐SY5Y‐APPswe cells. (j) Immunoprecipitates were analyzed for detecting ac‐RARβ and ac‐PGC‐1α levels after treatment with EX‐527 in PBMT‐treated SH‐SY5Y‐APPswe cells. All the data are reported as mean ± SEM of four independent experiments. *p < 0.05 and **p < 0.01 versus the control group; #p < 0.05 versus the indicated group
Figure 5
Figure 5
PBMT enhances SIRT1 activity via the cAMP/PKA pathway. (a) SIRT1 activity assay kit was used to detect SIRT1 deacetylase activity after treatment with PBMT in the presence of API‐2 (2 μM), PD98059 (1 μM), Gӧ6983 (20 μM), and H‐89 (20 μM) in neurons. (b) SIRT1 deacetylase activity was detected after the indicated treatments in SH‐SY5Y cells. (c) Representative Western blot assay for detecting the dose‐dependent effects of PBMT on p‐PKA in APP/PS1 neurons. (d) Representative Western blot assay for detecting the levels of p‐PKA and p‐SIRT1 after treatment with H‐89 in SH‐SY5Y‐APPswe cells. (e) Representative Western blot assay for detecting the levels of SIRT1 after indicated treatments in cytoplasm (Cyto) and nuclear (Nuc) lysates of SH‐SY5Y‐APPswe cells, respectively. (f) Representative immunofluorescent images of SIRT1 (green) in SH‐SY5Y‐APPswe cells under the indicated treatments. Staining with DAPI (blue) to visualize nucleus. All the data are reported as mean ± SEM of four independent experiments. *p < 0.05 and **p < 0.01 versus the control group; #p < 0.05 and ##p < 0.01 versus the indicated group
Figure 6
Figure 6
PBMT enhances mitochondrial photoacceptor CcO activity, increases ATP and cAMP levels, and further activates PKA/SIRT1 pathway in SH‐SY5Y‐APPswe cells. (a, b) SH‐SY5Y‐APPswe cells were treated with 0, 1, 2, and 4 J/cm2 PBMT. Relative ATP (a) and cAMP (b) levels were calculated as the percentage of the 0 J/cm2 dose level. (c) Relative cAMP content of SH‐SY5Y‐APPswe cells was determined after PBMT (2 J/cm2), with or without ATP (100 μM). (d) The measurement of CcO activity was determined in SH‐SY5Y‐APPswe cells under 0, 1, 2, and 4 J/cm2 PBMT. (e, f) The mitochondrial membrane potential (ΔΨmt) was detected by confocal microscopy (e) and flow cytometry (f) in Rhodamine 123 (Rh123) labeling SH‐SY5Y‐APPswe cells with indicated treatments. (g, h) ΔΨmt was detected by confocal microscopy (g) and flow cytometry (h) in Rh123 labeling SH‐SY5Y‐APPswe cells after treatment with NaN3 (10 mM). (i, j) SH‐SY5Y‐APPswe cells were treated with NaN3. Relative ATP (i) and cAMP (j) levels were calculated as the percentage of the control group level. (k) Western bolt analysis of p‐PKA and p‐SIRT1 levels after treatment with NaN3 in PBMT‐treated SH‐SY5Y‐APPswe cells. (l) Schematic representation of the signaling pathway for PBMT reducing Aβ levels by activating the PKA/SIRT1 signaling pathway. All the data are reported as mean ± SEM of four independent experiments. *p < 0.05 and **p < 0.01 versus the control group; #p < 0.05 and ##p < 0.01 versus the indicated group

References

    1. Anders, J. J. , Borke, R. C. , Woolery, S. K. , & Van de Merwe, W. P. (1993). Low power laser irradiation alters the rate of regeneration of the rat facial nerve. Lasers in Surgery and Medicine, 13, 72–82. 10.1002/lsm.1900130113 - DOI - PubMed
    1. Bachurin, S. O. , Bovina, E. V. , & Ustyugov, A. A. (2017). Drugs in clinical trials for Alzheimer's Disease: The major trends. Medicinal Research Reviews, 37, 1186–1225. 10.1002/med.21434 - DOI - PubMed
    1. Billings, L. M. , Oddo, S. , Green, K. N. , McGaugh, J. L. , & LaFerla, F. M. (2005). Intraneuronal Abeta causes the onset of early Alzheimer's disease‐related cognitive deficits in transgenic mice. Neuron, 45, 675–688. - PubMed
    1. Donmez, G. (2012). The neurobiology of sirtuins and their role in neurodegeneration. Trends in Pharmacological Sciences, 33, 494–501. 10.1016/j.tips.2012.05.007 - DOI - PubMed
    1. Eells, J. T. , Wong‐Riley, M. T. , VerHoeve, J. , Henry, M. , Buchman, E. V. , Kane, M. P. , … Whelan, H. T. (2004). Mitochondrial signal transduction in accelerated wound and retinal healing by near‐infrared light therapy. Mitochondrion, 4, 559–567. 10.1016/j.mito.2004.07.033 - DOI - PubMed

Publication types