. 2020 May;33(3):466-479.
doi: 10.1111/pcmr.12841. Epub 2019 Nov 22.

Functional analysis of RPS27 mutations and expression in melanoma

Affiliations

Functional analysis of RPS27 mutations and expression in melanoma

Alfredo Floristán et al. Pigment Cell Melanoma Res. 2020 May.

Abstract

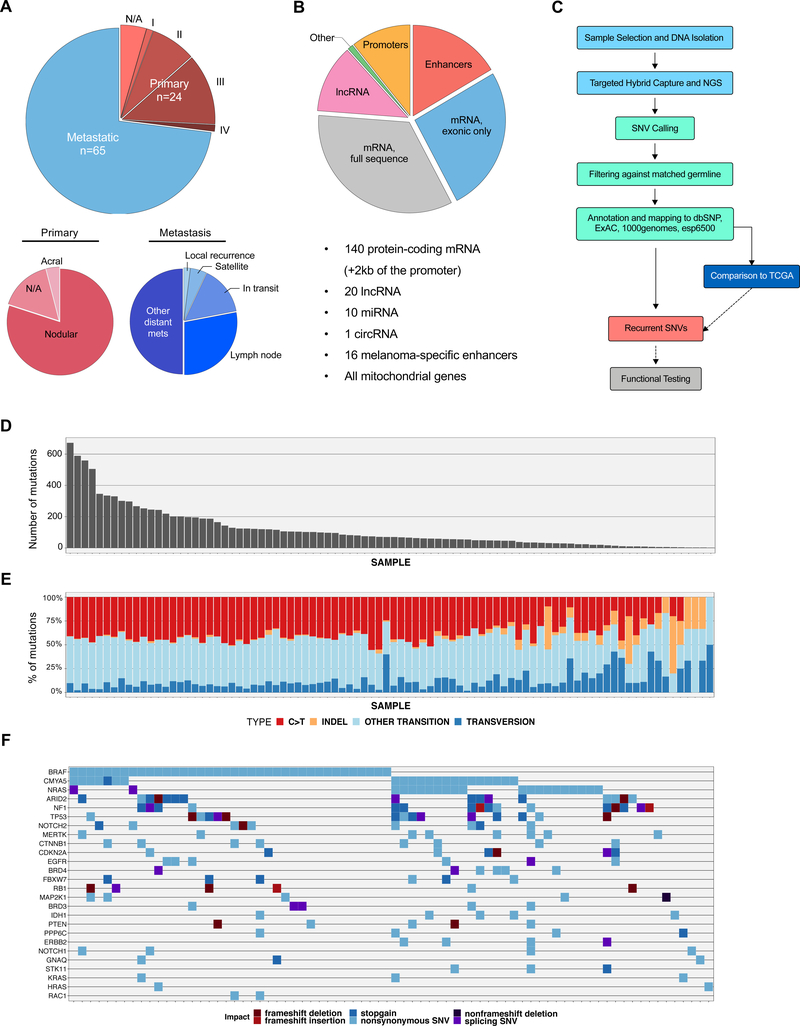
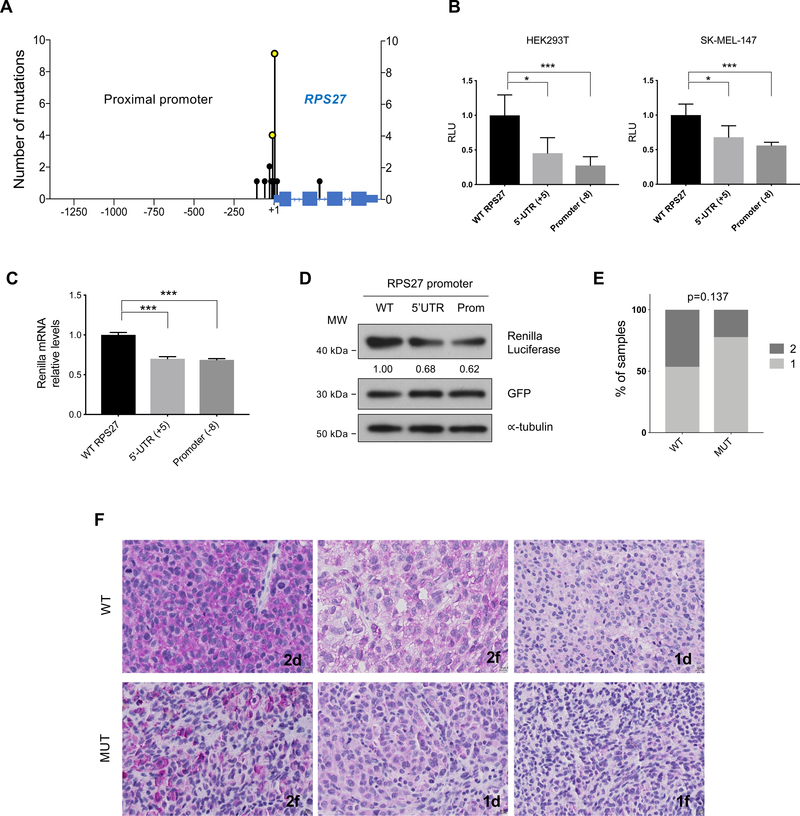
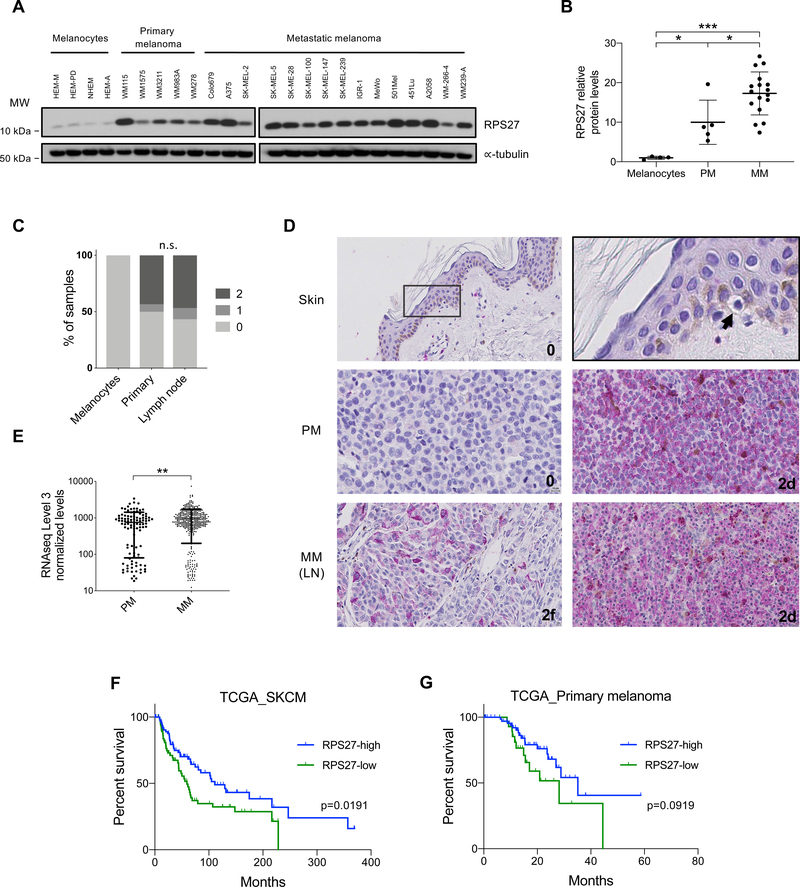
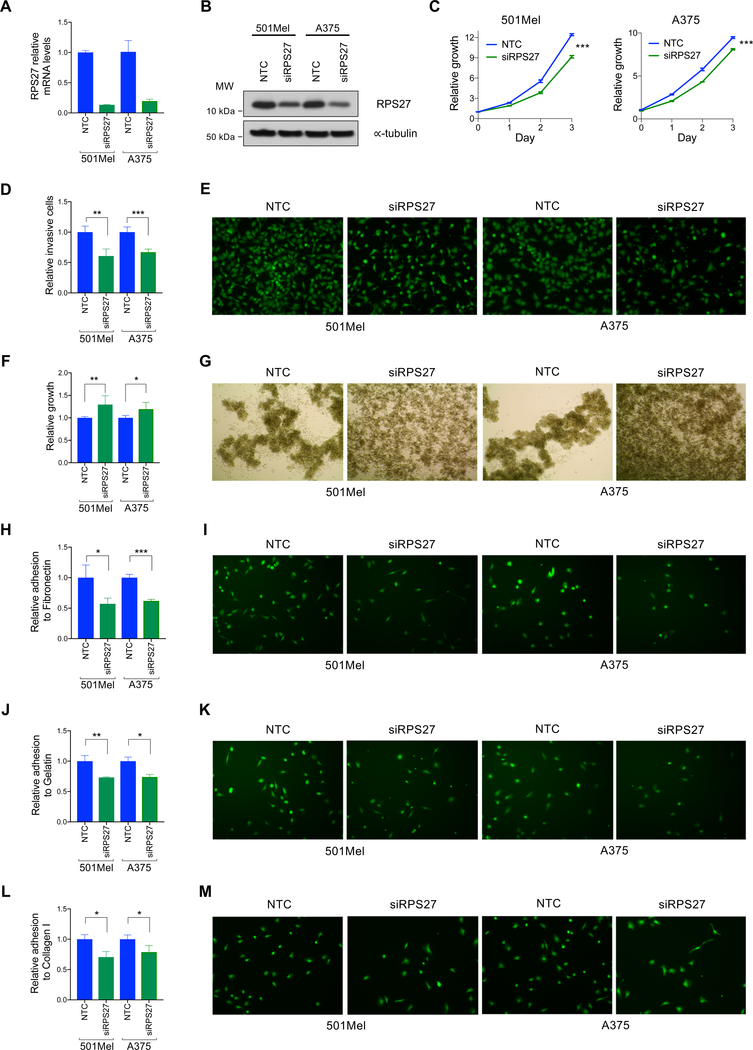
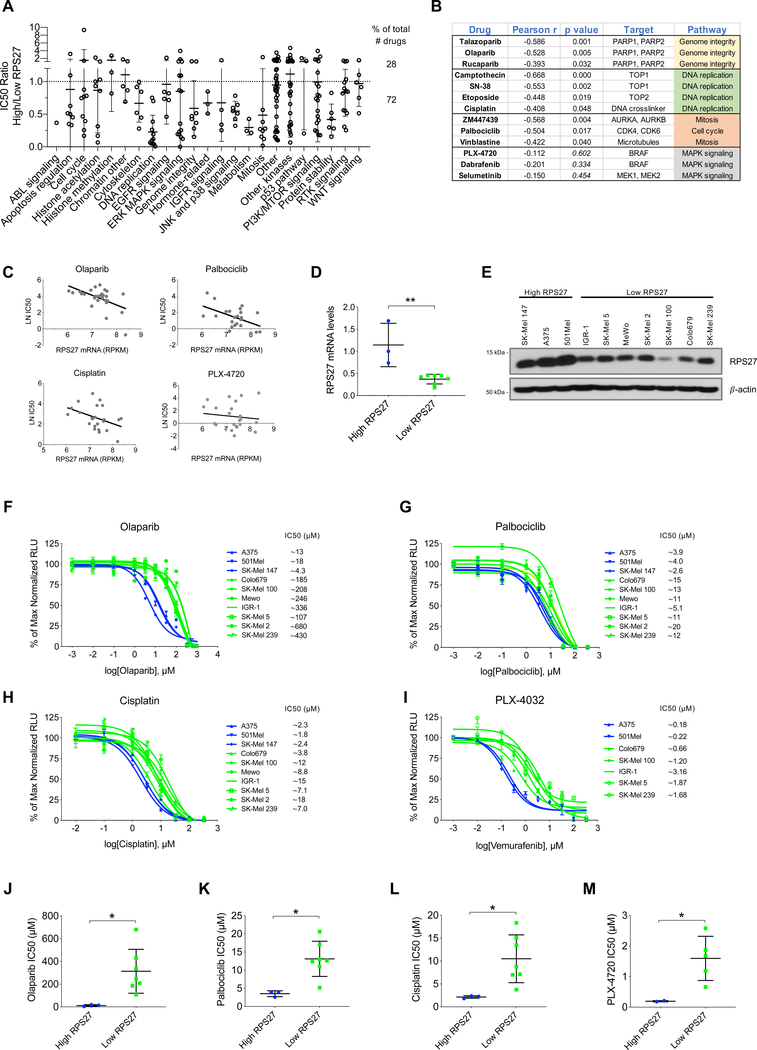
Next-generation sequencing has enabled genetic and genomic characterization of melanoma to an unprecedent depth. However, the high mutational background plus the limited depth of coverage of whole-genome sequencing performed on cutaneous melanoma samples make the identification of novel driver mutations difficult. We sought to explore the somatic mutation portfolio in exonic and gene regulatory regions in human melanoma samples, for which we performed targeted sequencing of tumors and matched germline DNA samples from 89 melanoma patients, identifying known and novel recurrent mutations. Two recurrent mutations found in the RPS27 promoter associated with decreased RPS27 mRNA levels in vitro. Data mining and IHC analyses revealed a bimodal pattern of RPS27 expression in melanoma, with RPS27-low patients displaying worse prognosis. In vitro characterization of RPS27-high and RPS27-low melanoma cell lines, as well as loss-of-function experiments, demonstrated that high RPS27 status provides increased proliferative and invasive capacities, while low RPS27 confers survival advantage in low attachment and resistance to therapy. Additionally, we demonstrate that 10 other cancer types harbor bimodal RPS27 expression, and in those, similarly to melanoma, RPS27-low expression associates with worse clinical outcomes. RPS27 promoter mutation could thus represent a mechanism of gene expression modulation in melanoma patients, which may have prognostic and predictive implications.

Keywords: RPS27; biomarker; drug resistance; high-throughput sequencing; non-coding; promoter analysis.


Conflict of interest statement

Conflict of interest

The authors declare no conflict of interest.

Figures

Figure 1.
Figure 1.
Description of the study population, gene targets, and sequencing workflow and data. (A) Patient population by tumor stage, clinical classification and tumor type (primary/metastatic). (B) Genomic target selection for the sequencing of 89 melanomas. The proportion distribution reflects the genomic size of each target type by the total number of bases sequenced. (C) Sequencing and analysis pipeline. (D) Number of somatic mutations per patient found in the NYU TGS cohort. (E) Distribution of mutations by type per patient from the NYU cohort. (F) Oncoprint of non-synomynous and splice-site SNVs and coding and splice-site InDels predicted to impact protein coding mRNA. Selected known and previously nominated melanoma-associated genes, in addition to novel genes, are included.
Figure 2.
Figure 2.
Description of the mutations found in RPS27 and analysis of their effect on gene expression. (A) Location (x-axis) and number of mutations (y-axis) detected in the RPS27 locus in the NYU TGS cohort. 1.3kb of the proximal promoter and the entire RPS27 gene are displayed. (B) Luciferase reporter assay of the RPS27 promoter (∼900 bp), using the WT and mutated constructs (at −8 and +5 bases from TSS). Error bars represent standard deviation of 5 independent experiments. (C) Quantitative PCR of Renilla luciferase mRNA expressed in HEK293T cells, using the same vectors as in (B). Renilla luciferase mRNA levels were relativized to GFP mRNA levels, control of transfection. Error bars represent SD. Data shows one of 3 independent experiments. (D) Renilla luciferase protein levels of HEK293T cells transfected with the reporter vectors (see B,C) analyzed by Western blot. For control of transfection, a vector expressing GFP was used. ∝-tubulin was used as loading control. Numbers represent the average quantification of Renilla luciferase from 3 independent experiments. (E) Percentage of WT (n=29) and MUT (n=9) melanoma samples from the TGS NYU cohort that present different levels of RPS27 protein expression, determined by IHC. Numbers 1 and 2 represent low and high RPS27 intensity, respectively. Fisher’s exact test was applied. (F) Representative 40x images of RPS27 IHC performed in metastatic melanoma patients from NYU TGS cohort. The percentage of positive cells is described by letters “d” (diffuse, >50%) and “f” (focal, <50%). ∗p < 0.05, ∗∗∗p < 0.001 by unpaired t-test.
Figure 3.
Figure 3.
Bimodal RPS27 expression in human melanoma. (A) RPS27 protein levels in cultured human epidermal melanocytes (neonatal, HEM-M and HEM-D; and adult, NHEM and HEM-A), primary and metastatic human melanoma cell lines, detected by Western blot. ∝-tubulin was used as loading control. (B) Quantification of RPS27 protein levels in (A), using Fiji software and normalized to ∝-tubulin. Data shows one representative experiment. ∗p < 0.05, ∗∗∗p < 0.001 by unpaired t-test. (C) Percentage of skin melanocytes, primary and lymph node melanoma samples from a tissue microarray (TMA) by level of RPS27 expression, determined by IHC. Numbers 0, 1 and 2 represent undetected, low and high RPS27 intensity, respectively. Fisher’s exact test was applied. (D) Representative 40x images of RPS27 IHC performed in the human melanoma TMA. Skin was zoomed 4x to show a melanocyte with undetected RPS27 expression (arrowhead). (E) RPS27 normalized mRNA levels in melanoma patients from TCGA (n=474), comparing primary and metastatic samples. ∗∗p < 0.01 by Mann-Whitney test. (F) Kaplan-Meier curves for overall survival of all PM and MM combined melanoma patients, stratified by expression of RPS27 (Top 20%, n=92; Low 20%, n=92). P-value was calculated using Log-rank test. (G) Kaplan-Meier curves for overall survival of primary melanoma patients, stratified by bimodal expression of RPS27 (Top, n=66; Low, n=34). P-value was calculated using Log-rank test.
Figure 4.
Figure 4.
RPS27 modulation impacts proliferation, invasion, adhesion and survival in low attachment conditions. (A) RPS27 mRNA levels of control (NTC) and siRNA transfected 501Mel and A375 cell lines, determined by quantitative PCR. Bars represent SD from one representative experiment. (B) Western blot detection of RPS27 protein levels in the control and silenced melanoma cell lines. ∝-tubulin was used as loading control. (C) Proliferation curves of cell lines characterized in (A,B). A representative experiment out of 3 is shown. (D) Invasive capacity of melanoma cells silenced for RPS27. Data shows the average of 4 independent experiments. Bars represent SD. (E) Representative 20x fluorescent images of invading 501Mel and A375 cells with RPS27 modulation. (F) Relative growth in low attachment of melanoma cell lines silenced for RPS27. Data shows the average of independent experiments (501Mel, n=6; A375, n=4). Bars represent SD. (G) Representative 4x images of the control and siRPS27 conditions growing in ultra-low attachment plates. (H,I,J,K,L,M) Relative cell adhesion to (H) gelatin, (J) fibronectin and (L) collagen I of melanoma cell lines silenced for RPS27. Representative fluorescent images of cells adhering to gelatin, fibronectin and collagen I are shown in (I), (K), and (M), respectively. Data shows the average of 3 independent experiments, with bars representing SD. ∗p < 0.05, ∗∗p < 0.01, ∗∗∗p < 0.001 by unpaired t-test.
Figure 5.
Figure 5.
RPS27 expression levels predict drug sensitivity in human melanoma cell lines. (A) Drug sensitivity in human cell lines from the Cancer Cell Line Encyclopedia (CCLE). Y-axis represents the ratio of the average IC50 of melanoma cell lines with high RPS27 vs cell lines with low RPS27 (25% top vs 25% bottom). X-axis shows the drug categories analyzed in Genomics of Drug Sensitivity in Cancer (GDSC). (B) Pearson’s correlation between RPS27 expression and IC50 for the indicated drugs. Two-tailed p-value is also included. (C) Examples of drugs that show negative Pearson’s correlation between RPS27 expression and sensitivity to the drug. (D) RPS27 relative mRNA levels in the 10 melanoma cell lines with high and low expression of the gene, determined by qRT-PCR. ∗∗p < 0.01 by unpaired t-test. (E) Western blot detection of RPS27 protein levels in cell lines from (D). β-actin was used as loading control. (F,G,H,I) Dose-response curves of the indicated drugs (olaparib, palbociclib, cisplatin, PLX-4032, respectively). IC50 for each cell line is shown next to the name in the legend. (J,K,L,M) Comparison of the average IC50 of human melanoma cell lines with high vs. low RPS27 levels, for the drugs (J) olaparib, (K) palbociclib, (L) cisplatin and (M) PLX-4032. Data is the average of independent experiments (olaparib, palbociclib and cisplatin, n=4; PXL-4032, n=3). ∗p < 0.05, by unpaired t-test.

Similar articles

Cited by

References

    1. Agrawal P, Fontanals-Cirera B, Sokolova E, Jacob S, Vaiana CA, Argibay D, … Hernando E. (2017). A Systems Biology Approach Identifies FUT8 as a Driver of Melanoma Metastasis. Cancer Cell, 31(6), 804–819 e807. doi:10.1016/j.ccell.2017.05.007 - DOI - PMC - PubMed
    1. Aran D, Sirota M, & Butte AJ (2015). Systematic pan-cancer analysis of tumour purity. Nat Commun, 6, 8971. doi:10.1038/ncomms9971 - DOI - PMC - PubMed
    1. Barretina J, Caponigro G, Stransky N, Venkatesan K, Margolin AA, Kim S, … Garraway LA (2012). The Cancer Cell Line Encyclopedia enables predictive modelling of anticancer drug sensitivity. Nature, 483(7391), 603–607. doi:10.1038/nature11003 - DOI - PMC - PubMed
    1. Cancer Genome Atlas N. (2015). Genomic Classification of Cutaneous Melanoma. Cell, 161(7), 1681–1696. doi:10.1016/j.cell.2015.05.044 - DOI - PMC - PubMed
    1. Caracausi M, Piovesan A, Antonaros F, Strippoli P, Vitale L, & Pelleri MC (2017). Systematic identification of human housekeeping genes possibly useful as references in gene expression studies. Mol Med Rep, 16(3), 2397–2410. doi:10.3892/mmr.2017.6944 - DOI - PMC - PubMed

Publication types

MeSH terms