. 2019 Oct 30:8:e50401.
doi: 10.7554/eLife.50401.

A proline-rich motif on VGLUT1 reduces synaptic vesicle super-pool and spontaneous release frequency

Affiliations

A proline-rich motif on VGLUT1 reduces synaptic vesicle super-pool and spontaneous release frequency

Xiao Min Zhang et al. Elife. .

Abstract

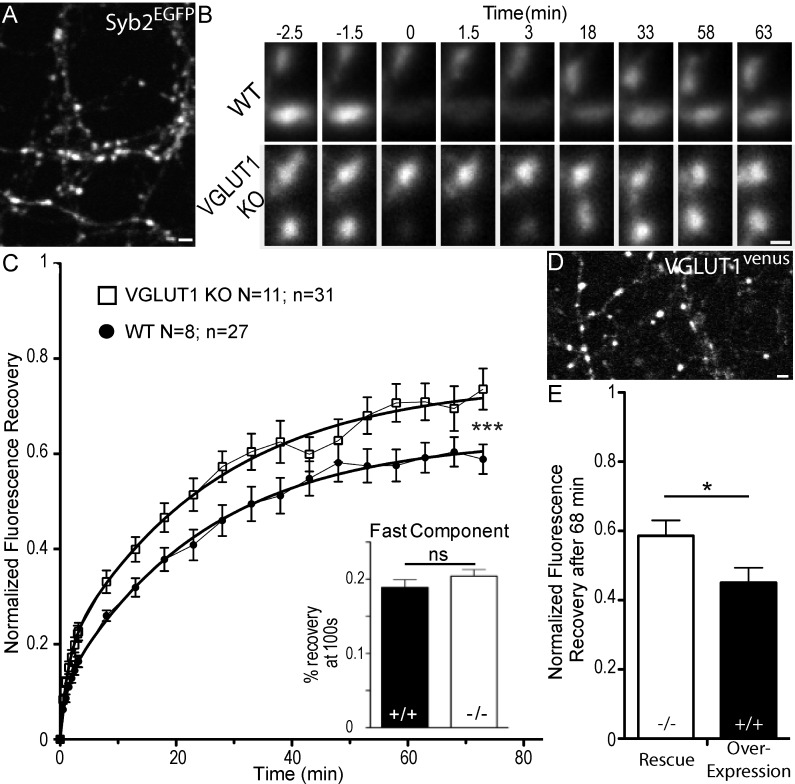
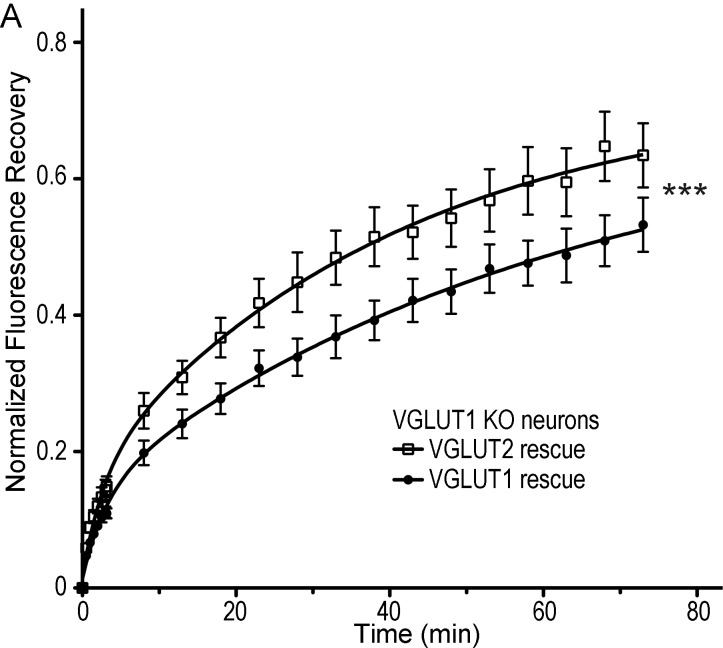
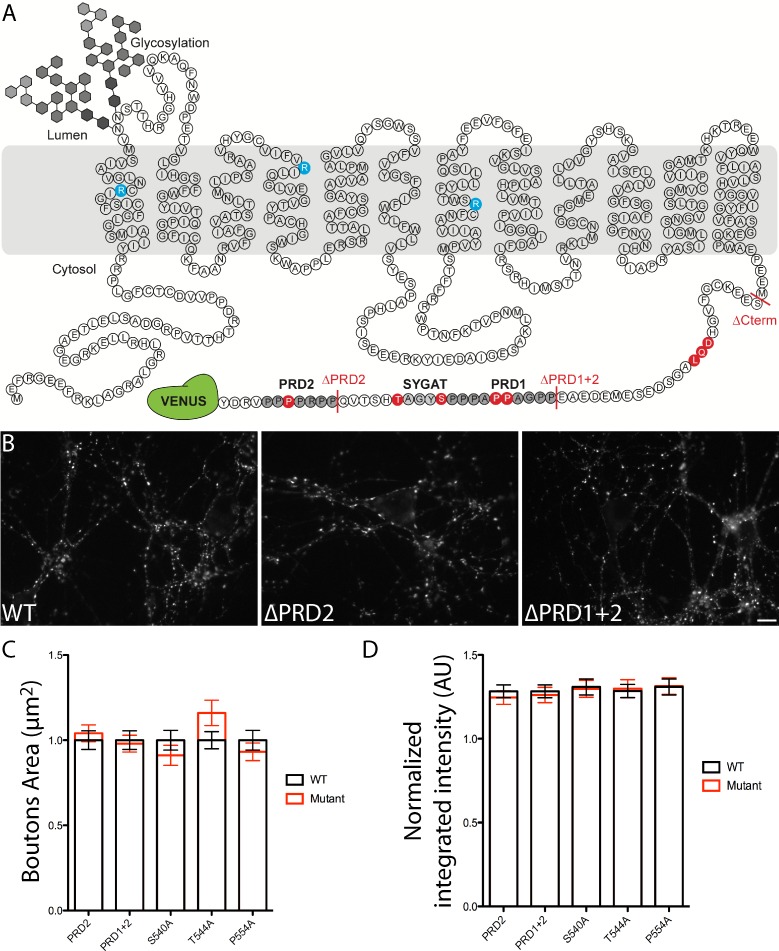
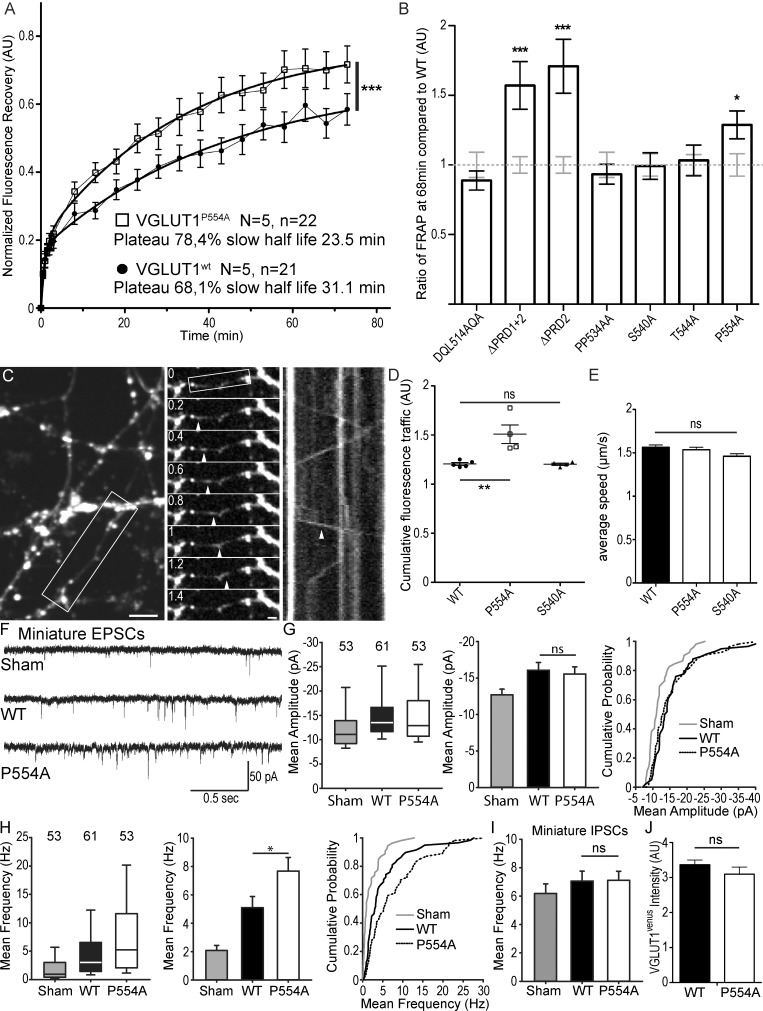
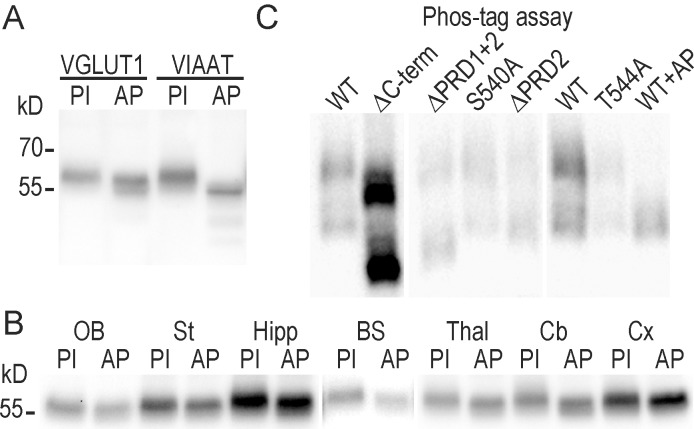
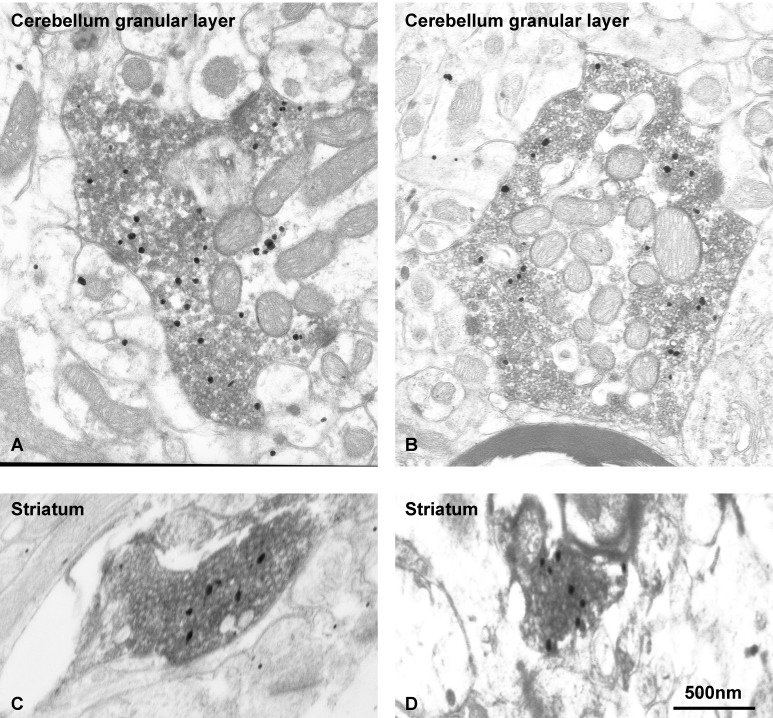
Glutamate secretion at excitatory synapses is tightly regulated to allow for the precise tuning of synaptic strength. Vesicular Glutamate Transporters (VGLUT) accumulate glutamate into synaptic vesicles (SV) and thereby regulate quantal size. Further, the number of release sites and the release probability of SVs maybe regulated by the organization of active-zone proteins and SV clusters. In the present work, we uncover a mechanism mediating an increased SV clustering through the interaction of VGLUT1 second proline-rich domain, endophilinA1 and intersectin1. This strengthening of SV clusters results in a combined reduction of axonal SV super-pool size and miniature excitatory events frequency. Our findings support a model in which clustered vesicles are held together through multiple weak interactions between Src homology three and proline-rich domains of synaptic proteins. In mammals, VGLUT1 gained a proline-rich sequence that recruits endophilinA1 and turns the transporter into a regulator of SV organization and spontaneous release.

Keywords: Vesicular Glutamate Transporter; axon; cell biology; liquid phase separation; mouse; neuroscience; neurotransmission; proline-rich domain; synaptic vesicle pools.


Conflict of interest statement

XZ, UF, KS, MA, MF, MM, CM, VB, FC, MD, SP, UM, AB, SW, SE, YH, EH No competing interests declared

Figures

Figure 1.
Figure 1.. Dose dependent regulation of SV super-pool size by VGLUT1.
(A) Expression of Synaptobrevin2 fused to Enhanced Green Fluorescent Protein (Syb2EGFP) in hippocampal neurons at 18 days in culture. (B) examples of FRAP sequences from both Slc17a7 (VGLUT1) +/+ and - /- genotypes. Boutons are imaged for 3 min, bleached, and recovery is recorded for 73 min. (C) average FRAP kinetics. 27 synapses from +/+ and 31 synapses from - /- were measured by FRAP and the average traces are displayed here (for +/+ N = 8 cultures; for - /- N = 11 cultures). The two traces were fitted using double exponential components equations and the convergence of the traces to a common fit was tested using the extra sum of squares F test. The F test indicates that the traces are best fitted by two divergent models (F ratio = 19.32; p<0.0001). Fast FRAP recovery was monitored every 5 s in an independent set of experiments (inset). (D) Expression of transduced VGLUT1venus in hippocampal neurons. (E) Average FRAP recovery of VGLUT1venus at 68 min post-bleach in rescue or over-expression. Over-expression reduces the mobility of SVs (Unpaired t test, p=0.0385, t = 2.176. For overexpression: N = 4 cultures, n = 14 synapses; for rescue: N = 3 cultures, n = 15 synapses). scale bar: 2 µm in A and D, 1 µm in B.
Figure 1—figure supplement 1.
Figure 1—figure supplement 1.. VGLUT2 does not rescue SV super-pool size in VGLUT1 knock out neurons.
(A) Average FRAP kinetics obtained upon rescue of VGLUT1 KO cells by either VGLUT1venus or VGLUT2venus lentivirus. 24 synapses from VGLUT1venus and 20 synapses from VGLUT2venus were measured by FRAP and the average traces are displayed (VGLUT1venusrescue N = 7 cultureVGLUT2venus N = 7 cultures). The two traces were fitted using double exponential components equations and the convergence of the traces to a common fit was tested using the extra sum of squares F test. The F test indicates that the traces are best fitted by two divergent models (F ratio = 19.27; p<0.0001).
Figure 2.
Figure 2.. Structure of VGLUT1 and expression of mutants in neurons.
(A) schematic of VGLUT1 structure with 560 amino acids, 12 transmembrane domains, N- and C-termini facing the cytoplasmic side, and N-glycosylation at the first luminal loop. In blue the three residues mutated to silence VGLUT1 transport (sVGLUT1 see Figure 3). Red bars mark the three deletions used (∆C-term, ∆PRD1+2, ∆PRD2). Red residues were mutated to alanine in order to test their role in the super-pool regulation supported by VGLUT1. All mutations carried a venus tag at the C-terminus. (B) examples of expression patterns obtained with VGLUT1 WT and mutants upon transduction in hippocampal neurons matching endogenous expression levels. Note the dense punctate expression and low somatic signal typical of VGLUT1 distribution. Scale bar 10 µm. (C) Measurement of bouton area. None of the mutants displayed a shift in bouton size compared to WT controls. (D) Measurement of fluorescence intensity. None of the mutants displayed a significant shift in fluorescence intensity compared to WT controls.
Figure 3.
Figure 3.. Glutamate transport and SV tonicity are not involved in the reduction of SV super-pool size.
(A) Expression of VGLUT1mCherry, sVGLUT1mCherry and Syb2EGFP in hippocampal neurons. FRAP was performed on Syb2EGFP at axons, both on those with, and those without mCherry signal. Scale bar 5 µm. (B) Average FRAP kinetics from knock-out cells rescued by VGLUT1mCherry, sVGLUT1mCherry, and VGLUT1 KO synapses not rescued. Synapses from each genotype were measured by FRAP and the average traces are displayed (N = 7 independent cultures, 16 synapses for -/-; N = 5 cultures, 23 synapses for WT rescue, and N = 10 cultures, 36 synapses for sVGLUT1 rescue). The three traces were fitted using double exponential components equations and the convergence of the traces to a common fit was tested using the extra sum of squares F test. The F test indicates that the traces are best fitted by two divergent models (one for - /- synapses and the other one for both rescues, F ratio = 30.25; p<0.0001). FRAP kinetics for the 2 types of rescued synapses are best fitted by one convergent model (F ratio = 1.235; p=0.294). (C) Spontaneous excitatory activity in VGLUT1 KO rescued neurons. Example traces of mEPSC activity in wild type and sVGLUT1 rescue conditions. (D) Comparison of the amplitude of mEPSC events in wild type and sVGLUT1 rescue conditions (N = 3 independent cultures, n = 31 cells, mean amplitude = 15.3 pA ± 1.15 SEM for wild type rescue; N = 3 independent cultures, n = 56 cells, mean amplitude = 13.12 pA ± 0.71 SEM for sVGLUT1 rescue; unpaired t-test p=0.011). (E) Comparison of the frequency of mEPSC events in wild type and sVGLUT1 rescue conditions. (N = 3 independent cultures, n = 31 cells, mean frequency = 3.51 Hz ± 0.6 SEM for wild type rescue; N = 3 independent cultures, n = 56 cells, mean frequency = 2.51 Hz ± 0.58 SEM for sVGLUT1 rescue; unpaired t-test p=0.008). Note that sVGLUT1 conditions are both significantly smaller than wild type rescue conditions.
Figure 3—figure supplement 1.
Figure 3—figure supplement 1.. VGLUT2 expression diminishes in hippocampal neurons until DIV17.
(A) Immunofluorescence of VGLUT2 on hippocampal neurons at DIV 6, 12, 17, and 22. Scale bar 40 µm. (B) Quantification of VGLUT2 expression during hippocampal neuron culture development. Note the 3-fold reduction of VGLUT2 level between DIV 6 and 17, while the expression reached a low plateau between DIVB17 and 22. DIV6, N = 4, mean intensity = 612.8 ± 53.8; DIV12, N = 3, mean intensity = 325.9 ± 39.0; DIV17, N = 7, mean intensity = 202.8 ± 8.2; DIV22, N = 5, mean intensity = 191.2 ± 24.2. One way ANOVA p≤0.001; pair wise comparisons: DIV6 vs. DIV22 p<0,001 ; DIV6 vs. DIV17 p<0,001 ; DIV6 vs. DIV12 p<0,001 ; DIV12 vs. DIV22 p=0,044 ; DIV12 vs. DIV17 p=0,052 ; DIV17 vs. DIV22 p=0989.
Figure 3—figure supplement 2.
Figure 3—figure supplement 2.. Vesicular glutamate uptake function does not influence mIPSCs features.
(A) Spontaneous inhibitory activity in VGLUT1 KO rescued neurons. Example traces of mIPSC activity in wild type and sVGLUT1 rescue conditions. B: Comparison of the frequency of mIPSC events in wild type and sVGLUT1 rescue conditions (N = 3 independent cultures, n = 31 cells, mean frequency = 4.08 Hz ± 0.59 SEM for wild type rescue; N = 3 independent cultures, n = 56 cells, mean frequency = 3.99 Hz ± 0.52 SEM for sVGLUT1 rescue; unpaired t-test p=0.62). C: Comparison of the amplitude of mIPSC events in wild type and sVGLUT1 rescue conditions (N = 3 independent cultures, n = 31 cells, mean amplitude = 18.06 pA ± 1.07 SEM for wild type rescue; N = 3 independent cultures, n = 56 cells, mean amplitude = 17.69 pA ± 0.73 SEM for sVGLUT1 rescue; unpaired t-test p=0.70).
Figure 4.
Figure 4.. The VGLUT1 PRD2 domain mediates SV super-pool size and mEPSC frequency reductions.
(A) Comparison of VGLUT1venus and VGLUT1P554A-venus rescues of VGLUT1 KO on SV exchange rates at synapses. 21 (WT) and 22 (P554A) synapses from each rescue were measured by FRAP and the average traces are displayed (N = 5 cultures for WT and N = 5 cultures for P554A). The two traces were fitted using double exponential components equations and the convergence of the traces to a common fit was tested using the extra sum of squares F test. The F test indicates that the traces are best fitted by two divergent models (F ratio = 19.64; p<0.0001). (B) Similar experiments where performed for ∆PRD1+2, ∆PRD2, DQL514AQA, PP534AA, S540A and T544A. The results are displayed here as a comparison of fluorescence recovery to the corresponding WT control 68 min after bleaching. Only mutants affecting PRD2 display a lack of reduction to WT levels and a significantly higher SV exchange rate (t test, WT vs. ∆PRD1+2: p=0.0005, t = 3.790; vs. ∆PRD2: p<0.0001, t = 4.369; vs. P554A: p=0.0293, t = 2.266). (C) Time lapse imaging of SV axonal transport. VGLUT1venus, or VGLUT1P554A-venus, or VGLUT1S540A-venus were expressed in VGLUT1 KO neurons. Example sequence extracted from the boxed fiber (left) sampled every 200 ms over 30 s (middle). Vertical arrowhead points to a venus fluorescent dot traveling along the axon. Kymograph of fluorescence movements within the example fiber (boxed in middle panel). Vertical arrowhead points to the same traced event shown in the middle panel. Scale bar: left 5 µm, middle 2 µm. (D) Cumulative axonal fluorescence traffic measured over time-lapse sequences. A significant increase in VGLUT1venus traffic is seen when P554A is expressed compared to WT and S540A mutant (unpaired t test, WT vs. P554A: p=0.0092, t = 3.564; vs. S540A: p=0.8963, t = 0.1351. N = 5 cultures for WT, and N = 4 cultures for both P554A and S540A.). (E) Average speed of VGLUT1venus dots was extracted from kymographs. No significant changes in speed was seen for mutants tested compared to WT (One-way ANOVA, p=0.0634, F ratio = 2.431. Speed for each mutant, WT: 1.564 ± 0.02692 µm/s; P554A: 1.536 ± 0.02860 µm/s; S540A: 1.460 ± 0/02942 µm/s). (F) Spontaneous excitatory activity in VGLUT1 KO neurons rescued by wild type and P554A VGLUT1 constructs. Example traces of mEPSC activity in sham controls, wild type and VGLUT1P554A rescue conditions. (G) Comparison of the amplitude of mEPSC events in wild type and VGLUT1P554A rescue conditions (N = 3 independent cultures, n = 53 cells, mean amplitude = 12.73 pA ± 0.79 SEM for sham controls; N = 3 independent cultures, n = 61 cells, mean amplitude = 16.05 pA ± 1.05 SEM for wild type rescue; N = 3 independent cultures, n = 53 cells, mean amplitude = 15.59 pA ± 1.02 SEM for vglut1P554A rescue; Mann-Whitney test of wild type versus VGLUT1P554A, p=0.485). Note that both wild type and VGLUT1P554A rescue mEPSC amplitudes significantly and to the same extent compared to sham controls. (H) Comparison of the frequency of mEPSC events in wild type and VGLUT1P554A rescue conditions (N = 3 independent cultures, n = 53 cells, mean frequency = 2.14 Hz ± 0.37 SEM for sham controls; N = 3 independent cultures, n = 61 cells, mean frequency = 5.53 Hz ± 0.87 SEM for wild type rescue; N = 3 independent cultures, n = 53 cells, mean frequency = 7.59 Hz ± 0.97 SEM for VGLUT1P554A rescue; Mann-Whitney test of wild type versus VGLUT1P554A, p=0.031). Note that VGLUT1P554A mEPSC events are significantly more frequent than wild type rescue conditions. (I) Comparison of the frequency of mIPSC events in wild type and VGLUT1P554A rescue conditions (N = 3 independent cultures, n = 53 cells, mean frequency = 6.21 Hz ± 0.69 SEM for sham controls; N = 3 independent cultures, n = 61 cells, mean frequency = 7.28 Hz ± 0.69 SEM for wild type rescue; N = 3 independent cultures, n = 53 cells, mean frequency = 6.79 Hz ± 0.63 SEM for VGLUT1P554A rescue; Mann-Whitney test of wild type versus VGLUT1P554A, p=0.781). Note that all groups are equivalent regarding mIPSC amplitudes (Figure 4—figure supplement 2 displays the full IPSC data set). (J) Post-hoc analysis of VGLUT1venus average fluorescence integrated intensity at boutons in cultures monitored in electrophysiology. (N = 2 independent cultures, mean integrated intensity of punctate VGLUT1venussignal = 3.28 AU ± 0.15 SEM for wild type rescue; N = 2 independent cultures, mean integrated intensity of punctate VGLUT1venussignal = 3.11 AU ± 0.31 SEM for VGLUT1P554A rescue; T test, p=0.348).
Figure 4—figure supplement 1.
Figure 4—figure supplement 1.. VGLUT1 is phosphorylated but not at the conserved 540-SYGAT motif.
(A) Effect of alkaline phosphatase on the electrophoretic mobility of VGLUT1 from forebrain homogenates (and positive control VIAAT ; Vesicular Inhibitory Amino-Acid Transporter). (B) regional distribution of VGLUT1 phosphorylation state. Homogenates of several brain regions where probed for VGLUT1 signal as in panel A. OB: olfactory bulb, St: Striatum, Hipp: Hippocampus, BS: Brain Stem, Thal: Thalamus, Cb: Cerebellum, Cx: Cortex. (C) PhosTag assay on VGLUT1 KO primary neuron cultures rescued with VGLUT1venus WT and C-terminal mutant constructs. Note that PhosTag assays prevent from using a size ladder. All constructs display a phospho-shifted band that disappeared upon desphosphorylation by alkaline phosphatase. PI : phosphatase inhibitors; AP: alkaline phosphatase. Selected lanes blotted on the same membranes were reorganized for display purpose.
Figure 4—figure supplement 2.
Figure 4—figure supplement 2.. VGLUT1 PRD2 domain removal does not affect mIPSCs features.
(A) Spontaneous inhibitory activity in VGLUT1 KO neurons rescued by wild type and VGLUT1 P554A constructs. Example traces of mIPSC activity in sham controls, wild type and VGLUT1P554A rescue conditions. (B) Comparison of the frequency of mIPSC events in wild type and VGLUT1P554A rescue conditions (N = 3 independent cultures, n = 53 cells, mean frequency = 6.21 Hz ± 0.69 SEM for sham controls; N = 3 independent cultures, n = 61 cells, mean frequency = 7.28 Hz ± 0.69 SEM for wild type rescue; N = 3 independent cultures, n = 53 cells, mean frequency = 6.79 Hz ± 0.63 SEM for VGLUT1P554A rescue; Mann-Whitney test of wild type versus VGLUT1P554A, p=0.781). (C) Comparison of the amplitude of mIPSC events in wild type and VGLUT1P554A rescue conditions (N = 3 independent cultures, n = 53 cells, mean amplitude = 19.29 pA ± 1.34 SEM for sham controls; N = 3 independent cultures, n = 61 cells, mean amplitude = 22.47 pA ± 1.13 SEM for wild type rescue; N = 3 independent cultures, n = 53 cells, mean amplitude = 19.24 pA ± 0.78 SEM for VGLUT1P554A rescue; Mann-Whitney test of wild type versus VGLUT1P554A, p=0.137).
Figure 5.
Figure 5.. A tripartite complex between VGLUT1, endophilinA1 and intersectin1 mediates SV super-pool reduction.
(A) Schematic model of the competition experiment designed to test for the effective recruitment of intersectin1 at the VGLUT1/endophilinA1 complex (Pechstein et al., 2015). The three SH3 domains over-expressed in this competition assay disrupt distinct parts of the tripartite complex. The SH3 domain of endophilinA1 displaces the endogenous endophilinA1 BAR domain (Endo SH3WT). The SH3 domain of endophilinA1 mutated at E329K and S336K disrupts the interaction of intersectin1 with the VGLUT1/endophilinA1 complex (Pechstein et al., 2015). Finally, the SH3B domain of intersectin1 should displace the endogenous intersectin1 and allows us to assess whether the full-length intersectin1 is required. (B) Over-expression of SH3 domains fused with mCerulean3 in VGLUT1venus neurons. Axons filled with mCerulean3 were selected for FRAP experiments. Scale bar 2 µm. (C) FRAP measurement of SV super-pool in SH3 domains competition experiments. Synapses from each over-expression condition were measured by FRAP and the average recovery after 68 min are displayed (0.5346 ± 0.04128, N = 4 and n = 20 for sham; 0.6071 ± 0.03705, N = 5 and n = 25 for Endo-SH3WT; 0.7323 ± 0.04909, N = 4 and n = 18 for Endo-SH3E329K,S336K; 0.6894 ± 0.04036, N = 5 and n = 25 for ITSN1-SH3B). Sham and Endo-SH3WT converged to a lower SV exchange recovery (Mann-Whitney test, p=0.141) while Endo-SH3E329K,S336K (Mann-Whitney test, p=0.005 **) and ITSN1-SH3B (Mann-Whitney test, p=0.014 *) generated higher SV exchange recovery curves.
Figure 5—figure supplement 1.
Figure 5—figure supplement 1.. EndophilinA1 accumulates at synaptic vesicle clusters of VGLUT1 synapses.
Subcellular distribution of EndophilinA1 in VGLUT1 immunopositive terminals in mossy fiber terminals of the cerebellum (A,B) and cortico-striatal projections (C,D). We used pre-embedding immunogold (EndophilinA1) combined with immunoperoxidase (VGLUT1) methods. VGLUT1 immunoreaction product was visible at the level of SV throughout the axoplasm of the terminals. Immunoparticles for EndophilinA1 are detected throughout the axoplasm all over the clusters of VGLUT1 immunopositive vesicles. Scale bar : 500 nm.

Similar articles

Cited by

References

    1. Almqvist J, Huang Y, Laaksonen A, Wang DN, Hovmöller S. Docking and homology modeling explain inhibition of the human vesicular glutamate transporters. Protein Science. 2007;16:1819–1829. doi: 10.1110/ps.072944707. - DOI - PMC - PubMed
    1. Bardy C, van den Hurk M, Eames T, Marchand C, Hernandez RV, Kellogg M, Gorris M, Galet B, Palomares V, Brown J, Bang AG, Mertens J, Böhnke L, Boyer L, Simon S, Gage FH. Neuronal medium that supports basic synaptic functions and activity of human neurons in vitro. PNAS. 2015;112:E2725–E2734. doi: 10.1073/pnas.1504393112. - DOI - PMC - PubMed
    1. Bellocchio EE, Reimer RJ, Fremeau RT, Edwards RH. Uptake of glutamate into synaptic vesicles by an inorganic phosphate transporter. Science. 2000;289:957–960. doi: 10.1126/science.289.5481.957. - DOI - PubMed
    1. Berger A, Lorain S, Joséphine C, Desrosiers M, Peccate C, Voit T, Garcia L, Sahel JA, Bemelmans AP. Repair of rhodopsin mRNA by spliceosome-mediated RNA trans-splicing: a new approach for autosomal dominant retinitis pigmentosa. Molecular Therapy. 2015;23:918–930. doi: 10.1038/mt.2015.11. - DOI - PMC - PubMed
    1. Darcy KJ, Staras K, Collinson LM, Goda Y. Constitutive sharing of recycling synaptic vesicles between presynaptic boutons. Nature Neuroscience. 2006;9:315–321. doi: 10.1038/nn1640. - DOI - PubMed

Publication types

Substances