. 2019 Oct 29;10(1):4914.
doi: 10.1038/s41467-019-12912-0.

Structural insights of human mitofusin-2 into mitochondrial fusion and CMT2A onset

Affiliations

Structural insights of human mitofusin-2 into mitochondrial fusion and CMT2A onset

Yu-Jie Li et al. Nat Commun. .

Abstract

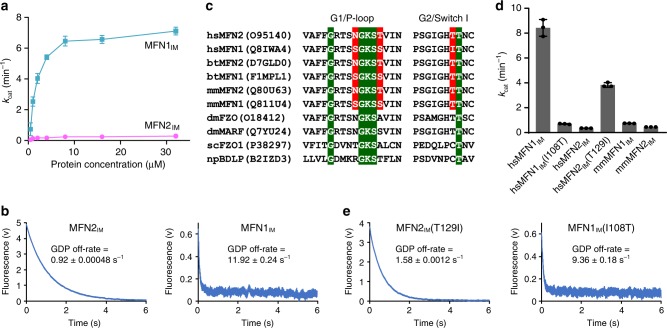
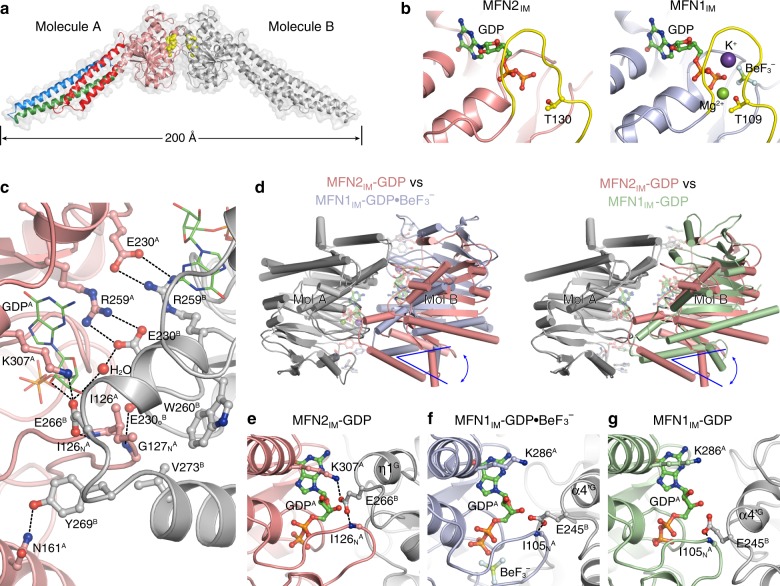
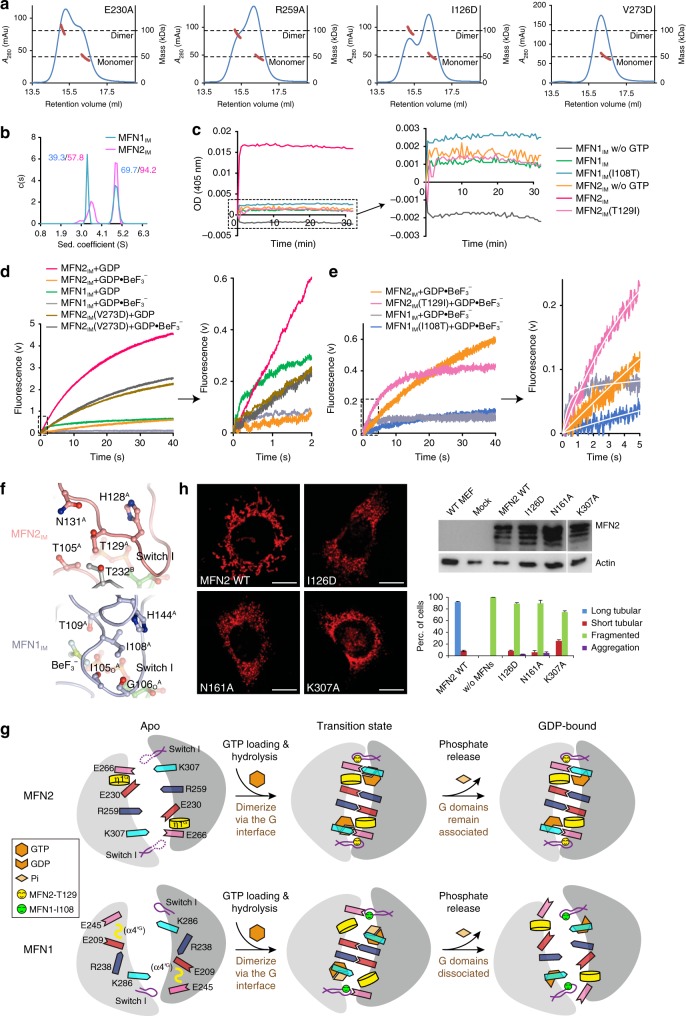
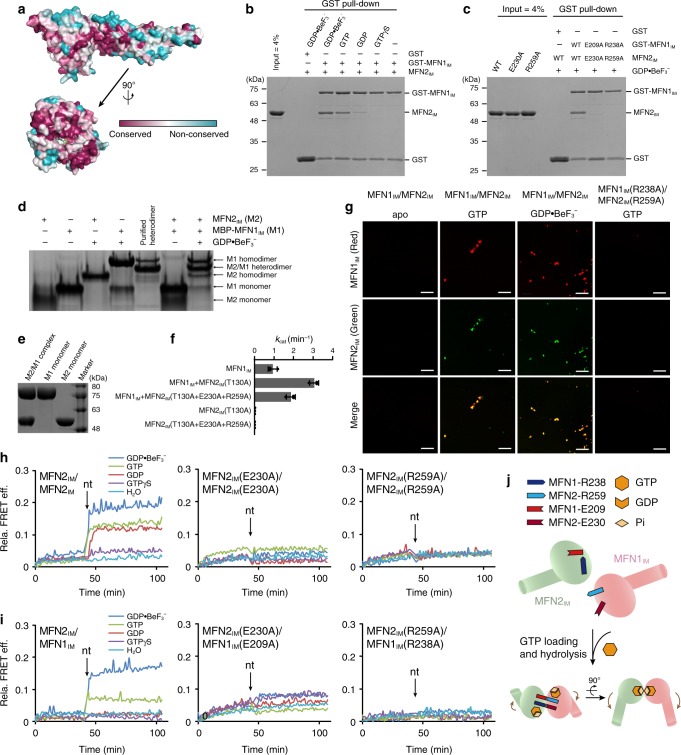
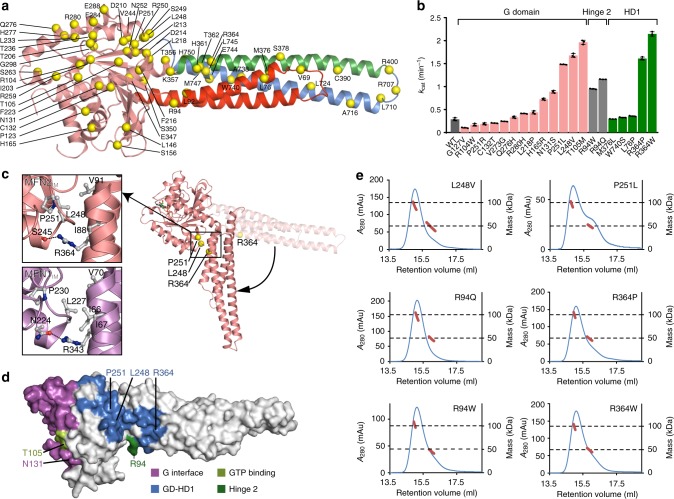
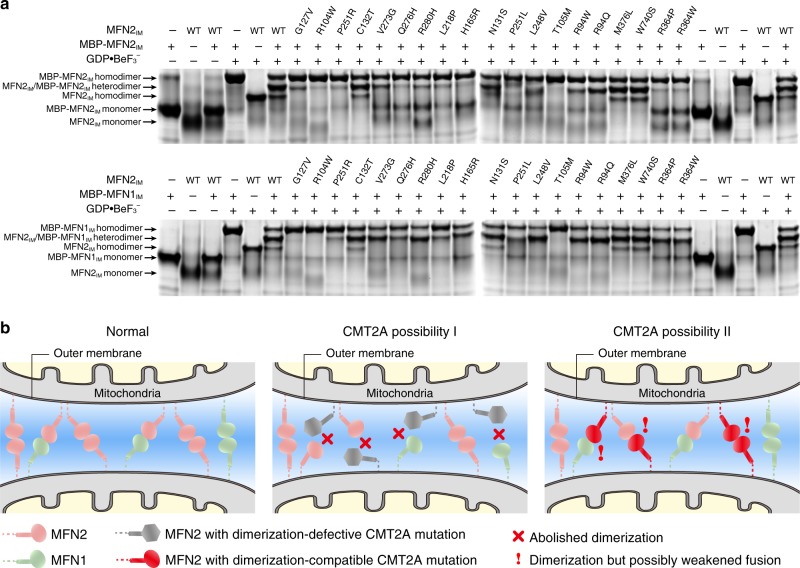
Mitofusin-2 (MFN2) is a dynamin-like GTPase that plays a central role in regulating mitochondrial fusion and cell metabolism. Mutations in MFN2 cause the neurodegenerative disease Charcot-Marie-Tooth type 2A (CMT2A). The molecular basis underlying the physiological and pathological relevance of MFN2 is unclear. Here, we present crystal structures of truncated human MFN2 in different nucleotide-loading states. Unlike other dynamin superfamily members including MFN1, MFN2 forms sustained dimers even after GTP hydrolysis via the GTPase domain (G) interface, which accounts for its high membrane-tethering efficiency. The biochemical discrepancy between human MFN2 and MFN1 largely derives from a primate-only single amino acid variance. MFN2 and MFN1 can form heterodimers via the G interface in a nucleotide-dependent manner. CMT2A-related mutations, mapping to different functional zones of MFN2, lead to changes in GTP hydrolysis and homo/hetero-association ability. Our study provides fundamental insight into how mitofusins mediate mitochondrial fusion and the ways their disruptions cause disease.


Conflict of interest statement

The authors declare no competing interests.

Figures

Fig. 1
Fig. 1
Overall structure of truncated MFN2IM a Schematic representation showing the organization of MFN2IM based on full-length MFN2. G domain, GTPase domain; HD1/2, helical domain 1/2; T, transmembrane region. Elements for MFN2IM are assigned according to the structure. Borders of each element are indicated by residue numbers. b Structure of nucleotide-free MFN2IM. α-helices of HD1 are differentially colored to specify their distribution on the primary structure as in a. c Details of hinge 2 of MFN2IM in nucleotide-free state. d Structural comparison between Trp260 in MFN2IM (pink) and Trp239 in MFN1IM (gray) in nucleotide-free states. e The C terminus of ɑ4H physically contacts the G domain. Nucleotide-free MFN2IM is illustrated here. f Binding affinities (dissociation constant, Kd) to guanine nucleotides for nucleotide-free MFN2IM and MFN1IM measured by isothermal titration calorimetry (ITC)
Fig. 2
Fig. 2
MFN2 is a weak GTPase. a GTP turnover rates of MFN2IM and MFN1IM were measured at seven different protein concentrations. Error bars indicate s.d. (n = 3). b GDP off-rates of MFN2IM and MFN1IM. A representative trace from three independent experiments is shown for each sample. c Sequence alignment of the P-loop and switch I of mitofusins from various species. Conventional motifs/residues are highlighted in green. Residues that differ between human MFN1 and MFN2 and may be responsible for GTP binding and hydrolysis are highlighted in red. hs Homo sapiens, bt Bos taurus, mm Mus musculus,; dm Drosophila melanogaster, sc Saccharomyces cerevisiae, np Nostoc punctiforme. d GTP turnover rates of wild-type human (hs) and mouse (mm)MFN1IM/MFN2IM, and indicated mutants. Error bars indicate s.d. (n = 3). e GDP off-rates of MFN2IM(T129I) and MFN1IM(I108T). Source data are provided as a Source Data file
Fig. 3
Fig. 3
Dimerization of MFN2IM via the G domain. a The MFN2IM dimer in GDP-bound state, with transparent surface representation. Molecule A is colored as in Fig. 1b, molecule B is in gray. GDP is shown as yellow spheres. b, Switch I configuration of MFN2IM-GDP structure and MFN1IM (Protein Data Bank code 5YEW) in the transition state. Switch I is colored yellow. The catalytic residues MFN2IM(Thr130) and MFN1IM(Thr109) are shown as ball-and-stick models. c Details of the G interface of MFN2IM. Only one side of the G interface is shown for other involved residues except for the central dual salt bridges. d Structural comparison of MFN2IM-GDP dimer with MFN1IM-GDPBeF3 dimer (PDB code 5YEW, left) and with MFN1IM-GDP dimer (PDB code 5GOM, right). The structures are superimposed for one polypeptide chain (Mol A, shown in gray). The positions of the other chain (Mol B) showed a clear difference in orientation between MFN2IM (pink) and MFN1IM structures (light blue or green). Comparison of the G interface of MFN2IM in the GDP-bound state (e) between MFN1IM in the transition state (f PDB code 5YEW) and in the GDP-bound state (g PDB code 5GOM). Note the MFN2-specific Glu266-Lys307 salt bridge and the tighter trans association
Fig. 4
Fig. 4
Characterization of MFN2IM dimeric interface. a Dimerization property of the G interface mutants in the presence of GDPBeF3 was assayed by analytical gel filtration coupled to RALS. Calculated molecular masses at the absorption peaks of 280 nm are plotted in red. mAU milli-absorption units. b AUC results of MFN2IM and MFN1IM (theoretical molecular mass 52.6 and 50.9 kDa, respectively) in the presence of GDPBeF3. The estimated molecular masses determined by sedimentation velocity are given in kilodaltons (kDa) above the peaks. c Liposome tethering assay for wild-type MFN2IM-TM/MFN1IM-TM and mutants. A representative plot from three independent experiments is shown. d Dimerization via the G interface slows down the nucleotide exchange of MFN2IM and MFN1IM. The initial part of each fluorescence trace was magnified. e Effect of MFN2IM(T129I) and MFN1IM(I108T) on the nucleotide exchange efficiency in the dimeric state. The initial part of each fluorescence trace was magnified and fitted to exponential function as shown in a white curve. f Surroundings of MFN2-Thr129 and MFN1-Ile108 in the dimerization form. g Model for comparison between MFN2 and MFN1 in G domain dimerization. Note the tighter G interface of MFN2 and its sustained dimerization in the GDP-bound state. Pi denotes phosphate group. h Mitochondrial elongation assay with quantification for wild-type MFN2 and G interface mutants. Representative images are shown. Mfn1/2-null MEFs were transduced with retrovirus expressing 16× Myc-tagged WT Mfn2 or G interface mutants. Actin was used as a loading control. A lysate from WT MEFs is shown for comparison. For each construct, 100 cells were scored in biological triplicate. Error bars indicate s.e.m. Scale bars, 10 μm. Source data are provided as a Source Data file
Fig. 5
Fig. 5
MFN2 interacts with MFN1 via G domain. a Surface conservation analysis reveals that the G interface is a highly conserved area in mitofusins. b Pull-down assays showing the interaction between MFN2IM and GST-tagged MFN1IM in different nucleotide-loading conditions. c Pull-down assays showing that the interaction between MFN2IM and MFN1IM is dependent on the G interface. d Native PAGE result showing the association between MFN2IM and MBP-fused MFN1IM. e SDS-PAGE showing the purified MFN2IM/MBP-MFN1IM hetero-complex. f MFN2IM stimulates GTP turnover of MFN1IM. Overall, 0.25 μM MFN1IM and 2.5 μM MFN1IM MFN2IM mutants were used. g Liposome tethering assay for wild-type MFN2IM/MFN1IM and G interface mutants. Representative images from five independent experiments are shown. Scale bar, 50 μm. h FRET experiment showing the G domain dimerization-dependent conformational change of MFN2IM in different nucleotide-loading conditions. The time point for the addition of corresponding nucleotides is indicated by an arrow for each panel. nt denotes nucleotide. i FRET experiment showing the conformational change of MFN2IM and MFN1IM upon association via the G domains in GTP- and GDPBeF3 loading conditions. j A model for the trans association between MFN2IM and MFN1IM. Source data are provided as a Source Data file
Fig. 6
Fig. 6
Characterization of CMT2A-related mutants. a Overview of the CMT2A-mutation sites on MFN2. The CMT2A-related single-point mutation sites are specified as yellow spheres on MFN2IM structure colored as in Fig. 1b. b GTP turnover rates of selected CMT2A-related MFN2IM mutants in comparison with wild-type MFN2IM. Locations of these mutants are color-specified. c CMT2A-mutation sites on the putative G domain-HD1 contact of MFN2 in the transition state. The structural model of rearranged MFN2IM is generated base on the MFN1IM-GDPBeF3 structure (PDB code 5YEW). CMT2A-related residues and their potential interaction partners are presented as ball-and-stick models. d Functional zones of MFN2 and the involved CMT2A-mutation sites. e Dimerization property of CMT2A-mutants on the putative G domain-HD1 interface in the presence of GDPBeF3. Source data are provided as a Source Data file
Fig. 7
Fig. 7
Interaction between CMT2A-related mutants and wild-type MFN1/2IM. a G domain-mediated association of CMT2A-related MFN2IM mutants with MBP-fused MFN2IM (upper) or MBP-MFN1IM (lower) tested by native PAGE. b Schematic drawing showing the two causes of CMT2A onset that may be derived from different MFN2 mutations. Source data are provided as a Source Data file

References

    1. Shaw JM, Nunnari J. Mitochondrial dynamics and division in budding yeast. Trends Cell Biol. 2002;12:178–184. doi: 10.1016/S0962-8924(01)02246-2. - DOI - PMC - PubMed
    1. Youle RJ, van der Bliek AM. Mitochondrial fission, fusion, and stress. Science. 2012;337:1062–1065. doi: 10.1126/science.1219855. - DOI - PMC - PubMed
    1. Mishra P, Chan DC. Metabolic regulation of mitochondrial dynamics. J. Cell Biol. 2016;212:379–387. doi: 10.1083/jcb.201511036. - DOI - PMC - PubMed
    1. Yaffe MP. The machinery of mitochondrial inheritance and behavior. Science. 1999;283:1493–1497. doi: 10.1126/science.283.5407.1493. - DOI - PubMed
    1. Chan DC. Fusion and fission: interlinked processes critical for mitochondrial health. Annu. Rev. Genet. 2012;46:265–287. doi: 10.1146/annurev-genet-110410-132529. - DOI - PubMed

Publication types

MeSH terms

Supplementary concepts