. 2019 Oct 29;10(1):4919.
doi: 10.1038/s41467-019-12763-9.

Unstable TTTTA/TTTCA expansions in MARCH6 are associated with Familial Adult Myoclonic Epilepsy type 3

Collaborators, Affiliations

Unstable TTTTA/TTTCA expansions in MARCH6 are associated with Familial Adult Myoclonic Epilepsy type 3

Rahel T Florian et al. Nat Commun. .

Abstract

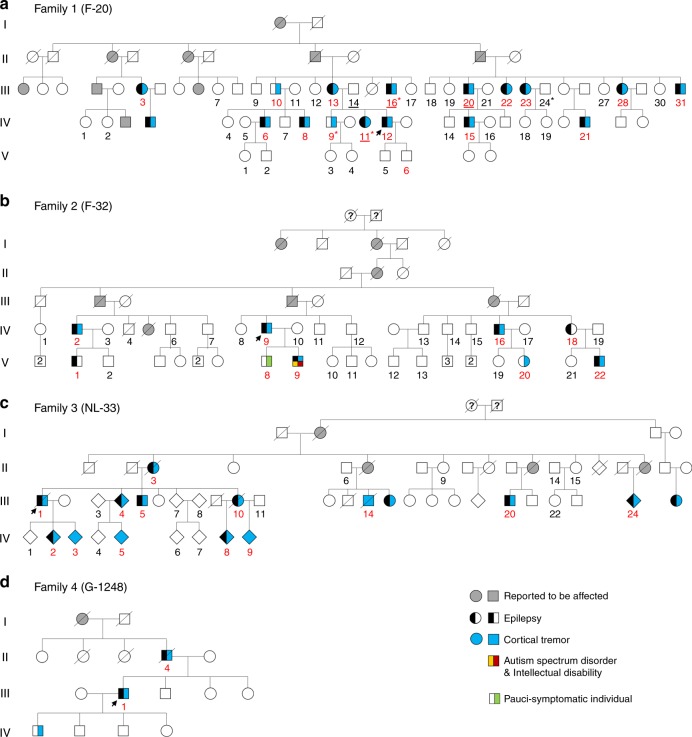
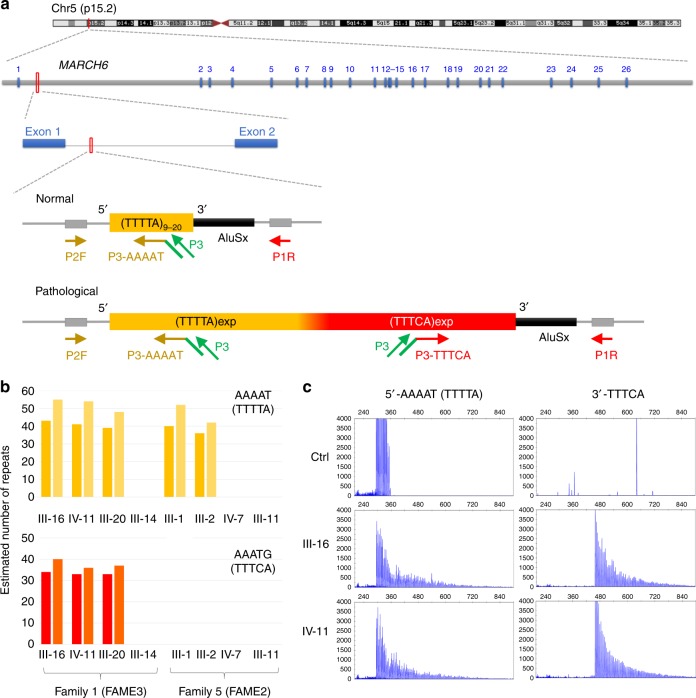
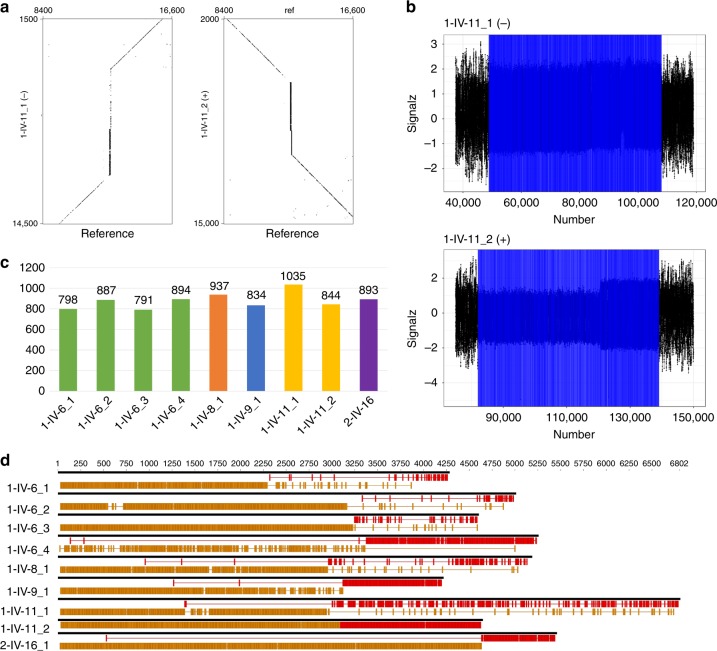
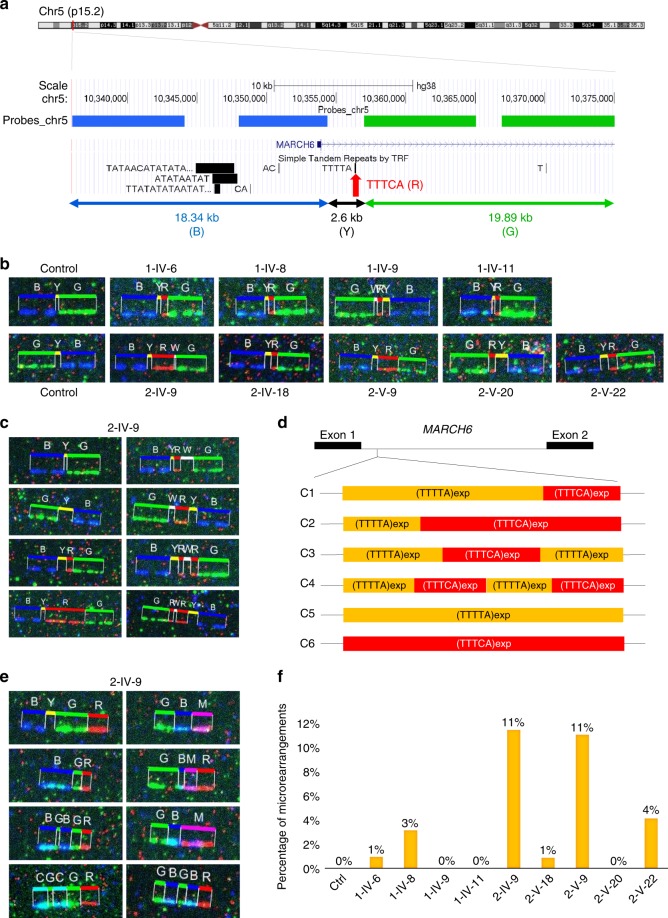
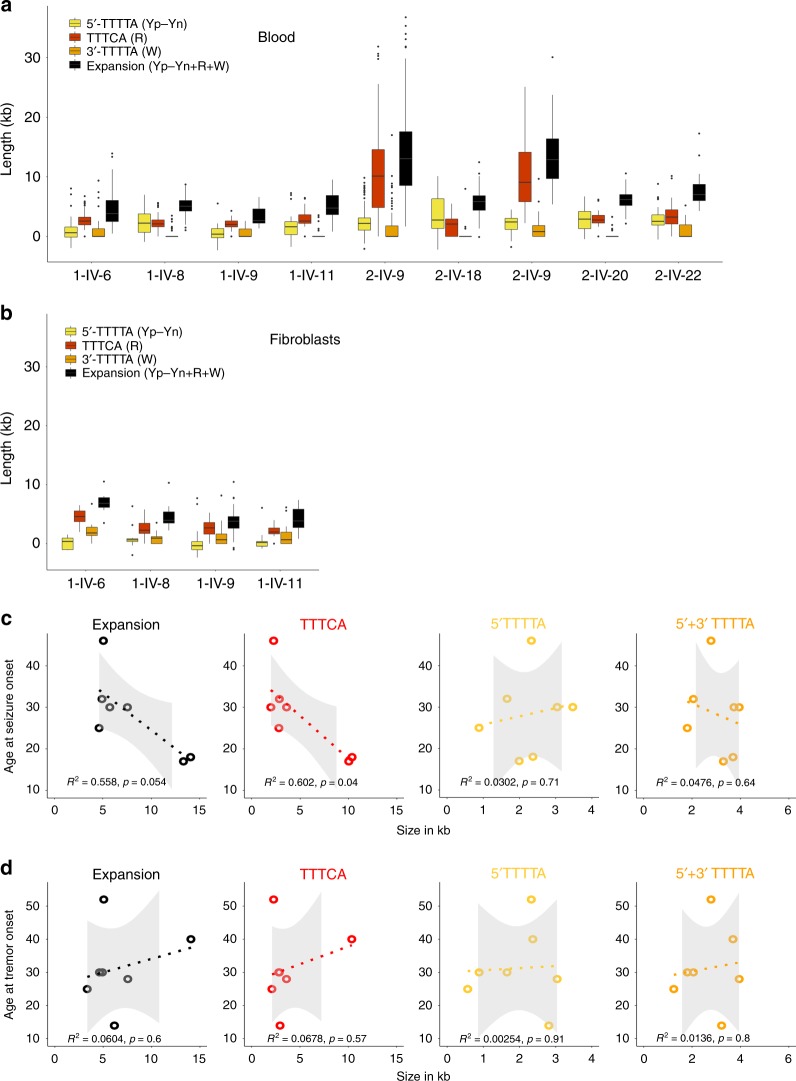
Familial Adult Myoclonic Epilepsy (FAME) is a genetically heterogeneous disorder characterized by cortical tremor and seizures. Intronic TTTTA/TTTCA repeat expansions in SAMD12 (FAME1) are the main cause of FAME in Asia. Using genome sequencing and repeat-primed PCR, we identify another site of this repeat expansion, in MARCH6 (FAME3) in four European families. Analysis of single DNA molecules with nanopore sequencing and molecular combing show that expansions range from 3.3 to 14 kb on average. However, we observe considerable variability in expansion length and structure, supporting the existence of multiple expansion configurations in blood cells and fibroblasts of the same individual. Moreover, the largest expansions are associated with micro-rearrangements occurring near the expansion in 20% of cells. This study provides further evidence that FAME is caused by intronic TTTTA/TTTCA expansions in distinct genes and reveals that expansions exhibit an unexpectedly high somatic instability that can ultimately result in genomic rearrangements.


Conflict of interest statement

Y.D. and M.D.M.A. were employed by Genomic Vision, a company providing diagnostic kits for the detection of genomic rearrangements, at the time of the study. All other authors declare no competing interests.

Figures

Fig. 1
Fig. 1
Pedigrees of families with MARCH6 expansions. Pedigrees of Families 1 (a, French), 2 (b, French), 3 (c, Dutch), and 4 (d, German). Individuals with ID numbers in red are carriers of the expansions. Individuals with ID numbers underlined have been included in whole-genome sequencing analyses. Individuals with stars have been included in RNA-seq analyses. Black half-filled symbols represent individuals with seizures; Blue symbols indicate individuals with cortical or myoclonic tremor. Individuals with both cortical tremor and epilepsy appear with one half each. A re-examined carrier individual presenting with minor signs of tremor (pauci-symptomatic individual) is indicated with a green half square. One male individual of Family 2 had autism spectrum disorder (yellow corner) and intellectual disability (red corner). Arrows indicate probands. ID numbering in Families 1 and 3 is identical to that previously described,
Fig. 2
Fig. 2
Identification of TTTTA/TTTCA expansions in MARCH6. a Schematic representation of the region where the expansion occurs in intron 1 of MARCH6 on chromosome 5p15.2. Blue boxes (1–26) represent MARCH6 exons. The yellow rectangle indicates the TTTTA repeats while the red rectangle represents the TTTCA repeats. Yellow (5ʹ-AAAAT assay) and red (3ʹ-TTTCA assay) arrows indicate primers used for the repeat-primed PCR assays while green arrows schematize the universal primer used in the assay (P3). b Number of TTTTA (actual repeated motif searched for: AAAAT, panel above, yellow) and TTTCA (actual repeated motif searched for: AAATG, panel below, red) repeats identified by ExpansionHunter from Illumina short-read genome data of three affected individuals (1-III-16, 1-IV-11, 1-III-20) and one healthy spouse (1-III-14) of Family 1 and another FAME family linked to FAME2 on chr2 (Family 5). Dark and light bars indicate allele 1 and allele 2, respectively. c Results of 5ʹ-AAAAT (left panels) and 3ʹ-TTTCA (right panels) RP-PCR assays in a control individual (healthy blood donor) and two affected individuals (1-III-16 and 1-IV-11) of Family 1
Fig. 3
Fig. 3
Characterization of MARCH6 expansions by Nanopore sequencing. a Dot plots comparing two nanopore reads from individual 1-IV-11 displaying the expansion (Y-axis, scale: 13 kb) with the corresponding hg19 reference region (X-axis, scale: 8.1 kb). The expansions appear as vertical lines. Read 1-IV-11_1 is on the negative strand while read 1-IV-11_2 is on the positive strand. b Analysis of the same raw nanopore reads using NanoSatellite. The signals corresponding to the expanded repeats appear in blue. c Number of total repeats inferred by NanoSatellite for each extracted read covering the expansion. Data are displayed for the five individuals for whom reads covering the whole expansion have been detected. Four reads covering parts of the expansion and flanking regions were obtained for individual 2-IV-9 but are not included in this graph. Dot plots and raw nanopore reads covering completely the expansion appear in Supplementary Fig. 6 and all sequences are available in Supplementary Data 3. d Schematic representation of the sequence of the same nanopore reads showing exact TTTTA motifs in yellow and exact TTTCA motifs in red. Gaps between exact repeats possibly correspond to interruptions or sequencing (base calling) errors
Fig. 4
Fig. 4
Somatic mosaicism of MARCH6 expansions detected by molecular combing. a Schematic representation of the molecular code used to stain regions adjacent to MARCH6 expansions. Probes directed against specific 5ʹ (labeled in blue, B) or 3ʹ (labeled in green, G) flanking regions have been hybridized to single-stretched DNA fibers extracted from blood cells; TTTCA repeats are stained in red (R). b Representative images seen in a control individual (two panels on the left) and in nine expansion carrier individuals for whom molecular combing was performed. Y refers to the unstained part between the blue and red signals; unstained parts detected between the red and green signals or in-between two red signals are referred to as W. c Selected images observed at the expanded site in the proband of Family 2 (2-IV-9), showing extreme variability of the expansion length and structure in his blood. d Schematic representation of the different expansion configurations (C1–C6) observed using molecular combing. e) Selected micro-rearrangements observed at the expanded site in individual 2-IV-9. M (magenta) and C (Cyan) correspond to the overlay of red and blue or green and blue probes, respectively, indicating an overlap of probes that should normally be separated. All images corresponding to micro-rearrangements observed in individuals 2-IV-9 and 2-V-9 are shown in Supplementary Fig. 10. f Percentage of micro-rearrangements observed in the ten individuals analyzed by molecular combing. Individuals with the largest expansions (2-IV-9 and 2-V-9) exhibit a higher percentage of rearranged alleles than individuals with smaller expansions
Fig. 5
Fig. 5
Distribution of expansion lengths and genotype–phenotype correlations. a Box plots showing the distribution of the size of the overall expansion (in black), as well as the 5ʹ-TTTTA (yellow, Yp–Yn; see Methods for details) and TTTCA (red, R) parts in blood from the nine carrier individuals. Some alleles showed an unstained part between the red and the green signals, which is referred to as 3ʹ-TTTTA (W, in orange). Box plots elements are defined as follows: center line: median; box limits: upper and lower quartiles; whiskers: 1.5× interquartile range; points: outliers. b Box plots showing the distribution of the size of the overall expansion (in black) and each parts: 5ʹ-TTTTA appears in yellow (Yp–Yn; see Methods for details), TTTCA in red (R) in fibroblasts from four affected individuals of Family 1. c Correlations between the age at seizure onset and the mean size (in kb) of the overall expansion (left), the TTTCA (middle left), the 5ʹ-TTTTA (middle right), or the overall (5ʹ + 3ʹ) TTTTA repeats region (right). Individuals with larger TTTCA repeat region have an earlier age at seizure onset. On the contrary, neither the size of 5ʹ-TTTTA or 5ʹ + 3ʹ-TTTTA repeats correlate with the age at epilepsy onset. Individuals included in the graph are 1-IV-6, 1-IV-8, 1-IV-11, 2-IV-9, 2-IV-18, 2-V-9, and 2-V-22. Individuals without epilepsy also have the smallest TTTCA stretches although they are not included (see Table 1). R2 is the square value of the Pearson coefficient; 95% confidence intervals appear in gray; corresponding R values and 95% confidence intervals are summarized in Supplementary Table 2. d Correlations between the age at tremor onset and the mean size (in kb) of the expansion and each part, showing no correlation with any of them. Individuals included in the graph are 1-IV-6, 1-IV-8, 1-IV-9, 1-IV-11, 2-IV-9, 2-V-20, and 2-V-22
Fig. 6
Fig. 6
Expansions do not affect MARCH6 expression in blood or skin. a Schematic representation of the MARCH6 transcript isoforms. The site of the expansion is indicated by the red box. Arrows indicate primer pairs used to quantify MARCH6 gene expression. b Results of real-time RT-PCR in blood from expansion carrier (n = 12) versus healthy (n = 10) individuals with primers specific of exons 7–8 (left) and exons 14–15 (right). c Results of real-time RT-PCR in fibroblasts from expansion carrier (n = 4) versus unrelated control (n = 4) individuals with primers specific of exons 7–8 (left) and exons 14–15 (right). d Results of real-time RT-PCR in blood from expansion carrier (n = 12) versus healthy (n = 10) individuals with primers located in intron 1 before (left) or after (right) the expansion. e Results of real-time RT-PCR in fibroblasts from expansion carrier (n = 4) versus unrelated control (n = 4) individuals with primers located in intron 1 before (left) or after (right) the expansion. Box plots elements are defined as follows: center line: median; box limits: upper and lower quartiles; whiskers: 1.5× interquartile range; all values are displayed as points; outliers are shown as disconnected points. Statistical comparisons were done using a Wilcoxon–Mann–Whitney rank-sum test (two-sided)

Similar articles

Cited by

References

    1. van den Ende T, Sharifi S, van der Salm SMA, van Rootselaar AF. Familial cortical myoclonic tremor and epilepsy, an enigmatic disorder: from phenotypes to pathophysiology and genetics. A systematic review. Tremor Other Hyperkinet Mov. 2018;8:503. - PMC - PubMed
    1. Striano P, Zara F. Autosomal dominant cortical tremor, myoclonus and epilepsy. Epileptic Disord. 2016;18:139–144. - PubMed
    1. van Rootselaar AF, et al. Familial cortical myoclonic tremor with epilepsy: a single syndromic classification for a group of pedigrees bearing common features. Mov. Disord. 2005;20:665–673. doi: 10.1002/mds.20413. - DOI - PubMed
    1. Mikami M, et al. Localization of a gene for benign adult familial myoclonic epilepsy to chromosome 8q23.3-q24.1. Am. J. Hum. Genet. 1999;65:745–751. doi: 10.1086/302535. - DOI - PMC - PubMed
    1. Guerrini R, et al. Autosomal dominant cortical myoclonus and epilepsy (ADCME) with complex partial and generalized seizures: a newly recognized epilepsy syndrome with linkage to chromosome 2p11.1-q12.2. Brain. 2001;124:2459–2475. doi: 10.1093/brain/124.12.2459. - DOI - PubMed

Publication types

Supplementary concepts