. 2019 Oct 29;9(1):15467.
doi: 10.1038/s41598-019-51770-0.

Transplantation of Mouse Induced Pluripotent Stem Cell-Derived Podocytes in a Mouse Model of Membranous Nephropathy Attenuates Proteinuria

Affiliations

Transplantation of Mouse Induced Pluripotent Stem Cell-Derived Podocytes in a Mouse Model of Membranous Nephropathy Attenuates Proteinuria

Amin Ahmadi et al. Sci Rep. .

Retraction in

Abstract

Injury to podocytes is a principle cause of initiation and progression of both immune and non-immune mediated glomerular diseases that result in proteinuria and decreased function of the kidney. Current advances in regenerative medicine shed light on the therapeutic potential of cell-based strategies for treatment of such disorders. Thus, there is hope that generation and transplantation of podocytes from induced pluripotent stem cells (iPSCs), could potentially be used as a curative treatment for glomerulonephritis caused by podocytes injury and loss. Despite several reports on the generation of iPSC-derived podocytes, there are rare reports about successful use of these cells in animal models. In this study, we first generated a model of anti-podocyte antibody-induced heavy proteinuria that resembled human membranous nephropathy and was characterized by the presence of sub-epithelial immune deposits and podocytes loss. Thereafter, we showed that transplantation of functional iPSC-derived podocytes following podocytes depletion results in recruitment of iPSC-derived podocytes within the damaged glomerulus, and leads to attenuation of proteinuria and histological alterations. These results provided evidence that application of iPSCs-derived renal cells could be a possible therapeutic strategy to favorably influence glomerular diseases outcomes.


Conflict of interest statement

The authors declare no competing interests.

Figures
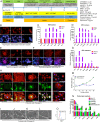
Figure 1
Figure 1
Generation and characterization of podocytes from induced pluripotent stem cells (iPSCs). (A) Experimental design and optimization of induced pluripotent stem cell (iPSCs) differentiation into podocytes. (B) Immunostaining for nephrogenic intermediate mesoderm (NIM) markers Osr1, Pax2 and Sall1 on day 8. Quantitative RT-PCR analyses of marker gene expression for (C) NIM and (D) NPC cells differentiated from iPSCs on days 8 and 12, respectively. Immunofluorescence analysis of (E) NPC and (F) podocyte progenitor markers. (G) Gene expression analysis confirmed the commitment to the podocyte fate by the increase in podocyte markers. (H) Immunofluorescence analysis for the podocyte marker proteins podocin, podocalyxin, synaptopodin, Wt1, and nephrin displayed a final induction towards green fluorescent protein (GFP)+ mature podocyte cells at passage 6. We also observed the presence of highly organized actin fibers within the podocyte cytoplasm. Immunostaining of iPSC-podocytes with the produced anti-podocyte antibody (APA) showed high immunoreactivity with these cells. (I) Scanning electron microscopy of iPSC-podocytes demonstrated a main cell body and (J) tight junction-like structures that were connected to the adjacent cells (arrows). (K) Cytoplasmic projections that extended from the cell body (arrows) and (L) tertiary projections at the end of processes of the cytoplasmic projections (arrows). (M) Doubling time graph for proliferative differentiated podocytes from iPSCs. (N) Quantitative RT-PCR analyses showed decreased expression levels of Pax2 and increased expression levels for Wt1, Synpo, Nphs2, Nphs1, and Pdxl with increasing culture time. (O) Flow cytometry for podocin in iPSC-podocytes on day 22. Samples treated only with secondary antibodies were used as controls (red). Relative gene expression was normalized against GAPDH. The fold-change values are represented by mean ± SEM (n = 3). Scale bars: B, E, F, and H: 100 µm.
Figure 2
Figure 2
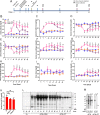
Analysis of serum and urine indices in anti-podocyte antibody (APA) treated and iPSC-podocyte transplanted mice. (A) Timeline of pre-immunization and antibody infusion in mice. Asterisks and hashtags indicate days on which specimens for urine, serum, and histology were obtained. (BJ) Quantification of Upro, Ualb/crea ratio, Stpro, Salb, BUN, Stg, Scho, Uur, and Scr in non-treated (●, NT), preimmune (■, PI), anti-podocyte nephropathy + phosphate-buffered saline (▲, APN + PBS), and APN + podocyte transplantation (▼, APN + PT) mice groups (n = 5) on the indicated days. (K) Serum third complement component (C3) levels in PI and anti-podocyte antibody (APA) treated mice on days 10 and 15 (n = 3). (L) Protein staining of SDS-PAGE gel loaded with 2.5 µl of urine samples collected on the indicated days in the PI, APN + PBS, and APN + PT groups. (M) Left panel: Western blots of urine from day10 probed for mouse IgG (IgG), albumin (alb), podocin (pod), and podocalyxin (pdx). Right panel: Western blots of urine probed for pdx and green fluorescent protein (GFP), 25 days after cell transplantation. The grouping of blots was cropped from different parts of one gel and exposures are made explicit. Values are expressed as mean ± SEM. PI vs. APN + PBS groups: a: p < 0.05, b: p < 0.01, and c: p < 0.001. APN + PBS vs. APN + PT groups: A’: p < 0.05, B’: p < 0.01, and C’: p < 0.001.
Figure 3
Figure 3
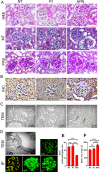
Altered histopathology of membranous nephropathy (MN) obtained from 100 glomeruli per group (n = 5) with similar staining patterns on day 10. (A) Hematoxylin and eosin (H&E), Masson’s trichrome (MT), and periodic acid-Schiff (PAS) stained kidney sections from non-treated (NT), preimmune antibody (PI), and anti-podocyte antibody (APA) treated mice showed increased mesangial matrix and diffuse mesangial sclerosis with an occasional tendency for glomerular crescents (asterisks). (B) Representative pictures for immunohistochemical (IHC) staining of Wt1 as a podocyte marker in glomeruli of the 3 mice groups. (C) Transmission electron microscopy (TEM) revealed podocyte vacuolization with blebbing, foot process effacement, and detachment from the GBM in APA-treated mice (arrows). (D) Electron microscopy showed subepithelial electron dense deposits. Immunofluorescence study results showed the presence of APA, coarse granular deposits of IgG and C3 together whit C3b. (E) Quantitation of the numbers of Wt1-positive podocytes in the glomeruli of the 3 mice groups. (F) Quantitative analysis of glomerular section areas of the 3 mice groups. All values are presented as mean ± SEM. Differences were determined by ANOVA and a subsequent Tukey test. p < 0.05 was considered statistically significant. **p < 0.01, ***p < 0.001, and ns: Not significant. Scale bars in A and B: 100 µm.
Figure 4
Figure 4
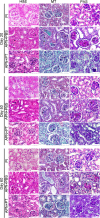
Histopathology section of kidney specimens obtained from anti-podocyte nephropathy + phosphate-buffered saline (APN + PBS), preimmune antibody (PI), and podocyte transplantation (APN + PT) groups on days 20, 50, and 60. Representative images show hematoxylin and eosin (H&E), Masson’s trichrome (MT), and periodic acid-Schiff (PAS) staining of the kidney sections. The arrows indicate increased mesangial matrix, diffuse mesangial sclerosis with some degrees of crescent formation in the anti-podocyte nephropathy + phosphate-buffered saline (APN + PBS) groups (vehicle) compared to the preimmune antibody (PI) groups (control groups). In contrast, the representative images show significant improvement against damaged glomeruli of the cell-transplanted groups (APN + PT) compared to vehicle groups on the respective days. Scale bars: 100 µm.
Figure 5
Figure 5
Attenuation of podocyte lesion-related histological damage after induced pluripotent stem cell-podocyte transplantation (iPSC-PT) into mice with membranous nephropathy. (A,B) Percentages of glomerular pathologies; (C) glomerular section areas; (D) the numbers of Wt1-positive cells in the glomeruli of the 3 groups: preimmune antibody (PI), anti-podocyte nephropathy + phosphate-buffered saline (APN + PBS), and podocyte transplantation (APN + PT) on the indicated days.
Figure 6
Figure 6
Qualitative and quantitative analysis of localization of transplanted podocytes. (A) Immunohistochemical (IHC) staining for localization of green fluorescent protein (GFP)+ positive transplanted induced pluripotent stem cell (iPSC)-podocytes in glomeruli 10, 40, and 50 days after cell transplantation. The maximum glomerular localization was observed 10 days after transplantation and continued up to day 50. In addition, the number of extraglomerular transplanted podocytes decreased over time. Scale bars: 100 µm. (B) Quantitation of the numbers of GFP+ iPSC-podocytes localized in the glomeruli. (C) Representative image of immunogold labelling confirmed the incorporation of GFP+ podocytes in glomeruli with apicobasal polarity and formation of slit diaphragm-like structures (arrows) between the foot processes of newly integrated podocytes, 10 days after transplantation. Scale bars: left panel: 5 µm, right panels: 500 nm. Data obtained from 100 glomeruli per group (n = 5 per group). All values are presented as mean ± SEM. Differences were determined by ANOVA and a subsequent Tukey test with p < 0.05 considered statistically significant. *p < 0.05; **p < 0.01; ***p < 0.001; and ns: Not significant.

Similar articles

Cited by

References

    1. Lai WL, et al. Membranous nephropathy: a review on the pathogenesis, diagnosis, and treatment. J. Formos. Med. Assoc. 2015;114:102–111. doi: 10.1016/j.jfma.2014.11.002. - DOI - PubMed
    1. Asanuma K, Mundel P. The role of podocytes in glomerular pathobiology. Clin. Exp. Nephrol. 2003;7:255–259. doi: 10.1007/s10157-003-0259-6. - DOI - PubMed
    1. Meliambro, K., He, J. C. & Campbell, K. N. The podocyte as a therapeutic target in proteinuric kidney disease. Journal of Nephrology & Therapeutics2013 (2013).
    1. Martin CE, Jones N. Nephrin signaling in the podocyte: an updated view of signal regulation at the slit diaphragm and beyond. Front. Endocrinol. (Lausanne) 2018;9:302. doi: 10.3389/fendo.2018.00302. - DOI - PMC - PubMed
    1. Luo W, et al. Alternative pathway is essential for glomerular complement activation and proteinuria in a mouse model of membranous nephropathy. Front. Immunol. 2018;9:1433. doi: 10.3389/fimmu.2018.01433. - DOI - PMC - PubMed

Publication types

MeSH terms