. 2019 Oct;574(7780):707-711.
doi: 10.1038/s41586-019-1650-0. Epub 2019 Oct 9.

Recurrent noncoding U1 snRNA mutations drive cryptic splicing in SHH medulloblastoma

Hiromichi Suzuki #  1   2 Sachin A Kumar #  1   2   3 Shimin Shuai  4   5 Ander Diaz-Navarro  6   7 Ana Gutierrez-Fernandez  6   7 Pasqualino De Antonellis  1   2 Florence M G Cavalli  1   2 Kyle Juraschka  1   2   3 Hamza Farooq  1   2   3 Ichiyo Shibahara  1   2 Maria C Vladoiu  1   2   3 Jiao Zhang  1   2 Namal Abeysundara  1   2 David Przelicki  1   2   3 Patryk Skowron  1   2   3 Nicole Gauer  1   2 Betty Luu  1   2 Craig Daniels  1   2 Xiaochong Wu  1   2 Antoine Forget  8   9 Ali Momin  1   2   5 Jun Wang  10 Weifan Dong  1   2   5 Seung-Ki Kim  11 Wieslawa A Grajkowska  12 Anne Jouvet  13 Michelle Fèvre-Montange  14 Maria Luisa Garrè  15 Amulya A Nageswara Rao  16 Caterina Giannini  17 Johan M Kros  18 Pim J French  19 Nada Jabado  20 Ho-Keung Ng  21 Wai Sang Poon  22 Charles G Eberhart  23   24   25 Ian F Pollack  26 James M Olson  27 William A Weiss  28   29   30 Toshihiro Kumabe  31 Enrique López-Aguilar  32 Boleslaw Lach  33   34 Maura Massimino  35 Erwin G Van Meir  36   37   38 Joshua B Rubin  39   40 Rajeev Vibhakar  41 Lola B Chambless  42 Noriyuki Kijima  43 Almos Klekner  44 László Bognár  44 Jennifer A Chan  45 Claudia C Faria  46   47 Jiannis Ragoussis  48   49 Stefan M Pfister  50   51   52 Anna Goldenberg  53   54 Robert J Wechsler-Reya  10   55 Swneke D Bailey  56   57 Livia Garzia  57   58 A Sorana Morrissy  45   59 Marco A Marra  60   61 Xi Huang  1   2 David Malkin  62 Olivier Ayrault  8   9 Vijay Ramaswamy  2   62 Xose S Puente  6   7 John A Calarco  63 Lincoln Stein  4 Michael D Taylor  64   65   66   67
Affiliations

Recurrent noncoding U1 snRNA mutations drive cryptic splicing in SHH medulloblastoma

Hiromichi Suzuki et al. Nature. 2019 Oct.

Abstract

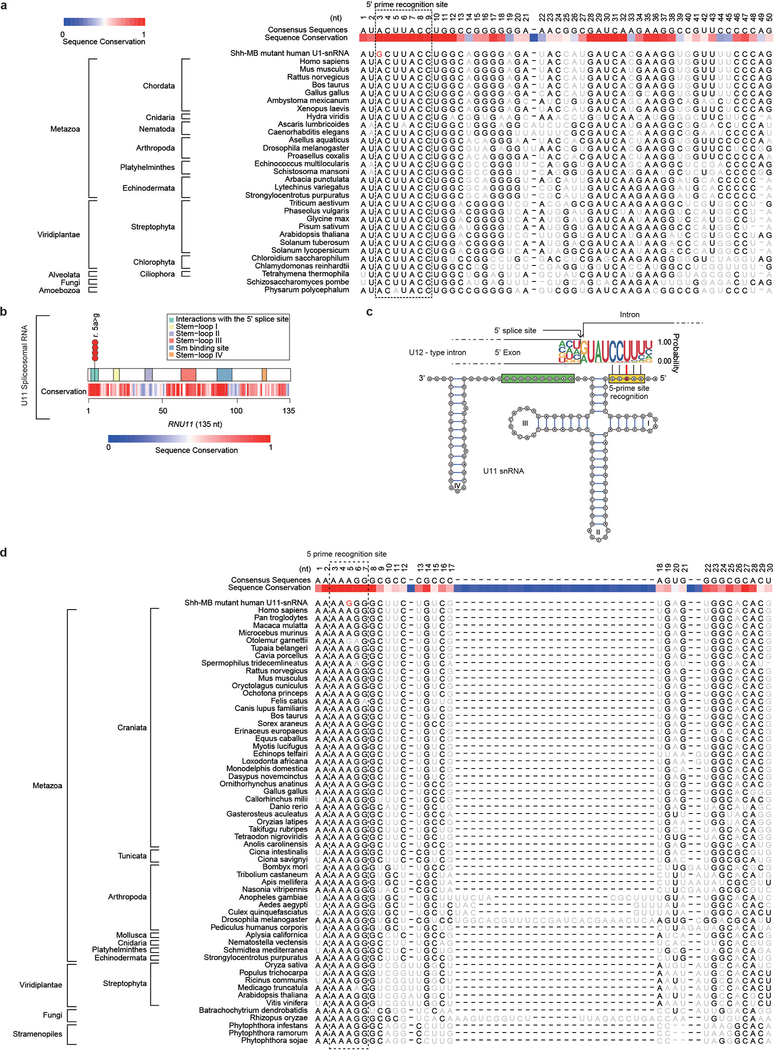
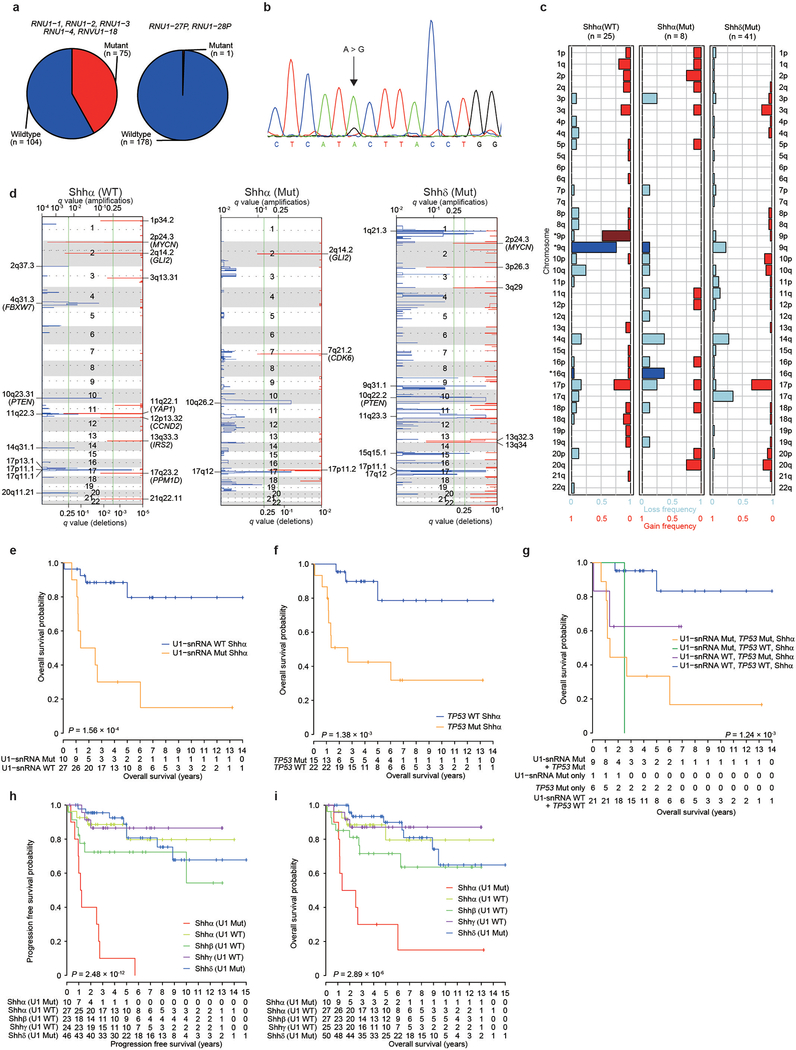
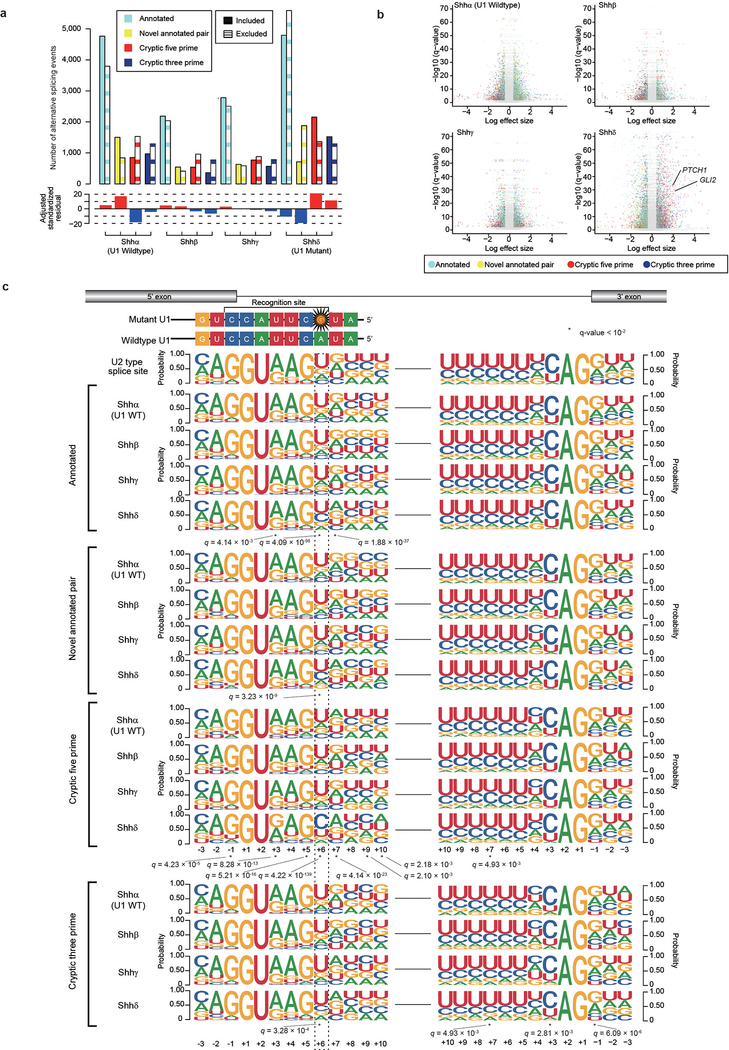
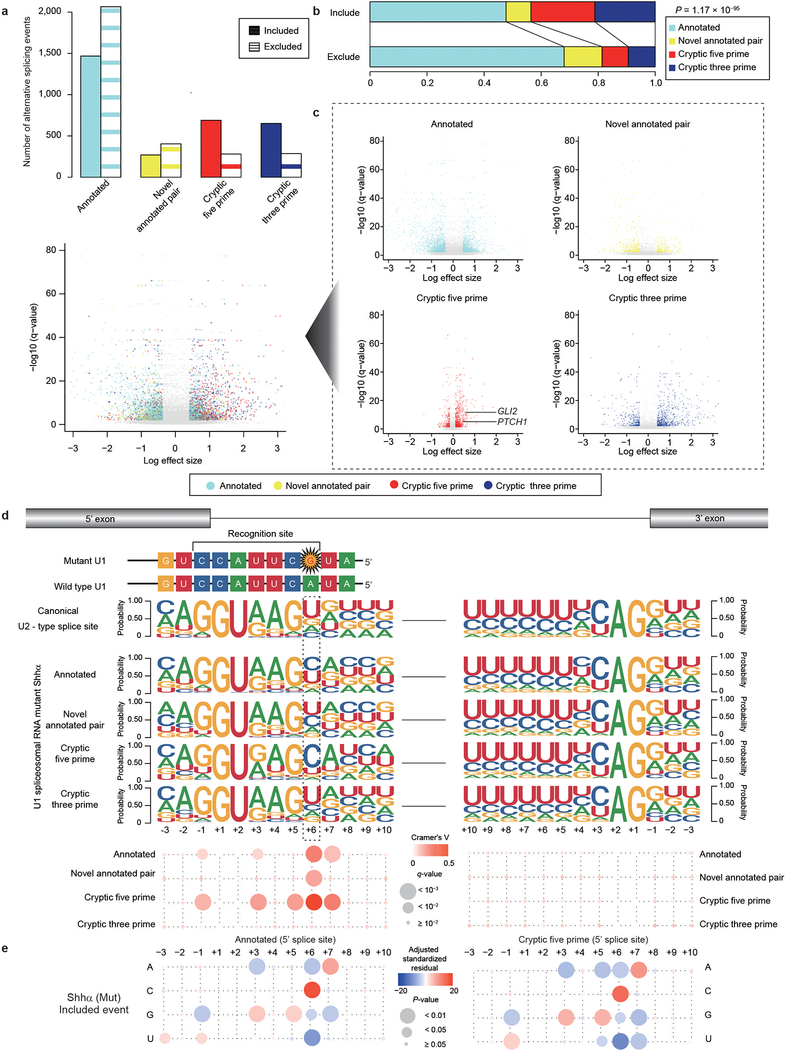
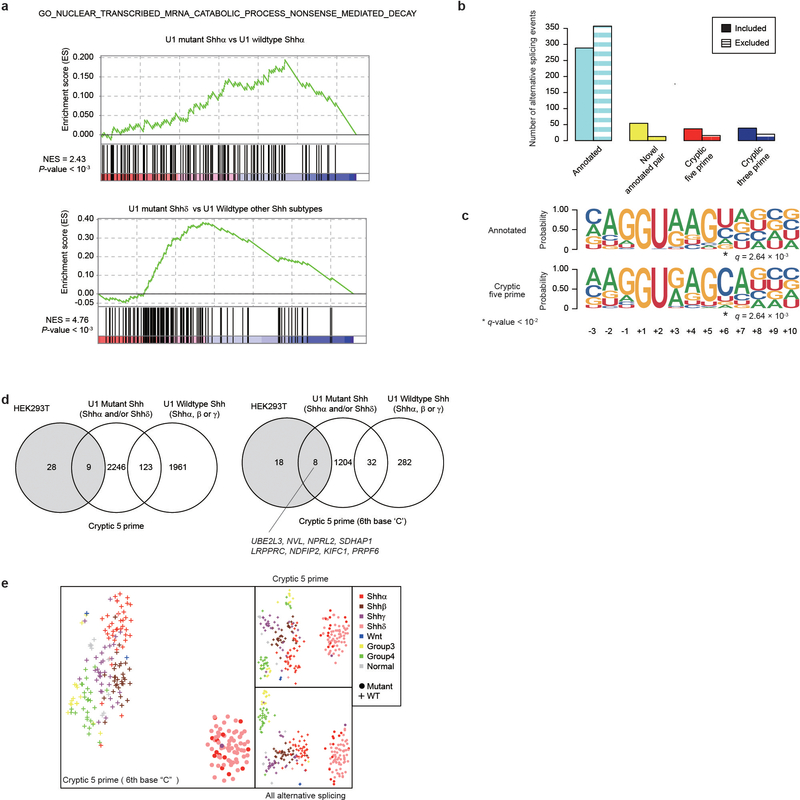
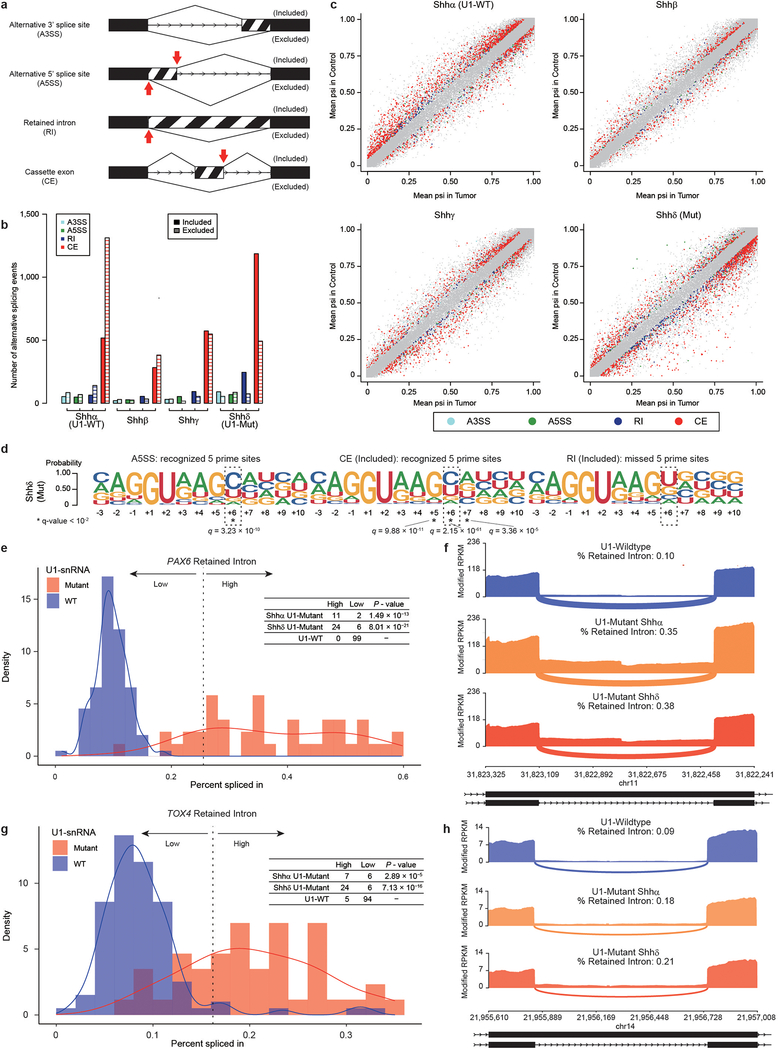
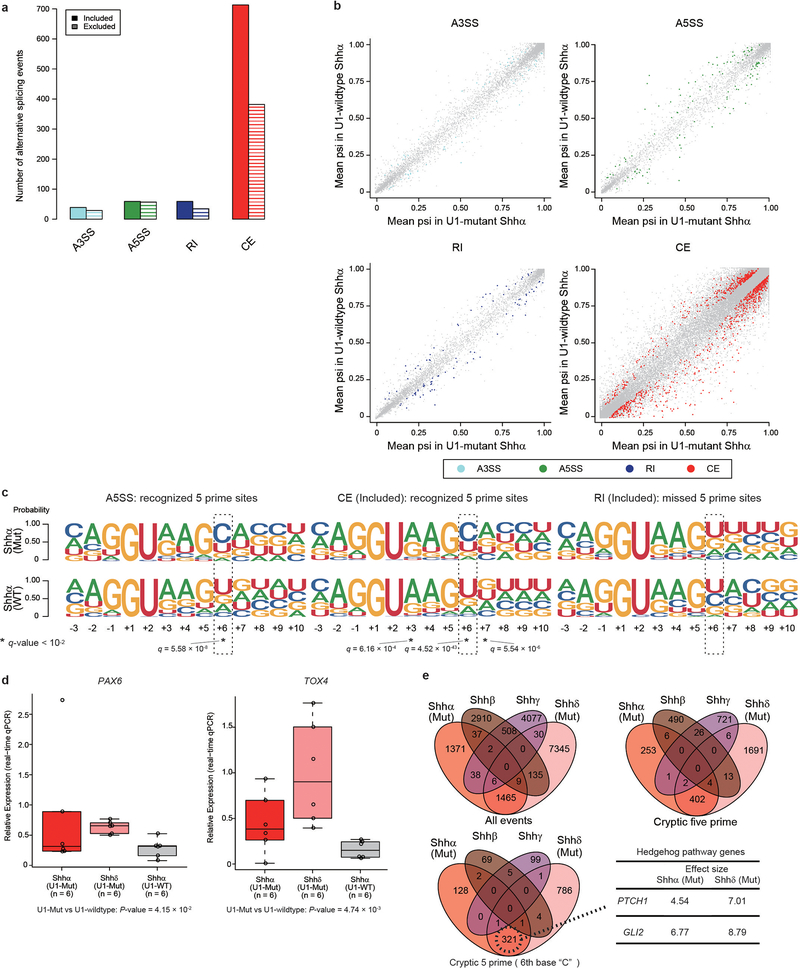
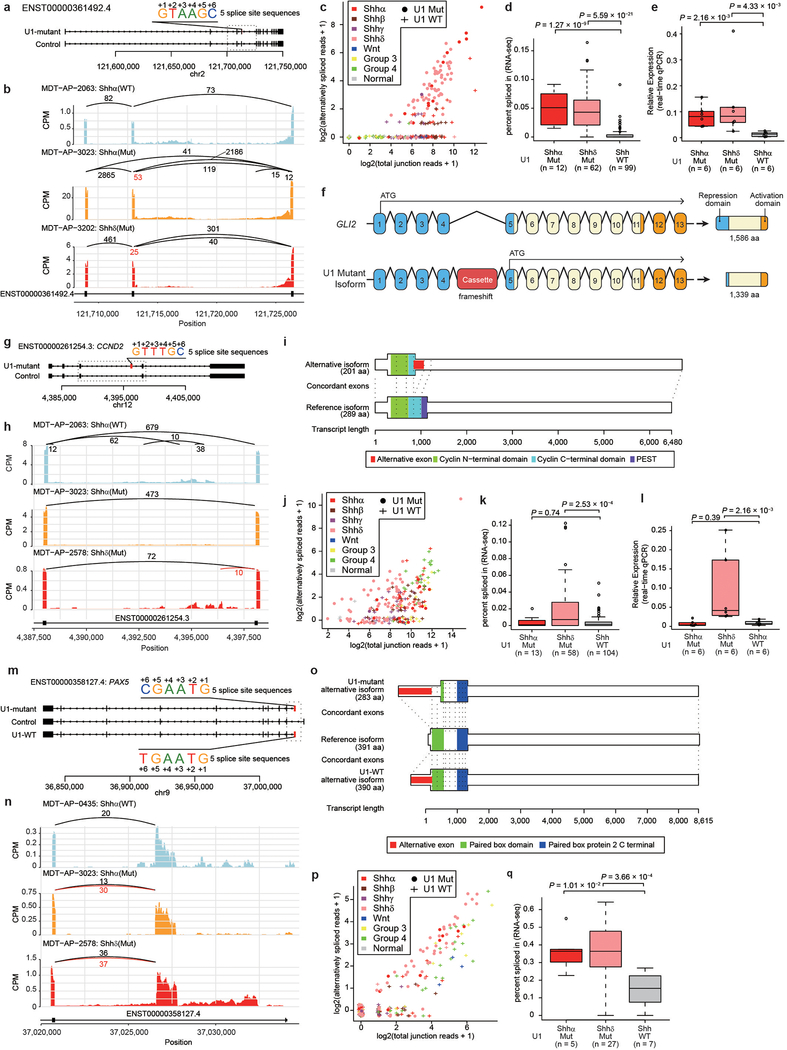
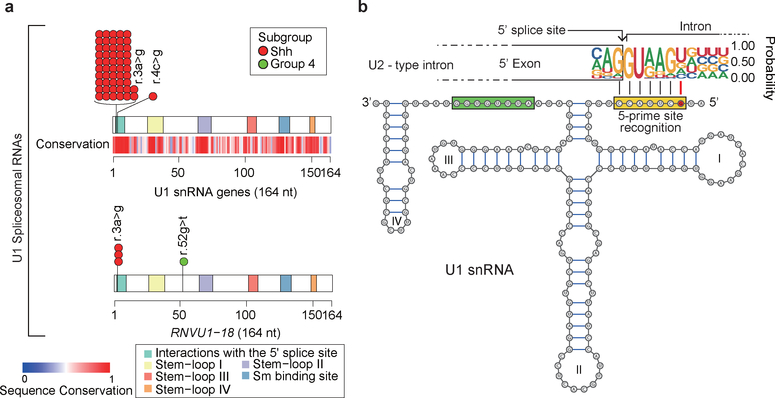
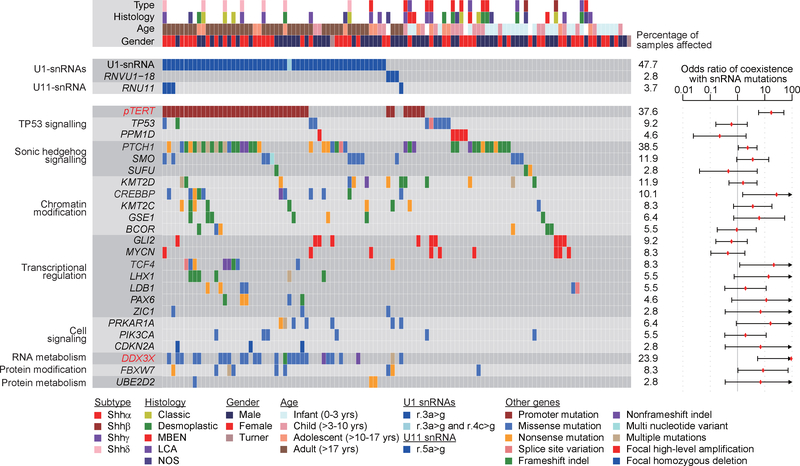
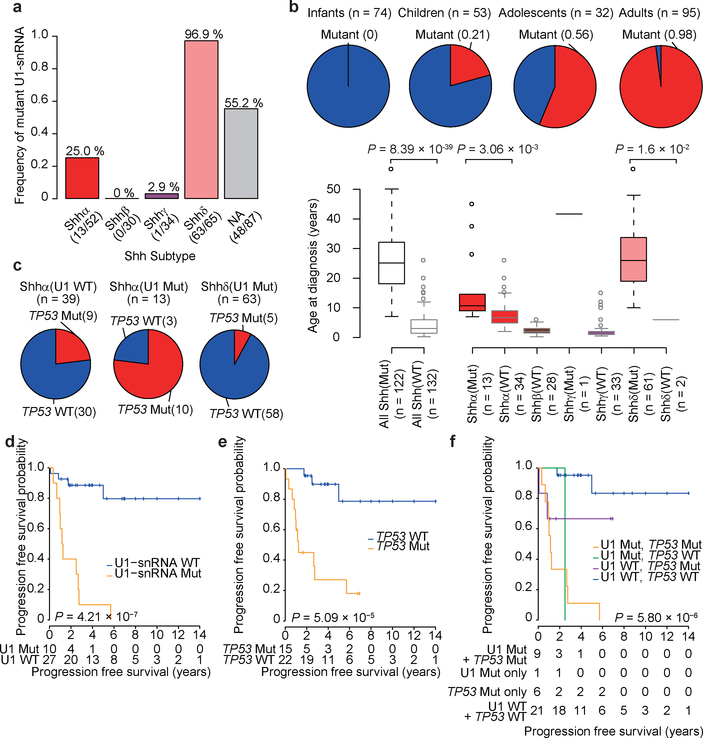
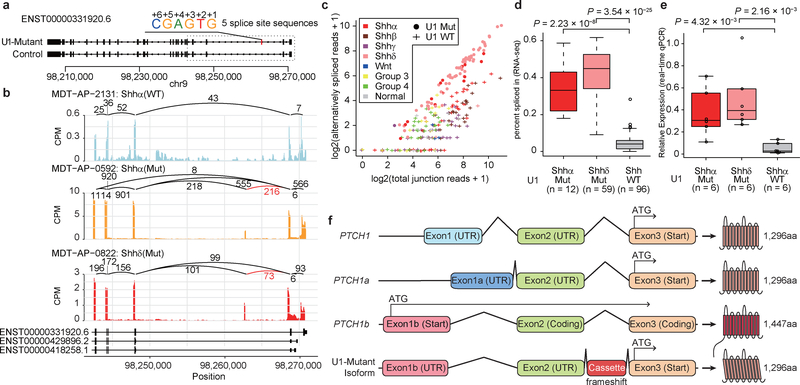
In cancer, recurrent somatic single-nucleotide variants-which are rare in most paediatric cancers-are confined largely to protein-coding genes1-3. Here we report highly recurrent hotspot mutations (r.3A>G) of U1 spliceosomal small nuclear RNAs (snRNAs) in about 50% of Sonic hedgehog (SHH) medulloblastomas. These mutations were not present across other subgroups of medulloblastoma, and we identified these hotspot mutations in U1 snRNA in only <0.1% of 2,442 cancers, across 36 other tumour types. The mutations occur in 97% of adults (subtype SHHδ) and 25% of adolescents (subtype SHHα) with SHH medulloblastoma, but are largely absent from SHH medulloblastoma in infants. The U1 snRNA mutations occur in the 5' splice-site binding region, and snRNA-mutant tumours have significantly disrupted RNA splicing and an excess of 5' cryptic splicing events. Alternative splicing mediated by mutant U1 snRNA inactivates tumour-suppressor genes (PTCH1) and activates oncogenes (GLI2 and CCND2), and represents a target for therapy. These U1 snRNA mutations provide an example of highly recurrent and tissue-specific mutations of a non-protein-coding gene in cancer.


Conflict of interest statement

Competing interests

The authors declare no competing interests.

Figures

Extended Data Fig. 1. –
Extended Data Fig. 1. –. Overview of analyzed cohorts and methods.
a) The detection methods for U1-snRNA mutations by each cohort and comparison methods for alternative splicing analysis. b) Cohort specification. c) Subgroup distribution of whole genome sequencing cohorts.
Extended Data Fig. 2. –
Extended Data Fig. 2. –. U11-snRNA mutations and conservation of U1 and U11 snRNA genes across evolution.
a) Seed sequences of the U1-snRNA obtained from the Rfam database demonstrates high level conservation across a variety eukaryotic species, particularly at the site of the Shh-MB mutation. The consensus sequence, and first 50 nucleotides of reference sequences are included for comparison. Grey indicates nucleotide differences, and red identifies the Shh-MB hotspot mutation. b) Cartoon illustrating the number of somatic mutations in the U11-snRNA genes. U11-snRNA sequence conservation scores as determined by Rfam database. b) Secondary structure of the mutant U11-snRNA. The red circle identifies the location of the hotspot mutation. The yellow and green rectangles indicate the 5′ splice site recognition site and the Sm protein binding site respectively. Numerals I to IV indicate stem-loops. d) Seed sequences of the U11-snRNA obtained from the Rfam database demonstrates high level conservation across a variety eukaryotic species, particularly at the site of the Shh-MB mutation. The consensus sequence, and first 30 nucleotides of reference sequences are included for comparison. Grey indicates nucleotide differences, and red identifies the Shh-MB hotspot mutation.
Extended Data Fig. 3. –
Extended Data Fig. 3. –. High levels of genomic conservation surrounding human U1-snRNAs complicate the specific PCR amplification of any one individual locus.
a) Genomic locations of the four expressed U1 spliceosomal RNA genes (on Chromosome 1p, red), and 136 pseudogenes across the H. Sapiens genome as indicated. Three pseudogenes with sequences identical (hg19) to the expressed U1 genes are indicated in orange. b) Average mapping quality of bwa-mem and coverage of each expressed U1 and U11 spliceosomal RNA genes from WGS from germline samples of medulloblastoma patients are illustrated (n = 341). Blue bars represent Alignability of 100mers by GEM from ENCODE/CRG. Scales of >1,000 bases upstream and downstream are logarithm 10. Red bar indicates the gene body. c) Average number of multi-mapped reads overlapped for each gene pair by STAR aligner. Heatmap shows the average number of mapped reads across WGS from germline samples of medulloblastoma patients (n = 341). d) Sequence similarity of U1-snRNA genes, U1-snRNA pseudogenes with identical 164 bps, and U11-snRNA gene. The numbers in each square and heatmap indicate identity scores and bit scores calculated by blast software. Blank indicates no hit found.
Extended Data Fig. 4. –
Extended Data Fig. 4. –. Allele-specific rhAmp SNP PCR of RNU1 loci, significant copy number changes in U1- mutant versus U1- wildtype Shh-MB and prognostic analysis.
a) The frequency of any U1-snRNA mutation by RNU1_Batch primer set (RNU1–1, RNU1–2, RNU1–3, RNU1–4, and RNVU1–18) (left) and RNU1_Pseudo primer set (RNU1–27P and RNU1–28P) (right). b) Hotspot mutations of RNU1–27P/RNU1–28P U1-snRNA pseudogenes as confirmed by Sanger sequencing. c) Broad copy number aberrations in U1-wildtype Shhα (n = 25), U1-mutant Shhα (n = 8), and U1-mutant Shhδ (n = 41). Dark blue and dark red bars, as well as asterisks, identify statistically significant regions comparing Shhα U1-mutant versus wildtype (P < 0.05, two-sided Fisher’s exact test). d) Significant focal copy number aberrations in U1-wildtype Shhα (n = 25), U1-mutant Shhα (n = 8), and U1-mutant Shhδ (n = 41) illustrate significant genomic differences between U1-wildtype and U1-mutant cases. Candidate target genes within the corresponding loci are indicated. q-values were calculated by GISTIC see Methods. e–g) Overall survival of Shhα stratified by mutational status of U1-snRNA mutation (n = 10 for mutant, n = 27 for wildtype) (e), TP53 (n = 15 for mutant, n = 22 for wildtype) (f), or both (n = 9 for both mutant, n = 1 for U1 mutation only, n = 6 for TP53 mutation only, n = 21 for both wildtype) (g). P-values were determined using the two-sided log-rank test. + indicates censored cases. h, i) Progression-free survival (h) and overall survival (i) stratified by U1-snRNA mutation and Shh subtypes (n = 10 for U1-mutant Shhα, n = 27 for U1-wildtype Shhα, n = 23 for U1-wildtype Shhβ, n = 24 for U1-wildtype Shhγ, n = 46 for U1-mutant Shhδ). P-values were determined using the two-sided log-rank test. + indicates censored cases.
Extended Data Fig. 5. –
Extended Data Fig. 5. –. Intron-centric analysis of Shhδ medulloblastomas.
a) Quantitation of alternative splicing events by Shh subtype as detected by intron-centric alternative splicing analysis (n = 30 each subtype). Bar plot shows adjusted standardized residual of included alternative splicing events, of which positive values indicate relatively higher number, and negative values indicate relatively lower number among subtypes. b) Volcano plots of alternative splicing events (n = 30 each subtype). Significant events (FDR < 0.01 and absolute log effect size > 1.5 calculated by Leafcutter see Methods) are illustrated by color. Alternative splicing events of PTCH1 and GLI2 with the highest effect size are annotated. c) Splice site sequences of included alternative splicing events by subtype (n = 30 each subtype). Asterisk denotes nucleotide sites with q-value < 10−2 (Chi-Squared Test and BH Method).
Extended Data Fig. 6. –
Extended Data Fig. 6. –. Intron-centric analysis of Shhα medulloblastomas.
a,b) Quantitation (a) and proportion (b) of alternative splicing events between U1-mutant Shhα medulloblastoma (n = 13), and U1-wildtype Shhα medulloblastoma (n = 39) as detected by intron-centric alternative splicing analysis. P-value was calculated by Chi-Squared Test. c) Volcano plots of alternative splicing events (n = 13 for U1-mutant Shhα, n = 39 for U1-wildtype Shhα). X axis shows the difference of PSI (percent spliced in) calculated by Leafcutter. Significant events (FDR < 0.01 and absolute log effect size > 1.5 calculated by Leafcutter, see Methods) are illustrated by color. d) Splice site sequences of included alternative splicing events in U1-mutant Shhα subtype (n = 13 for U1-mutant Shhα, n = 39 for U1-wildtype Shhα). Size and color for each circle indicate the q-values and Cramer’s V values for each nucleotide position (q-values were calculated by Chi-square Test and BH method, the precise values were described in Supplementary Table 11). e) Residual analysis of 5′ splice site sequences of Annotated and Cryptic 5′ alternative splicing (n = 13 for U1-mutant Shhα, n = 39 for U1-wildtype Shhα). The size and color for each circle denote the two-sided P-value, and adjusted standardized residual calculated by Haberman’s method. The precise values were described in Supplementary Table 11.
Extended Data Fig. 7. –
Extended Data Fig. 7. –. Nonsense mediated decay pathway in U1-mutant Shh-MB and exogenous expression analyses
a) Enrichment plots of “GO NUCLEAR TRANSCRIBED MRNA CATABOLIC PROCESS NONSENSE MEDIATED DECAY” by GSEA between U1-mutant Shhδ (n = 30) and U1-wildtype other Shh subtypes (n = 90) and U1-mutant Shhα (n = 13) and U1-wildtype Shhα (n = 39). P-values were calculated gsea see Methods. b) Quantitation of alternative splicing events between U1-mutant HEK-293T and U1-wildtype HEK293T as detected by intron-centric alternative splicing analysis. c) Splice site sequences of included alternative splicing events in U1-mutant HEK-293T. Asterisk denotes nucleotide sites with q-value < 10−2 (Chi-Squared Test and BH Method). d) Comparison of the extent of overlap between detected alternative splicing events by U1-mutant Shh (either of Shhα or δ), U1-wildtype Shh (either of Shhα, β or γ) and HEK293T with U1-Mut exogenous expression. (Left) alternatively spliced events with cryptic 5 prime sites, and (Right) alternatively spliced events with cryptic 5 prime sites and ‘C’ base at 6th intron. e) Alternative splicing signatures by t-SNE analysis. Left: The percent spliced-in (psi) values of detected cryptic 5′ alternative splicing events, with a ‘C’ nucleotide at the 6th base in the intron from 5′ splice site. Right Upper: psi values of all cryptic 5′ alternative-splicing events. Right Lower: psi values of all alternative splicing events.
Extended Data Fig. 8. –
Extended Data Fig. 8. –. Retained introns inactivate tumor suppressor genes in U1-snRNA(r.3a>g) mutant tumors.
a) Illustration of the different types of alternative splicing events analyzed by rMATS (n = 30 each subtype). Red arrows indicate expected 5′ prime sites recognized by the mutant U1-snRNA. b) Quantitation of alternative splicing events by Shh subtype, as detected by exon-centric alternative splicing analysis. c) Scatter plots of alternative splicing events (n = 30 each subtype). X axis shows the difference of PSI (percent spliced in) calculated by rMATS. Different types of significant events (FDR < 0.01 and absolute differential PSI > 0.05 calculated by rMATS see Methods) are illustrated by different colors as annotated. d) Splice site sequences of alternative five prime splice site, included cassette exon (CE) and included retained intron (RI) events in U1-snRNA mutant Shhδ (n = 30). Each event corresponds to a red arrow cartoon in ‘a’. Asterisk denotes nucleotide sites with q-value < 10−2 (Chi-Squared Test and BH Method). e) Distribution of percent spliced in for PAX6 based on U1-snRNA mutation status (n = 13 for Shhα U1-mutant, n = 30 for Shhδ U1-mutant, n = 99 for U1-wildtype Shh (n = 90) and normal brain tissue (n = 9)). Dashed line defines threshold that divides the dataset into two groups (k-means method). Table displays number of samples above the threshold (high) or below (low) based on mutational status. P-value is calculated using two-sided Fisher’s exact test compared to U1-wildtype samples. U1-snRNA Mutant samples are indicated in pink, and wildtype samples in blue. f) Sashimi-plot of splicing of PAX6 based on mutational status determined by exon-centric alternative splicing analysis (rMATS). The bar plot shows modified fragments per kilobase per millions mapped (mFPKM). Numbers enumerate average junctional reads across all samples. Annotated exon tracks are shown below with genomic positions marked. g) Distribution of percent spliced in for TOX4 based on U1-snRNA mutation status status (n = 13 for U1-mutant Shhα, n = 30 for U1-mutant Shhδ, n = 99 for U1-wildtype Shh (n = 90) and normal brain tissue (n = 9)). Dashed line defines threshold that divides the dataset into two groups (k-means method). Table displays number of samples above the threshold (high) or below (low) based on mutational status. P-value is calculated using two-sided Fisher’s exact test compared to U1-wildtype samples. U1-snRNA mutant samples are indicated in pink, and wildtype samples in blue. h) Sashimi-plot of splicing of TOX4 based on mutational status determined by exon-centric alternative splicing analysis (rMATS). The bar plot shows modified fragments per kilobase per millions mapped (mFPKM). Numbers enumerate average junctional reads across all samples. Annotated exon tracks are shown below with genomic positions marked.
Extended Data Fig. 9. –
Extended Data Fig. 9. –. Exon-centric analysis of Shhα medulloblastomas and overlapped splicing events
a) Quantitation of alternative splicing events between U1-mutant Shhα medulloblastoma, and U1-wildtype Shhα medulloblastoma, as detected by exon-centric alternative splicing analysis. b) Scatter plots of alternative splicing events (n = 13 for U1-mutant Shhα, n = 39 for U1-wildtype Shhα). X axis shows the difference of PSI (percent spliced in) calculated by rMATS. Different types of significant events (FDR < 0.01 and absolute differential PSI > 0.05 calculated by rMATS, see Methods) are illustrated by different colors as annotated. c) Splice site sequences of alternative five prime splice site, included cassette exon (CE), included retained intron (RI) events in U1-mutant Shhα medulloblastoma and U1-wildtype Shhα medulloblastoma. Each event corresponds to a red arrow cartoon in ‘a’. Asterisk denotes nucleotide sites with q-value < 10−2 (Chi-Squared Test and BH Method). d) Boxplot of fold changes in expression of the alternatively spliced isoform as compared to the wildtype isoform in subsets of Shh-MB as determined by real-time qPCR. Boxplot center lines show data median; box limits indicate the IQR from the 25th and 75th percentiles; lower and upper whiskers extend 1.5 times the IQR. Outliers are represented by individual points. P-values were calculated using two-sided Wilcoxon-rank sum test. e) Comparison of the extent of overlap between splicing events by Shh subtype and U1 mutational status. Effect sizes are calculated by LeafCutter with an absolute effect size threshold of 1.5.
Extended Data Fig. 10. –
Extended Data Fig. 10. –. Aberrant splicing of oncogenes and tumor suppressor genes in U1- mutant Shh-MB.
a) Overview of cryptic alternative splicing of GLI2 demonstrating the position of a cryptic cassette exon with the 5′ splice site sequence. b) Sashimi-plot of splicing of GLI2 in representative cases. The bar plot shows counts per million reads. Numbers enumerate junctional reads, with U1-mutant isoform reads in red. c) Scatter plot comparing detected alternatively spliced read and total junction reads which shared 3 prime splice site. Jittering was performed for both values. d) ‘Percent spliced in’ values by U1-mutant Shhα, U1-mutant Shhδ, and U1-wildtype Shh (all Shh subtypes). Boxplot center lines show data median; box limits indicate the IQR from the 25th and 75th percentiles; lower and upper whiskers extend 1.5 times the IQR. Outliers are represented by individual points. P-values were calculated using two-sided Wilcoxon-rank sum test. e) Boxplot of fold changes in expression of the alternatively spliced isoform as compared to the wildtype isoform of GLI2 in subsets of Shh-MB as determined by real-time qPCR. Boxplot center lines show data median; box limits indicate the IQR from the 25th and 75th percentiles; lower and upper whiskers extend 1.5 times the IQR. Outliers are represented by individual points. P-values were calculated using two-sided Wilcoxon-rank sum test. f) Illustration of canonical and cryptic isoform of GLI2. Translation start sites are indicated with an ATG arrow. Resulting proteins (and size) are displayed for each isoform. Repression and activation domains are indicated in blue and orange respectively. aa denotes amino acids. g) Overview of cryptic alternative splicing of CCND2 illustrating the position of a cryptic cassette exon with the 5′ splice site sequence. h) Sashimi-plot of representative cases demonstrates alternative splicing at the CCND2 locus. Numbers illustrate junctional reads. Junctional reads specific to U1-mutants are in red. i) The canonical isoform and the cryptic isoform of CCND2. j) Scatter plot comparing detected alternatively spliced read and total junction reads which shared 3 prime splice. Jittering was performed for both values. k) ‘Percent spliced in’ values by U1-mutant Shhα (n = 13), U1-mutant Shhδ (n = 58), and U1-wildtype Shh (all Shh subtypes, n = 104). Boxplot center lines show data median; box limits indicate the IQR from the 25th and 75th percentiles; lower and upper whiskers extend 1.5 times the IQR. Outliers are represented by individual points. P-values were calculated using two-sided Wilcoxon-rank sum test. l) Real-time qPCR comparing the expression of the cryptic isoform of CCND2 demonstrates high levels of expression of CCND2 restricted to Shhδ cases (n = 6 for U1-mutant Shhα, n = 6 for U1-mutant Shhδ, n = 6 for U1-wildtype Shhα). Boxplot center lines show data median; box limits indicate the IQR from the 25th and 75th percentiles; lower and upper whiskers extend 1.5 times the IQR. Outliers are represented by individual points. P-values were calculated using two-sided Wilcoxon-rank sum test. m) Overview of cryptic alternative splicing of PAX5 illustrating the position of a cryptic cassette exon with the 5′ splice site sequence. n) Sashimi-plot of representative cases demonstrates alternative splicing at the PAX5 locus. Numbers illustrate junctional reads. Junctional reads specific to U1-mutants are in red. o) The canonical isoform and the cryptic isoform of PAX5. p) Scatter plot comparing detected alternatively spliced read and total junction reads which shared 3 prime splice site. Jittering was performed for both values. q) ‘Percent spliced in’ values by U1-mutant Shhα (n = 5), U1-mutant Shhδ (n = 27), and U1-wildtype Shh (all Shh subtypes, n = 7). Boxplot center lines show data median; box limits indicate the IQR from the 25th and 75th percentiles; lower and upper whiskers extend 1.5 times the IQR. Outliers are represented by individual points. P-values were calculated using two-sided Wilcoxon-rank sum test.
Figure 1. –
Figure 1. –. Highly recurrent mutations of the U1-snRNAs in Shh-MB
a) Cartoon illustrating the number and subgroup specific distribution of somatic mutations in the U1-snRNA genes. U1-snRNA sequence conservation scores as determined by Rfam database. b) Secondary structure of the mutant U1-snRNA. The red circle identifies the location of the hotspot mutation. The yellow and green rectangles indicate the 5′ splice site recognition site and the Sm protein binding site respectively. Numerals I to IV indicate stem-loops.
Figure 2. –
Figure 2. –. Mutational repertoire of snRNA mutant Shh-MBs
Genomic landscape of mutations in Shh-MBs (n = 109) with and without U1/U11 mutations. Odds ratios (red dots) of coexistence of U1 and U11 snRNA mutations with other somatic events are shown with 95% confidence interval. Arrowheads represent values out of axis range. Significantly correlated mutations are denoted in red (False-discovery-rate (FDR) < 0.1, asymptotic P-values from odd-ratio tests (H0: odds-ratio = 1, see Methods) with Benjamini and Hochberg adjustment for multiple testing.
Figure 3. –
Figure 3. –. Clinical and cytogenetic features of U1-mutant Shh-MBs
a) Frequency of U1-snRNA mutations across Shh-MB subtypes. NA denotes samples where subtype is unknown. b) Upper: frequency of U1-snRNA mutation by age group (n = 74 for infants, n = 53 for children, n = 32 for adolescents, n = 95 for adults). Bottom: age distribution by subtype (n = 47 for Shhα, n = 28 for Shhβ, n = 34 for Shhγ, n = 63 for Shhδ, n = 180 for unknow subtype) and U1-snRNA mutational status (n = 122 for mutant, n = 132 for wildtype). P-values were calculated by two-sided Wilcoxon-rank sum test. Boxplot center lines show data median; box limits indicate the interquartile range (IQR) from the 25th and 75th percentiles; lower and upper whiskers extend 1.5 times the IQR. Outliers are represented by individual points. c) Frequency of TP53 mutation in U1-mutant and wildtype tumors. d–f) Progression-free survival of Shhα stratified by mutational status of U1-snRNA(d) (n = 10 for mutant, n = 27 for wildtype), TP53 (e) (n = 15 for mutant, n = 22 for wildtype), or both (f) (n = 9 for both mutant, n = 1 for U1 mutation only, n = 6 for TP53 mutation only, n = 21 for both wildtype). P-values were determined using the two-sided log-rank test. + indicates censored cases.
Figure 4. –
Figure 4. –. Aberrant splicing of Hedgehog signaling genes in U1-mutant Shh-MB
a) Overview of cryptic alternative splicing of PTCH1 demonstrating the position of a cryptic cassette exon with the 5′ splice site sequence. b) Sashimi-plot of splicing of PTCH1 in representative cases. The bar plot shows counts per million reads. Numbers enumerate junctional reads. Annotated exon tracks are shown below with genomic positions marked. Junctional reads specific to U1-mutants are in red. c) Scatter plot comparing detected alternatively spliced read and total junction reads which shared 3 prime splice site. Jittering was performed for both values. d) ‘Percent spliced in’ values by U1-mutant Shhα, U1-mutant Shhδ, and U1-wildtype Shh (all Shh subtypes). Boxplot center lines show data median; box limits indicate the IQR from the 25th and 75th percentiles; lower and upper whiskers extend 1.5 times the IQR. Outliers are represented by individual points. P-values were calculated using two-sided Wilcoxon-rank sum test. e) Boxplot of fold changes in expression of the alternatively spliced isoform of PTCH1 as compared to the wildtype isoform of PTCH1 in subsets of Shh-MB as determined by real-time qPCR. Boxplot center lines show data median; box limits indicate the IQR from the 25th and 75th percentiles; lower and upper whiskers extend 1.5 times the IQR. Outliers are represented by individual points. Data represent means ± standard deviation. P-values were calculated using two-sided Wilcoxon-rank sum test. f) Illustration of canonical isoforms and the cryptic alternative isoform of PTCH1. Putative translation start sites are indicated with an arrow. Resulting proteins (and size) are displayed for each isoform. UTR denotes an untranslated region. Amino acids are denoted aa.

References

    1. Pugh TJ et al. Medulloblastoma exome sequencing uncovers subtype-specific somatic mutations. Nature 488, 106–110, doi:10.1038/nature11329 (2012). - DOI - PMC - PubMed
    1. Jones DT et al. Dissecting the genomic complexity underlying medulloblastoma. Nature 488, 100–105, doi:10.1038/nature11284 (2012). - DOI - PMC - PubMed
    1. Northcott PA et al. The whole-genome landscape of medulloblastoma subtypes. Nature 547, 311–317, doi:10.1038/nature22973 (2017). - DOI - PMC - PubMed
    1. Northcott PA, Korshunov A, Pfister SM & Taylor MD The clinical implications of medulloblastoma subgroups. Nat Rev Neurol 8, 340–351, doi:10.1038/nrneurol.2012.78 (2012). - DOI - PubMed
    1. Northcott PA et al. Medulloblastoma comprises four distinct molecular variants. Journal of clinical oncology : official journal of the American Society of Clinical Oncology 29, 1408–1414, doi:10.1200/JCO.2009.27.4324 (2011). - DOI - PMC - PubMed

Methods References

    1. Morrissy AS et al. Divergent clonal selection dominates medulloblastoma at recurrence. Nature 529, 351–357, doi:10.1038/nature16478 (2016). - DOI - PMC - PubMed
    1. Cibulskis K et al. Sensitive detection of somatic point mutations in impure and heterogeneous cancer samples. Nat Biotechnol 31, 213–219, doi:10.1038/nbt.2514 (2013). - DOI - PMC - PubMed
    1. Shiraishi Y et al. An empirical Bayesian framework for somatic mutation detection from cancer genome sequencing data. Nucleic acids research 41, e89, doi:10.1093/nar/gkt126 (2013). - DOI - PMC - PubMed
    1. Koboldt DC et al. VarScan 2: somatic mutation and copy number alteration discovery in cancer by exome sequencing. Genome research 22, 568–576, doi:10.1101/gr.129684.111 (2012). - DOI - PMC - PubMed
    1. Saunders CT et al. Strelka: accurate somatic small-variant calling from sequenced tumor-normal sample pairs. Bioinformatics 28, 1811–1817, doi:10.1093/bioinformatics/bts271 (2012). - DOI - PubMed

Publication types