. 2019 Nov;33(6):2752-2764.
doi: 10.1111/jvim.15641. Epub 2019 Oct 30.

Enteroinsular axis response to carbohydrates and fasting in healthy newborn foals

Affiliations

Enteroinsular axis response to carbohydrates and fasting in healthy newborn foals

Lindsey M Rings et al. J Vet Intern Med. 2019 Nov.

Abstract

Background: The enteroinsular axis (EIA) comprises intestinal factors (incretins) that stimulate insulin release after PO ingestion of nutrients. Glucose-dependent insulinotropic polypeptide (GIP) and glucagon-like peptide-1 (GLP-1) are the main incretins. The EIA has not been investigated in healthy neonatal foals but should be important because energy demands are high in healthy foals and dysregulation is frequent in sick foals.

Objectives and hypothesis: To evaluate the EIA response to carbohydrates or fasting in newborn foals. We hypothesized that incretin secretion would be higher after PO versus IV carbohydrate administration or fasting.

Animals: Thirty-six healthy Standardbred foals ≤4 days of age.

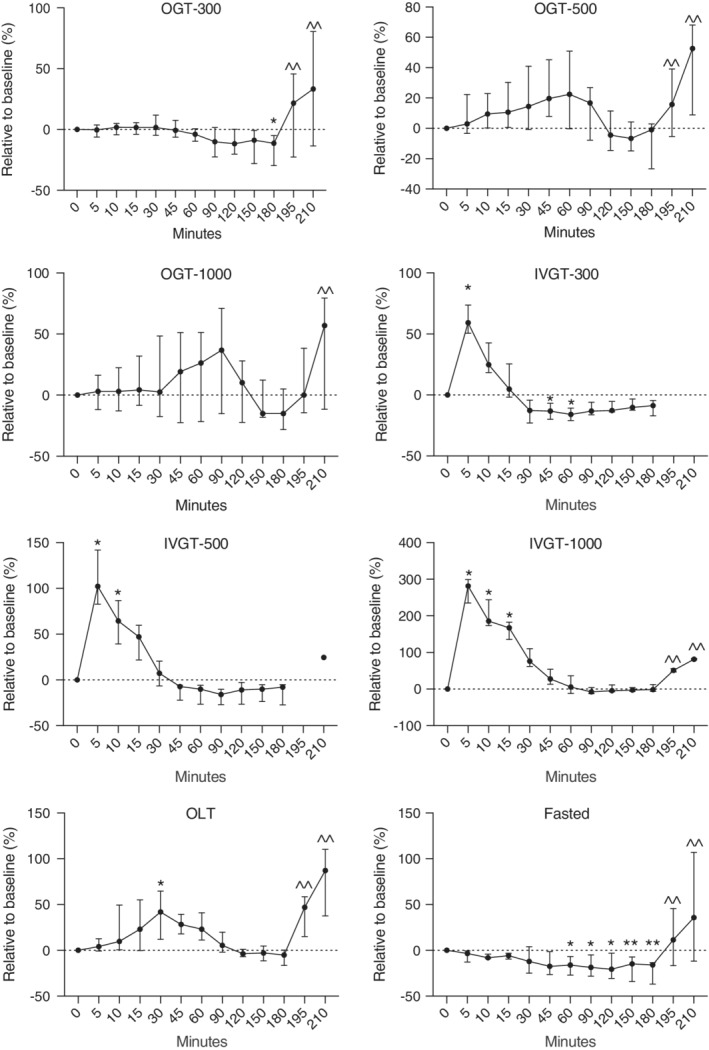
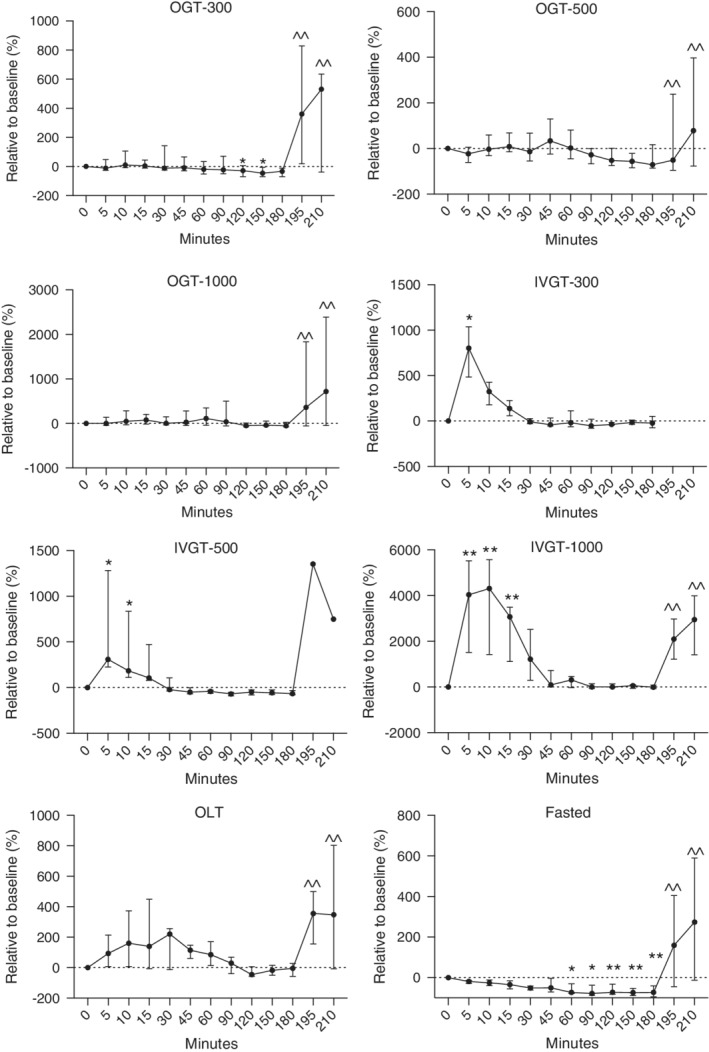
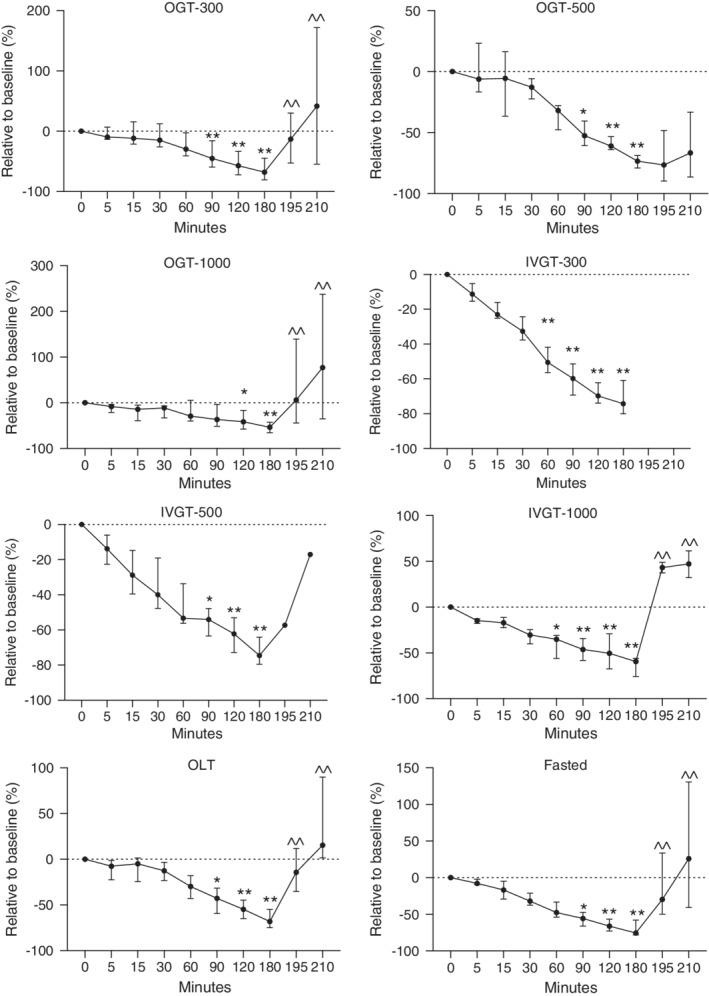
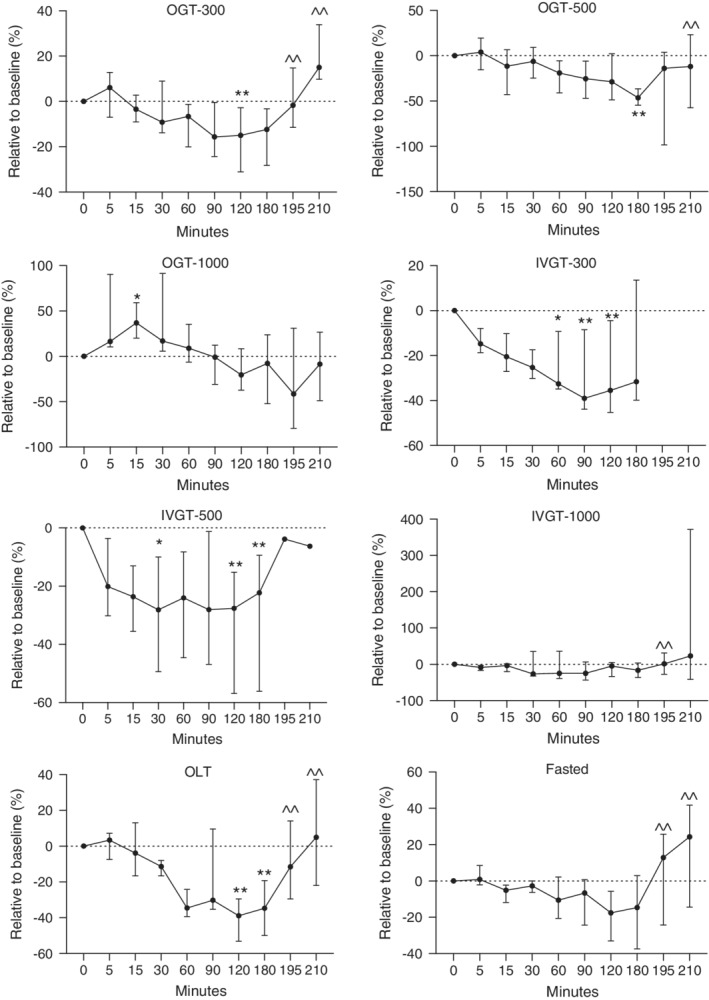
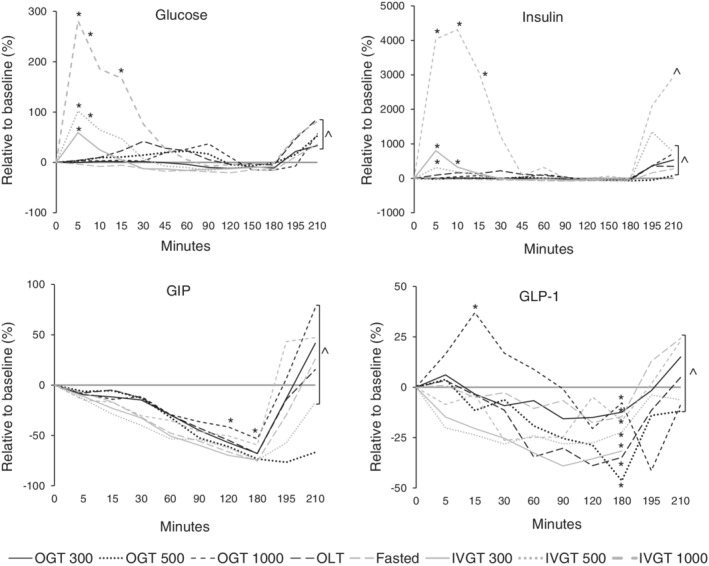
Methods: Prospective study. Blood was collected before and after a PO glucose test (OGT; 300, 500, 1000 mg/kg), an IV glucose test (IVGT; 300, 500, 1000 mg/kg), a PO lactose test (OLT; 1000 mg/kg), and fasting. Foals were muzzled for 240 minutes. Blood was collected over 210 minutes glucose, insulin, GIP, and GLP-1 concentrations were measured.

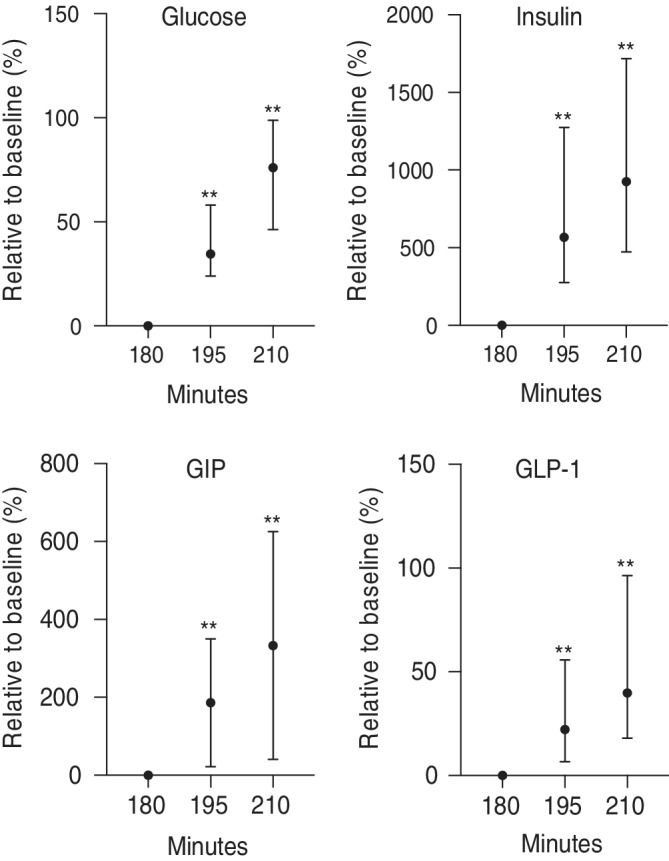
Results: Only PO lactose caused a significant increase in blood glucose concentration (P < .05). All IV glucose doses induced hyperglycemia and hyperinsulinemia. Concentrations of GIP and GLP-1 decreased until foals nursed (P < .05), at which time rapid increases in glucose, insulin, GIP, and GLP-1 concentrations occurred (P < .05).

Conclusions and clinical importance: Healthy newborn foals have a functional EIA that is more responsive to milk and lactose than glucose. Non-carbohydrate factors in mare's milk may be important for EIA activity. Constant exposure of intestinal cells to nutrients to maintain EIA activity could be relevant to management of sick foals. Foals can be fasted for 4 hours without experiencing hypoglycemia.

Keywords: equine; incretin; insulin; intestine; neonate; pancreas.


Conflict of interest statement

Authors declare no conflict of interest.

Figures

Figure 1
Figure 1
Relative changes in blood glucose concentrations in healthy newborn foals administered glucose orally (300, 500, and 1000 mg/kg) and IV (300, 500, and 1000 mg/kg), lactose (1000 mg/kg), and fasted. Fasted, no treatment; IVGT, IV glucose test; OGT, oral glucose test; OLT, oral lactose test. Values (median, interquartile range [IQR]) presented relative (%) to time 0. Y axis scaling between figures is different to emphasize changes. *P < .05; **P < .01 compared to time 0; ^^P < .05 compared to 180 minutes
Figure 2
Figure 2
Relative changes in plasma insulin concentrations in healthy newborn foals administered glucose orally (300, 500, and 1000 mg/kg) and IV (300, 500, and 1000 mg/kg), lactose (1000 mg/kg), and fasted. Fasted, no treatment; IVGT, IV glucose test; OGT, oral glucose test; OLT, oral lactose test. Values (median, interquartile range [IQR]) presented relative (%) to time 0. Y axis scaling between figures is different to emphasize changes. *P < .05; **P < .01 compared to time 0; ^^P < .05 compared to 180 minutes
Figure 3
Figure 3
Relative changes in plasma GIP concentrations in healthy newborn foals administered glucose orally (300, 500, and 1000 mg/kg) and IV (300, 500, and 1000 mg/kg), lactose (1000 mg/kg), and fasted. Fasted, no treatment; IVGT, IV glucose test; OGT, oral glucose test; OLT, oral lactose test. Values (median, interquartile range [IQR]) presented relative (%) to time 0. Y axis scaling between figures is different to emphasize changes. *P < .05; **P < .01 compared to time 0; ^^P < .05 compared to 180 minutes
Figure 4
Figure 4
Relative changes in plasma GLP‐1 concentrations in healthy newborn foals administered glucose orally (300, 500, and 1000 mg/kg) and IV (300, 500, and 1000 mg/kg), lactose (1000 mg/kg), and fasted. Fasted, no treatment; IVGT, IV glucose test; OGT, oral glucose test; OLT, oral lactose test. Values (median, interquartile range [IQR]) presented relative (%) to time 0. Y axis scaling between figures is different to emphasize changes. *P < .05; **P < .01 compared to time 0; ^^P < .05 compared to 180 minutes
Figure 5
Figure 5
Relative changes in blood glucose, insulin, GLP‐1, and GIP concentrations in healthy newborn foals. Fasted, no treatment; IVGT, IV glucose test; OGT, oral glucose test; OLT, oral lactose test. Values presented relative (%) to time 0. interquartile range [IQR] and statistical significance have been omitted but presented in Figures 1, 2, 3, 4
Figure 6
Figure 6
Relative changes in blood glucose, insulin, GIP, and GLP‐1 concentrations in all newborn foals after allowed to nurse. Values presented relative (%) to 180 minutes. **P < .01 compared to 180 minutes

References

    1. Campbell JE, Drucker DJ. Pharmacology, physiology, and mechanisms of incretin hormone action. Cell Metab. 2013;17(6):819‐837. 10.1016/j.cmet.2013.04.008. - DOI - PubMed
    1. Seino Y, Fukushima M, Yabe D. GIP and GLP‐1, the two incretin hormones: similarities and differences: similarities and differences of GIP and GLP‐1. J Diabetes Investig. 2010;1(1–2):8‐23. 10.1111/j.2040-1124.2010.00022.x. - DOI - PMC - PubMed
    1. Baggio LL, Drucker DJ. Biology of incretins: GLP‐1 and GIP. Gastroenterology. 2007;132(6):2131‐2157. 10.1053/j.gastro.2007.03.054. - DOI - PubMed
    1. Doyle ME, Egan JM. Mechanisms of action of glucagon‐like peptide 1 in the pancreas. Pharmacol Ther. 2007;113(3):546‐593. 10.1016/j.pharmthera.2006.11.007. - DOI - PMC - PubMed
    1. Vilsbøll T, Holst JJ. Incretins, insulin secretion and type 2 diabetes mellitus. Diabetologia. 2004;47(3):357‐366. 10.1007/s00125-004-1342-6. - DOI - PubMed

Publication types