. 2019 Oct 29;29(5):1147-1163.e5.
doi: 10.1016/j.celrep.2019.09.059.

A Mechanism Linking Two Known Vulnerability Factors for Alcohol Abuse: Heightened Alcohol Stimulation and Low Striatal Dopamine D2 Receptors

Affiliations

A Mechanism Linking Two Known Vulnerability Factors for Alcohol Abuse: Heightened Alcohol Stimulation and Low Striatal Dopamine D2 Receptors

Miriam E Bocarsly et al. Cell Rep. .

Abstract

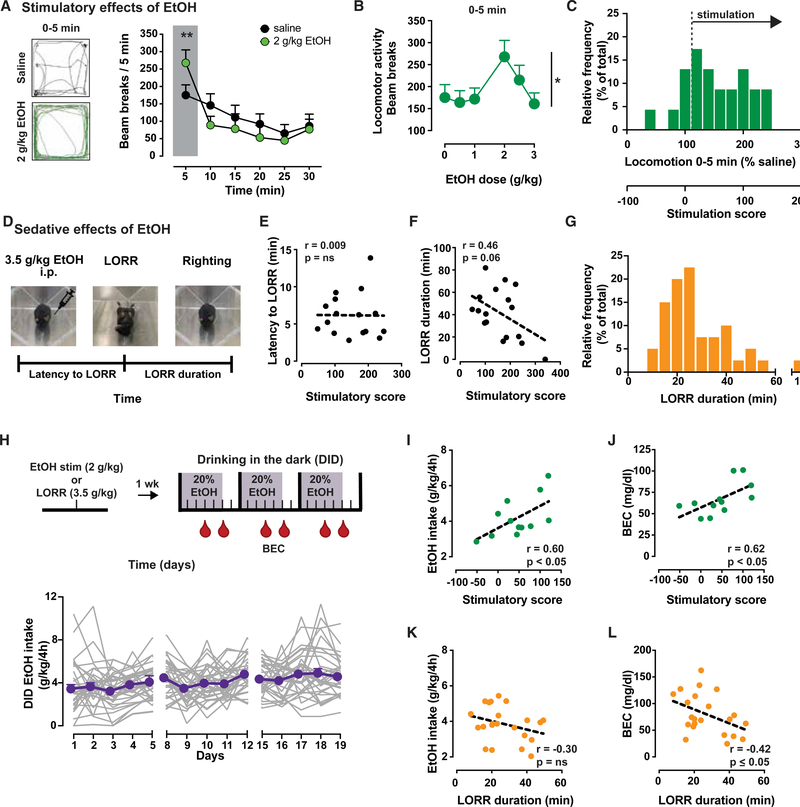
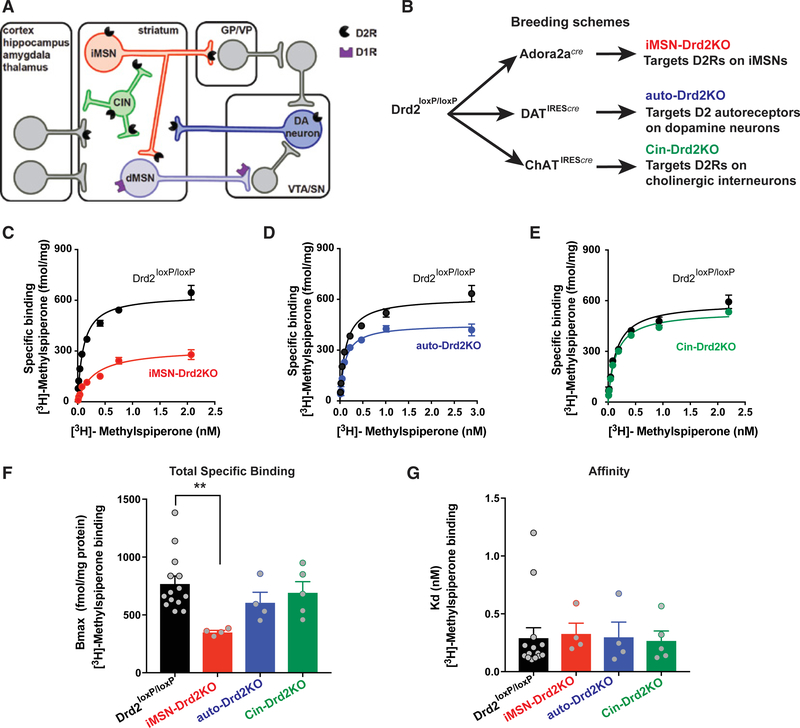
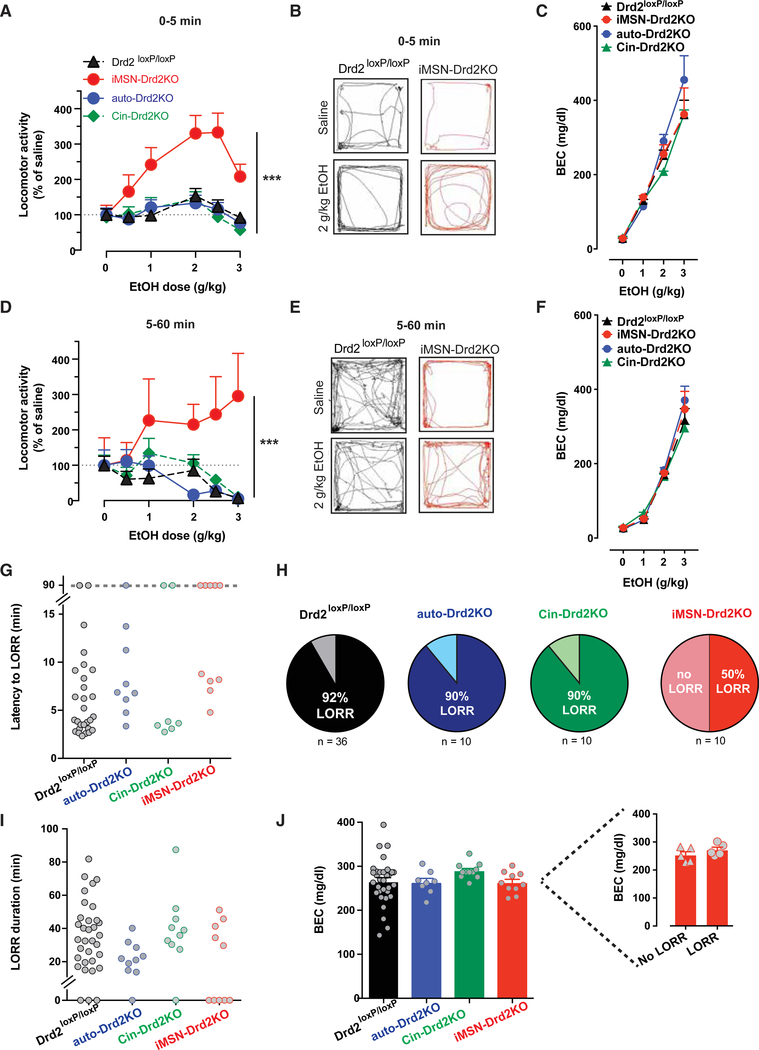
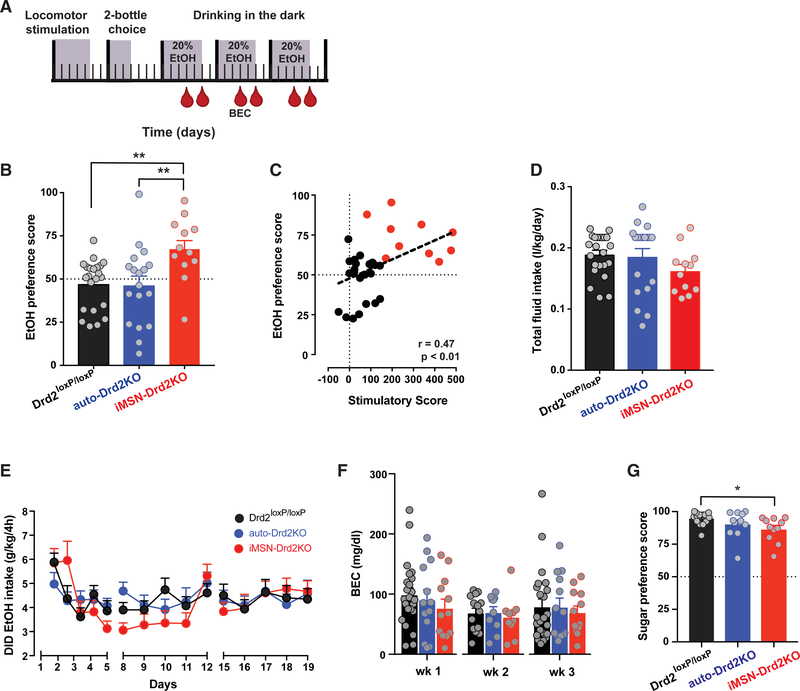
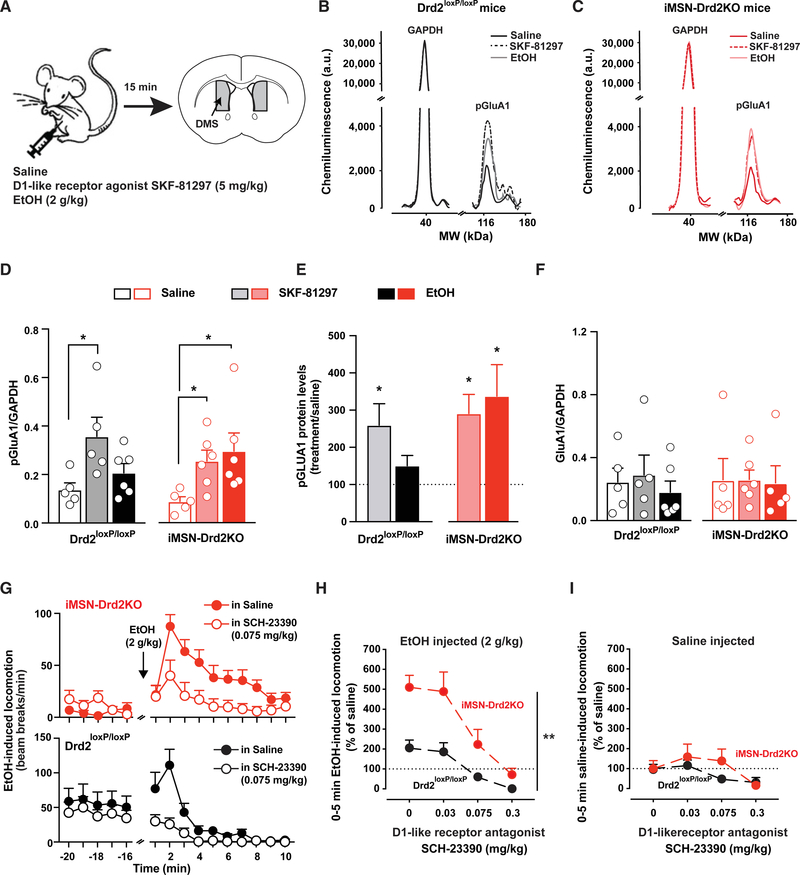
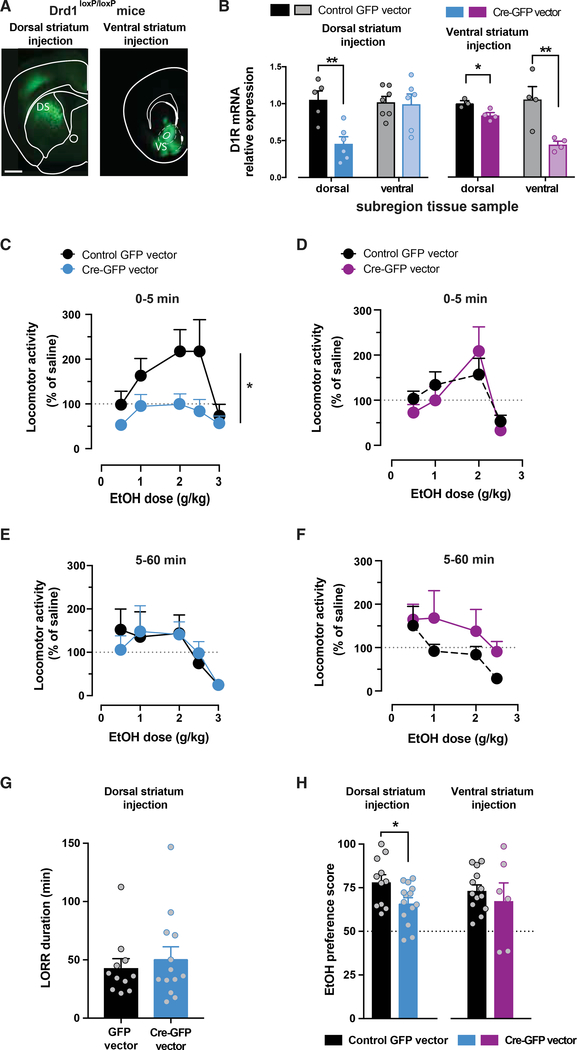
Alcohol produces both stimulant and sedative effects in humans and rodents. In humans, alcohol abuse disorder is associated with a higher stimulant and lower sedative responses to alcohol. Here, we show that this association is conserved in mice and demonstrate a causal link with another liability factor: low expression of striatal dopamine D2 receptors (D2Rs). Using transgenic mouse lines, we find that the selective loss of D2Rs on striatal medium spiny neurons enhances sensitivity to ethanol stimulation and generates resilience to ethanol sedation. These mice also display higher preference and escalation of ethanol drinking, which continues despite adverse outcomes. We find that striatal D1R activation is required for ethanol stimulation and that this signaling is enhanced in mice with low striatal D2Rs. These data demonstrate a link between two vulnerability factors for alcohol abuse and offer evidence for a mechanism in which low striatal D2Rs trigger D1R hypersensitivity, ultimately leading to compulsive-like drinking.

Keywords: alcohol use disorders; dopamine D1 receptors; dorsal medial striatum; ethanol; ethanol self-administration; loss of righting reflex; sedation; striatum.


Conflict of interest statement

DECLARATION OF INTERESTS

The authors declare no competing interests.

Figures

Figure 1.
Figure 1.. Inbred Mice Show Ethanol Stimulatory and Sedative Effects with Individual Variability Correlating with Intoxication
A) Left, sample traces of locomotor activity for 5 min following injection of saline (black) or 2 g/kg ethanol (green) in Drd2loxP/loxP mice (n = 23). Right, time course of locomotor activity following saline (black) or 2 g/kg ethanol (green) in Drd2loxP/loxP mice (2-way repeated-measures [RMs] ANOVA: F5,110 = 4.3, p < 0.01). Shaded box highlights ethanol stimulation during first 5 min. **p < 0.01, Bonferroni’s multiple comparison. (B) Dose-dependent ethanol stimulation plotted as locomotion 5 min after ethanol administration (n = 23; F3.59,78.89 = 2.8; *p < 0.05). (C) Frequency histogram of individual mouse responses to 2 g/kg ethanol during first 5 min, presented as percentage of activity after saline (top × axis) and as stimulation score (bottom × axis). (D) Schematic illustrating the loss of righting reflex (LORR) task. (E and F) No significant correlation between stimulatory scores and latency to LORR (E) (n = 17; Pearson’s r = 0.01, p > 0.05), while an inverse trend is seen between stimulation scores and LORR duration in Drd2loxP/loxP mice (F) (n = 17; Pearson’s r = 0.46, p = 0.06). (G) Frequency histogram of mouse LORR duration illustrates the range of individual variability. (H) Top, outline of experimental protocol showing sequence of tests and days (ticks) in which tail blood samples (red drop) were taken and processed for BEC. Bottom, average ethanol intake (purple symbols) of individual mouse data (gray lines; n = 34). (I and J) The mean individual ethanol intake (I) and BEC (J) achieved during DID show a significant positive correlation with the stimulation score of each mouse (n = 12; Pearson’s r = 0.6 and r = 0.62, respectively; p < 0.05). (K and L) The mean individual ethanol intake showed no correlation with LORR duration (K) (n = 22; Pearson’s r = −0.42, p ≤ 0.05) but an inverse correlation with mean BEC achieved during DID (L) (Pearson’s r = −0.30, p > 0.05). All of the symbols with error bars are means ± SEMs; symbols without error bars represent data from individual animals.
Figure 2.
Figure 2.. Cell-Specific Deletion of Drd2 Gene Causes Selective Reduction of D2R Binding Availability
(A) Diagram illustrating the main neuronal populations, with D2Rs localized in the striatum. (B) Breeding scheme for the cell-specific knockout of Drd2. (C–E) Representative saturation binding curves for [3H]-methylspiperone in striatal samples from iMSN-Drd2KO (C), auto-Drd2KO (D), and Cin-Drd2KO (E) and respective littermate controls. Lines represent fit from non-linear regression analyses. (F and G) Total specific binding, Bmax, (F) and binding affinity, dissociation constant (G). **p < 0.01, Dunnett’s multiple comparison after 1-way ANOVA: F5,31 = 2.6, p < 0.05 for total specific binding. No difference was seen in Kd across genotypes (F5,31 = 0.13, p > 0.05; n = 4–5/group, 3 replicates). All of the symbols with error bars are means ± SEMs; symbols without error bars represent data from individual animals.
Figure 3.
Figure 3.. iMSN-Drd2KO Mice Display High Ethanol Stimulation and Resiliency to Ethanol Sedation
(A and D) Dose-response curve of ethanol-induced locomotion for iMSN-Drd2KO (red), auto-Drd2KO (blue), Cin-Drd2KO (green), and littermate control (black) mice 5 min following ethanol administration (A); n = 12–23/group; 2-way RMs ANOVA ethanol dose × genotype: F15,250 = 2.69, p < 0.001; ***p < 0.001. Main effect of dose: F5,250 = 8.15, p < 0.0001. Main effect of genotype: F3,50 = 13.8, p < 0.0001, and 5–60 min following ethanol injection (D); ethanol dose × genotype: F15,250 = 2.27, p < 0.001; ***p < 0.001. Main effect of genotype: F3,50 = 4.06, p < 0.05. (B and E) Representative traces of locomotor activity in Drd2loxP/loxP (black) and iMSN-Drd2KO (red) mice during first 5 min (B) and 5–60 min (E) following saline injection (left) or 2 g/kg ethanol (right). (C and F) BEC measured 5 min (C); n = 8–12/group; 2-way RMs ANOVA ethanol dose × genotype: F9,100 = 0.89, p > 0.05 and 60 min (F); 2-way RMs ANOVA ethanol dose × genotype: F9,96 = 0.97, p > 0.05 following injection of 0, 1, 2, and 3 g/kg ethanol. (G and I) Time to LORR (G) (n = 7–10/group; 1-way ANOVA: F2,32 = 0.25, p > 0.05) and duration of LORR (I); 1-way ANOVA: F2,32 = 2.42, p > 0.05. Data points above dotted line (G) indicate mice that did not lose the righting reflex by the 90-min cutoff time. (H) Percentage of mice from each genotype that lost the righting reflex for each genotype. (J) BEC measured at regaining righting reflex or at the cutoff time (1-way ANOVA: F3,58 = 1.19, p > 0.05). Inset shows BEC for iMSN-Drd2KO mice that lost the righting reflex (LORR) compared to those that did not (no LORR; independent sample t test: t(8) = 0.1, p > 0.05). All of the symbols with error bars are means ± SEMs; symbols without error bars represent data from individual animals.
Figure 4.
Figure 4.. Higher Preference for Ethanol Drinking in Mice Lacking D2Rs in iMSNs
(A) Schematic of experimental design; mice were tested for ethanol-induced locomotion followed by 2-bottle ethanol preference test and 3 weeks of DID. Blood sampling for BEC indicated by red drop. Shaded areas indicate days of experimental testing. (B) Average ethanol preference scores on 2-bottle choice (n = 12–23/group; 1-way ANOVA: F2,49 = 5.87, p < 0.01) followed by Tukey tests; **p < 0.01. (C) Individual preference scores plotted as a function of stimulatory score for each Drd2loxP/loxP (black) and iMSN-Drd2KO (red) mouse (Pearson’s r = 0.47, p < 0.01). (D) No differences in total daily fluid intake during 2-bottle choice test (1-way ANOVA: F2,51 = 0.19, p > 0.05). (E) Average daily ethanol intake during DID (n = 12–23/group; 2-way RMs ANOVA time × genotype: F2,28 = 0.7, p > 0.05). (F) Weekly mean BECs achieved during DID (2-way RMs ANOVA time × genotype, F1,2 = 8.44, p > 0.05). (G) Sucrose preference scores (n = 9–11/group; 1-way ANOVA: F2,37 = 4.25 followed by Tukey tests; *p < 0.05). All of the symbols with error bars are means ± SEMs; symbols without error bars represent data from individual animals.
Figure 5.
Figure 5.. More Escalation of Ethanol Drinking and Higher Resistance to Quinine Adulteration in Mice Lacking iMSN D2Rs during Operant Self-Administration Task
(A) Schematic of experimental design for operant ethanol self-administration (SA). Following 3 weeks of DID, mice were trained to self-administer ethanol (FR1,FR3). After training, mice were tested for ethanol adulteration with quinine, ethanol seeking after abstinence, and ethanol relapse (n = 6–13/group). (B) Ethanol intake during the 2-h SA sessions for iMSN-Drd2KO (red), auto-Drd2KO (blue), and littermate control (black) mice. (C) Ethanol intake during early training (open bars/round symbols) and later training (filled bars/square symbols). The connected symbols represent data from individual mice. (D) Rate of sipper licking during training sessions for iMSN-Drd2KO (red), auto-Drd2KO (blue), and littermate control (black) mice (n = 18/group). (E) Percentage of mice from each genotype displaying escalating drinking pattern. (F) Ethanol intake during first 3 training sessions (open bars/round symbols) and the relapse session (filled bars/square symbols). The connected symbols represent data from individual mice (paired t test t(5) = 3.25; *p < 0.05 for iMSN-Drd2KO). (G) Ethanol intake during quinine adulteration sessions (2-way ANOVA genotype × dose: F4,44 = 3.01, p < 0.001; followed by Dunnett’s multiple comparison; ***p < 0.001). (H) Two-bottle choice test for water and water adulterated with quinine. No differences in preference scores (n = 14/group; 2-way ANOVA quinine dose × genotype: F1,51 = 0.83, p > 0.05) for iMSN-Drd2KO (red) and littermate controls (black). All of the symbols with error bars are means ± SEMs; symbols without error bars represent data from individual animals.
Figure 6.
Figure 6.. Ethanol-Induced PKA-Dependent Signaling and D1R Activation Are Enhanced in Striatum of iMSN-Drd2KO Mice, and Blockade of D1R Attenuates Ethanol Stimulation
(A) Schematic describing experimental procedure: iMSN-Drd2KO and littermate control mice were administered saline, SKF-81297, or ethanol. The dorsomedial striatum was dissected for protein level analysis (n = 5–6/group). (B and C) Representative chemiluminescence traces for phosphorylated GluA1 (pGluA1) and control protein GAPDH in littermate (B) and iMSN-Drd2KO (C) mice following saline (black), SKF-81297 (dash), or ethanol (gray). (D and F) Protein level quantification as pGluA1 and GAPDH ratio (D) and total GluA1 over GAPDH ratio (F) after saline (open), SKF-81297 (shaded), and ethanol (solid) for control littermate (black) and iMSN-Drd2KO mice (red). (D) pGLUA1 ratio 1-way ANOVA for control littermate mice: F2,13 = 4.45 and iMSN-Drd2KO mice: F2,14 = 3.89, followed by Tukey multiple comparison tests; *p < 0.05. For total GLUA1 ratio (F), 1-way ANOVA for littermate mice: F2,13 = 0.35 and iMSN-Drd2KO: F2,14 = 0.01, p > 0.05. (E) pGluA1 protein levels after SKF-81297 (shaded) and ethanol (solid) expressed as percentage of saline in littermate (black) and iMSN-Drd2KO (red) mice. *p < 0.05, one-sample t test examining divergence from saline baseline. (G) Locomotor activity measured in beam breaks/min before and after 2 g/kg ethanol in iMSN-Drd2KO (top, red) and littermate control (bottom, black) mice pretreated with either saline (solid) or SCH-23390 (open; n = 12/group). (H) SCH-23390 blocks ethanol-induced locomotion in a dose-dependent manner. Two-way RMs ANOVA drug dose × genotype: F3,66 = 3.72; **p < 0.01; main effect of drug: F3,66 = 27.72 and genotype F1,22 = 15.01, p < 0.001 for both. (I) No or little effect of SCH-23390 on locomotion after saline (2-way RMs ANOVA drug × genotype: F3,66 = 1.29, p > 0.05). All of the symbols with error bars are means ± SEMs; symbols without error bars represent data from individual animals.
Figure 7.
Figure 7.. Selective Knockdown of D1R Gene in Dorsal Striatum Ablates Ethanol-Induced Stimulation
(A) Fluorescent images of coronal brain sections showing the expression site of GFP-Cre in the dorsal (left; n = 12–14/group) and ventral striatum (right; n = 8/group) of Drd1loxP/loxP mice. Scale bar, 1 mm. (B) Levels of Drd1 mRNA normalized to the control gene in samples from dorsal and ventral striatum of Drd1loxP/loxP mice that received intracranial injection in dorsal (left; n = 5–6/group) or ventral striatum (right; n = 3–4/group) of control viral vector (black) or Cre-expressing vector (blue or purple). Independent sample t test t(9) = 4.01; **p < 0.01 for dorsal samples of dorsal injections, t(6) = 3.43 for ventral samples of ventral injections, and t(5) = 3.21 for dorsal samples of ventral injections; *p < 0.05; all of the samples were run in duplicate. (C and D) Dose-dependent ethanol stimulation 5 min after ethanol administration in Drd1loxP/loxP mice with Cre-GFP (blue/purple) or control GFP (black) expression targeted to dorsal (C) or ventral (D) striatum. Two-way RMs ANOVA ethanol dose × viral injection: F4,92 = 2.63, *p < 0.05 for dorsal striatum injections. Main effect of ethanol dose: F4,92 = 7.36, p < 0.0001, and viral injection: F1,23 = 5.07, p < 0.05. Ventral striatum injections 2-way RMs ANOVA ethanol dose × injection: F4,64 = 0.51, p > 0.05. (E and F) Dose-response curve for ethanol sedation, 5–60 min following ethanol administration, in Drd1loxP/loxP mice with Cre-GFP (blue/purple) or control GFP (black) expression targeted to dorsal (E) or ventral striatum (F). Two-way RMs ANOVA ethanol dose × viral injection: F4,88 = 0.39 for dorsal injections and F4,64 = 0.68 for ventral injections, p > 0.05 for both. (G) LORR duration in Drd1loxP/loxP mice that received control GFP or Cre-GFP viral vectors in dorsal striatum. Independent sample t test: t(21) = 1.2, p > 0.05. (H) Ethanol preference score in 2-bottle choice test for Drd1loxP/loxP mice, with Drd1 knockdown targeted to dorsal (blue, left) or ventral striatum (purple, right) and mice that received a control vector (black). Independent sample t test: t(23) = 2.4; *p < 0.05 for dorsal injections and t(17) = 0.7, p > 0.05 for ventral injections; n = 6–14/group. All of the symbols with error bars are means ± SEMs; symbols without error bars represent data from individual animals.

References

    1. Abrahao KP, Goeldner FO, and Souza-Formigoni MLO (2014). Individual differences in ethanol locomotor sensitization are associated with dopamine D1 receptor intra-cellular signaling of DARPP-32 in the nucleus accumbens. PLoS One 9, e98296. - PMC - PubMed
    1. Accili D, Fishburn CS, Drago J, Steiner H, Lachowicz JE, Park BH, Gauda EB, Lee EJ, Cool MH, Sibley DR, et al. (1996). A targeted mutation of the D3 dopamine receptor gene is associated with hyperactivity in mice. Proc. Natl. Acad. Sci. USA 93, 1945–1949. - PMC - PubMed
    1. Baik JH, Picetti R, Saiardi A, Thiriet G, Dierich A, Depaulis A, Le Meur M, and Borrelli E (1995). Parkinsonian-like locomotor impairment in mice lacking dopamine D2 receptors. Nature 377, 424–428. - PubMed
    1. Becker HC, and Ron D (2014). Animal models of excessive alcohol consumption: recent advances and future challenges. Alcohol 48, 205–208. - PMC - PubMed
    1. Bello EP, Mateo Y, Gelman DM, Noaín D, Shin JH, Low MJ, Alvarez VA, Lovinger DM, and Rubinstein M (2011). Cocaine supersensitivity and enhanced motivation for reward in mice lacking dopamine D2 autoreceptors. Nat. Neurosci 14, 1033–1038. - PMC - PubMed

Publication types