. 2019 Oct 29;29(5):1164-1177.e5.
doi: 10.1016/j.celrep.2019.09.066.

Postmortem Cortex Samples Identify Distinct Molecular Subtypes of ALS: Retrotransposon Activation, Oxidative Stress, and Activated Glia

Collaborators, Affiliations

Postmortem Cortex Samples Identify Distinct Molecular Subtypes of ALS: Retrotransposon Activation, Oxidative Stress, and Activated Glia

Oliver H Tam et al. Cell Rep. .

Abstract

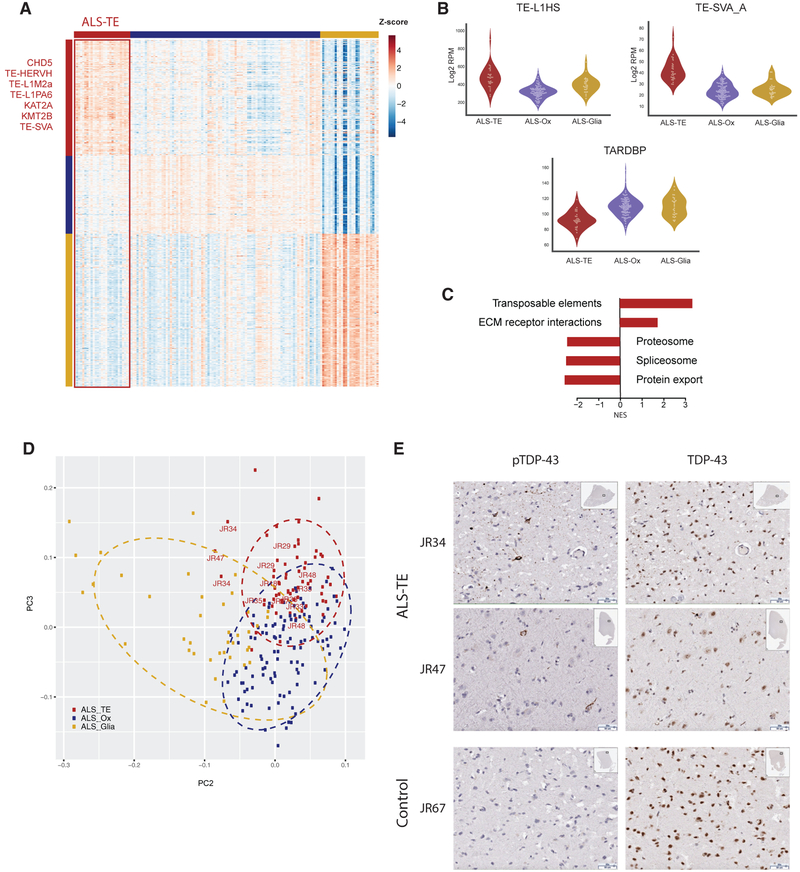
Amyotrophic lateral sclerosis (ALS) is a fatal neurodegenerative disease characterized by the progressive loss of motor neurons. While several pathogenic mutations have been identified, the vast majority of ALS cases have no family history of disease. Thus, for most ALS cases, the disease may be a product of multiple pathways contributing to varying degrees in each patient. Using machine learning algorithms, we stratify the transcriptomes of 148 ALS postmortem cortex samples into three distinct molecular subtypes. The largest cluster, identified in 61% of patient samples, displays hallmarks of oxidative and proteotoxic stress. Another 19% of the samples shows predominant signatures of glial activation. Finally, a third group (20%) exhibits high levels of retrotransposon expression and signatures of TARDBP/TDP-43 dysfunction. We further demonstrate that TDP-43 (1) directly binds a subset of retrotransposon transcripts and contributes to their silencing in vitro, and (2) pathological TDP-43 aggregation correlates with retrotransposon de-silencing in vivo.

Keywords: TDP-43; amyotrophic lateral sclerosis; genetics and genomics of ALS; neurodegeneration; neurodegenerative disease; retrotransposons; transposable elements.


Conflict of interest statement

DECLARATION OF INTERESTS

The authors declare no competing interests.

Figures

Figure 1.
Figure 1.. ALS Patients in the NYGC ALS Consortium Cohort Show 3 Distinct Subtypes: Retrotransposon Reactivated (ALS-TE), Oxidative Stress Signatures (ALS-Ox), and Glial Dysfunction (ALS-Glial)
(A) A schematic depiction of cortical regions from which post-mortem tissue samples were obtained: 148 from ALS patients, 11 from patients with other neurological disorders, and 17 from subjects. Multiple samples were obtained for most patients, such that these samples represent 77 ALS patients, 6 neurological control subjects, and 12 healthy controls. (B) A heatmap of gene expression in ALS patient samples showing the results of NMF-based clustering, which returned 3 robust and distinct groups of patients. The retrotransposon reactivated set showed high TE expression as a dominant signature and formed its own subgroup (ALS-TE), representing 20% of all patient samples. Two additional groups were identified that showed signatures of oxidative stress (ALS-Ox, 61% of samples), and glial dysfunction (ALS-Glial, 19% of samples). Representative gene sets that describe markers from each subset are identified along the left of the heatmap. (C) Gene Set Enrichment Analysis was performed for each group of patients (ALS-TE, ALS-Ox, and ALS-Glial) versus controls to identify group-specific aberrant pathways. (D) Violin plots of example markers for each group show the LINE retrotransposon L1PA6 marking the ALS-TE group, SOD1 marking the ALS-Ox group, and TREM2 marking the ALS-Glial samples.
Figure 2.
Figure 2.. ALS-Ox Patients in the NYGC ALS Consortium Show Markers of Oxidative Stress
(A) The ALS-Ox group represents the middle 61% of patient samples in the ALS Consortium set (outlined in blue), with ALS-Ox marker genes listed along the left-hand side of the heatmap. (B) Violin plots of example markers for this group show two known ALS-associated genes, MATR3 and NEFL, specifically elevated in the ALS-Ox group (blue violins). (C) Top enriched pathways identified by GSEA in the ALS-Ox group samples compared to controls. (D) Additional ALS patient samples from UCSD are assigned to the NYGC ALS subgroups by position on this PCA plot (UCSD samples marked by patient ID in blue). (E) To confirm the link between ALS-Ox membership and stress pathways, individual PCA plots are shown where each sample is colored by the normalized expression of genes in the Oxidative Stress pathway (OXR1, TXN), ER-linked proteotoxic stress pathways (UBQLN2, BECN1 and downstream genes related to autophagy (ATG5, TBK1).
Figure 3.
Figure 3.. ALS-Glia Patients in the NYGC ALS Consortium Cohort Show Evidence of Disease-Associated Microglia
(A) The ALS-Glia group represents the 19% of patient samples on the right side of the ALS Consortium set (outlined in gold), with additional ALS-Glia marker genes listed along the left side of the heatmap. (B) Violin plots of example markers for this group show two known glial marker genes, AIF1/IBA1 and CD44, specifically elevated in the ALS-Glia group (gold violins). (C) Top enriched pathways identified by GSEA in the ALS-Glia group samples compared to controls. (D) Additional ALS patient samples from UCSD are assigned to the NYGC ALS subgroups by position on this PCA plot (UCSD samples marked by patient ID in gold). (E) To confirm the link between ALS-Glia membership and markers of particular glial subsets, individual PCA plots are shown where each sample is colored by the normalized expression of genes that mark Microglia (IBA1, TREM2), Oligodendrocytes (OLIG1, MOG), and astrocytes (GFAP, CD44). (F) To confirm the link between ALS-Glia membership and activated microglia, UCSD patient samples were stained with antibodies to IBA1. ALS-Glia samples show presence of enlarged, activated microglia not seen in controls or other ALS subgroups. Images are shown at 20 × magnification, with labeled scale bars indicating a size of 50–70μm.
Figure 4.
Figure 4.. ALS-TE Patients in the NYGC ALS Consortium Cohort Show Retrotransposon Re-activation
(A) The ALS-TE group represents the left hand 20% of patients in the ALS Consortium sample set (outlined in Red), with ALS-TE markers listed along the left-hand panel. (B) Violin plots of example markers for this group show two relatively young retrotransposons, L1HS and SVA_A, and TARDBP expression. (C) Top enriched pathways identified by GSEA in the ALS-TE versus controls. (D) Additional ALS samples from UCSD are assigned to the defined subgroups by position on this PCA plot (UCSD samples marked by patient ID in red). (E) To confirm the link between ALS-TE membership and TDP-43 pathology, UCSD patient samples were stained with antibodies to the phosphorylated form of TDP-43 (pTDP-43, left) as well as with antibodies that recognize full-length TDP-43 protein (right). ALS-TE samples show evidence of pTDP-43 pathology not present in controls or other ALS subgroups. Images are shown at 20 × magnification, with labeled scale bars indicating a size of 50μm.
Figure 5.
Figure 5.. TDP-43 Binds and Regulates Retrotransposon Transcripts
(A) A schematic of the eCLIP-seq based identification (2 biological replicates) of directly bound RNA targets for TDP-43, with a representative pileup of reads where TDP-43 is known to target its own 3′ UTR. (B) A pie chart of annotation categories for TDP-43 targets shows that retrotransposons are a small but important fraction of direct targets (12.9%). Gene intronic sequences represent the largest fraction of all peaks at 44%, while an additional 17.6% represent regions where TEs provide regulatory sequences to the host gene intron. (C) The known TDP-43 binding motif (UGUGU) is present in both gene and retrotransposon targets. (D) Representative browser pileup plots for one retrotransposon from each major repeat class: an L1PA6 LINE element, an AluY SINE element, a HERV3 LTR element, and an SVA_D from the human specific SVA class. (E) Knock down of TDP-43 levels (2 biological replicates) results in the upregulation of retrotransposon transcripts, most of which also show evidence for direct binding in the eCLIP-seq experiments (gray bars). (F) A volcano plot of fold change versus false discovery rate (FDR) q values shows that upregulated TEs (red dots) form a substantial fraction of all TDP-43 dependent genes, and all are upregulated. (G) Knock down efficiency of short hairpin RNAs (shRNAs) targeting TARDBP was validated by western blot analysis and qPCR. For RNA levels, replicates were averaged and SD shown as error bars. For protein levels, western blots of the two biological replicates are shown separately.

References

    1. Antony JM, van Marle G, Opii W, Butterfield DA, Mallet F, Yong VW, Wallace JL, Deacon RM, Warren K, and Power C (2004). Human endogenous retrovirus glycoprotein-mediated induction of redox reactants causes oligodendrocyte death and demyelination. Nat. Neurosci 7, 1088–1095. - PubMed
    1. Arai T, Hasegawa M, Akiyama H, Ikeda K, Nonaka T, Mori H, Mann D, Tsuchiya K, Yoshida M, Hashizume Y, and Oda T (2006). TDP-43 is a component of ubiquitin-positive tau-negative inclusions in frontotemporal lobar degeneration and amyotrophic lateral sclerosis. Biochem. Biophys. Res. Commun 351, 602–611. - PubMed
    1. Attig J, Agostini F, Gooding C, Chakrabarti AM, Singh A, Haberman N, Zagalak JA, Emmett W, Smith CWJ, Luscombe NM, and Ule J (2018). Heteromeric RNP Assembly at LINEs Controls Lineage-Specific RNA Processing. Cell 174, 1067–1081. - PMC - PubMed
    1. Ayala YM, De Conti L, Avendaño-Vázquez SE, Dhir A, Romano M, D’Ambrogio A, Tollervey J, Ule J, Baralle M, Buratti E, and Baralle FE (2011). TDP-43 regulates its mRNA levels through a negative feedback loop. EMBO J. 30, 277–288. - PMC - PubMed
    1. Bankhead P, Loughrey MB, Fernández JA, Dombrowski Y, McArt DG, Dunne PD, McQuaid S, Gray RT, Murray LJ, Coleman HG, et al. (2017). QuPath: Open source software for digital pathology image analysis. Sci. Rep 7, 16878. - PMC - PubMed

Publication types

MeSH terms