. 2019 Oct 29;29(5):1351-1368.e5.
doi: 10.1016/j.celrep.2019.09.060.

Systematic Discovery of Endogenous Human Ribonucleoprotein Complexes

Affiliations

Systematic Discovery of Endogenous Human Ribonucleoprotein Complexes

Anna L Mallam et al. Cell Rep. .

Abstract

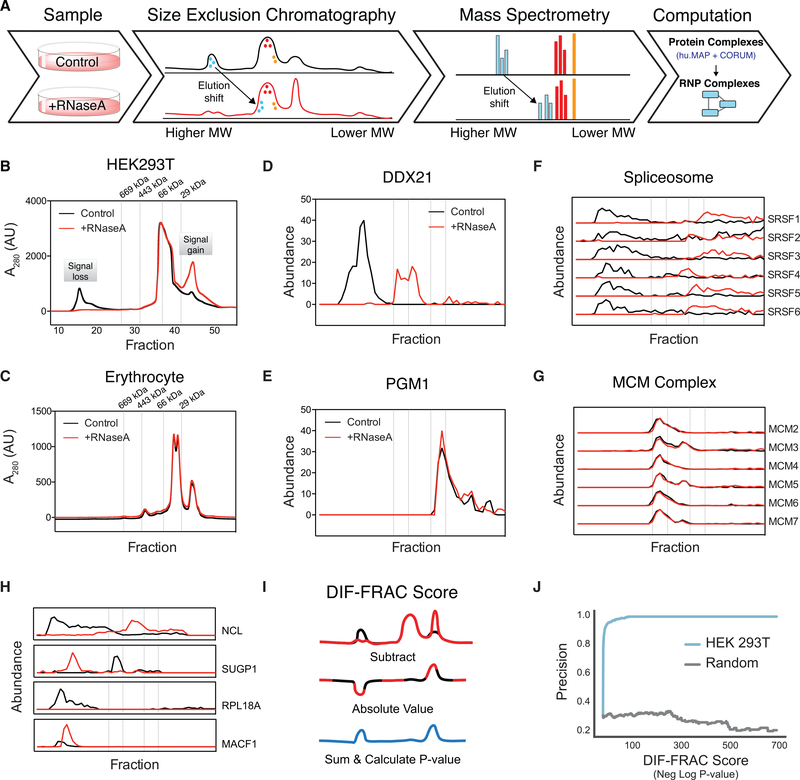
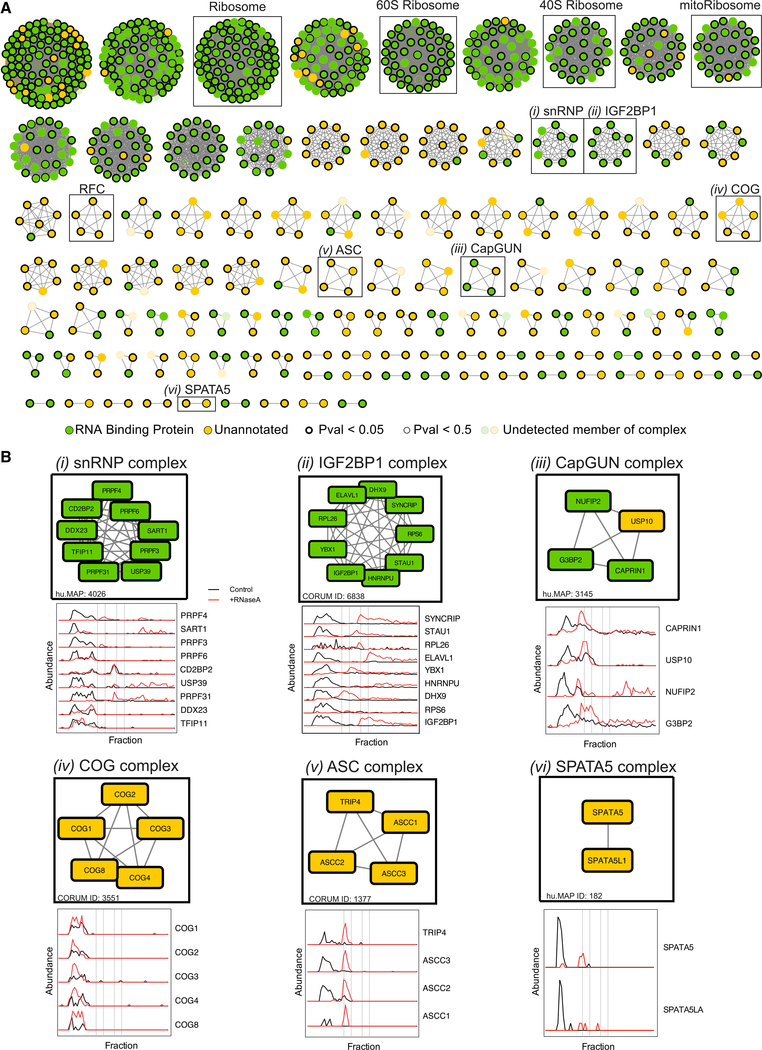
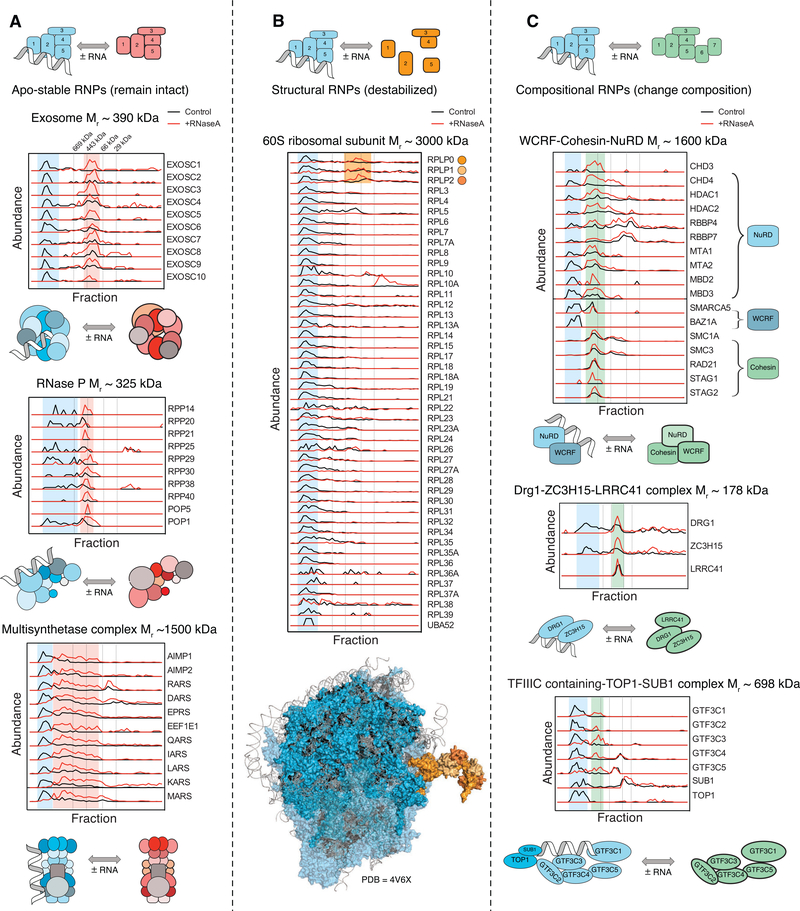
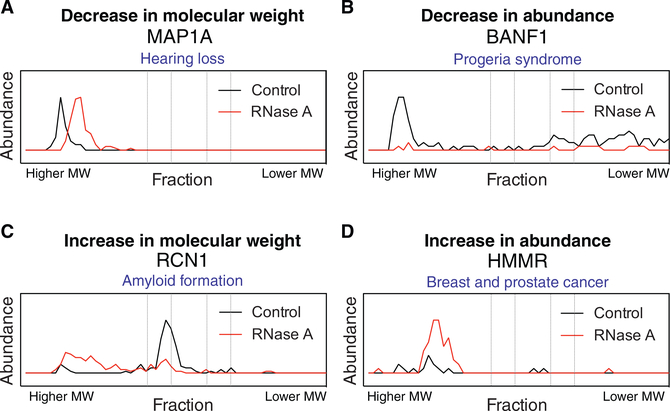
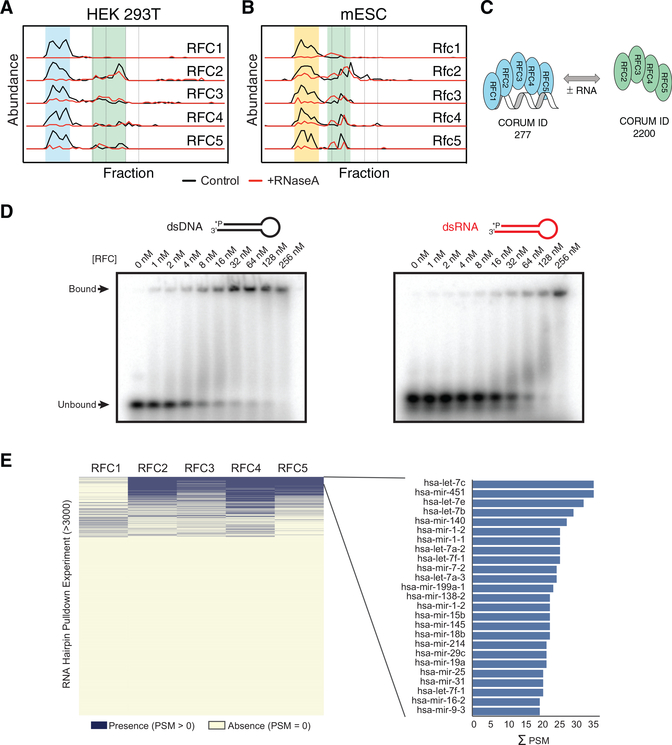
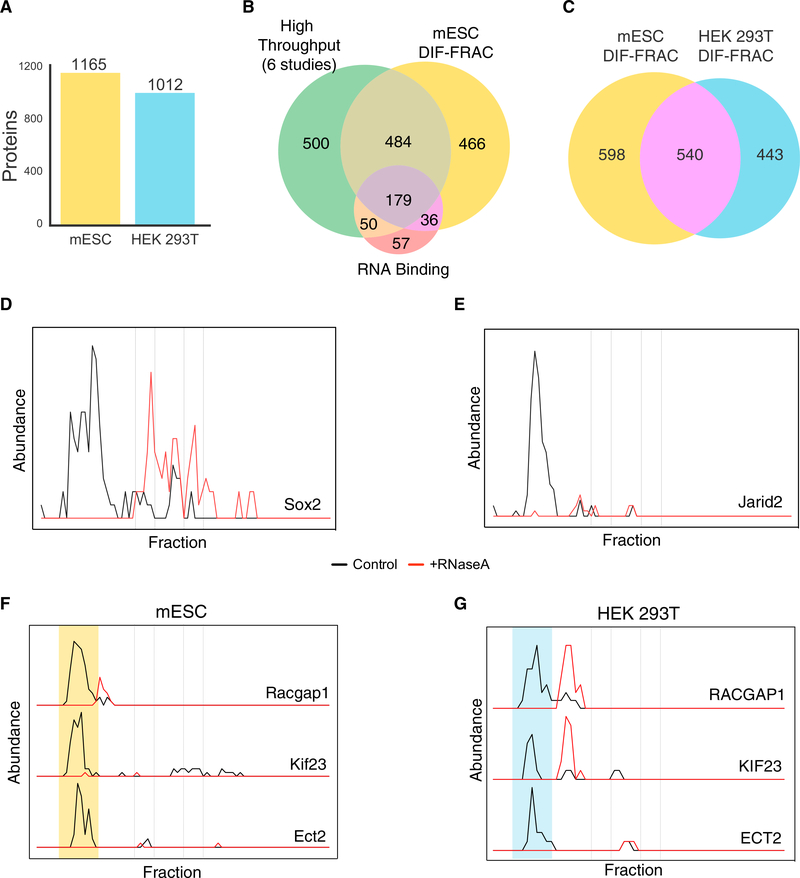
RNA-binding proteins (RBPs) play essential roles in biology and are frequently associated with human disease. Although recent studies have systematically identified individual RNA-binding proteins, their higher-order assembly into ribonucleoprotein (RNP) complexes has not been systematically investigated. Here, we describe a proteomics method for systematic identification of RNP complexes in human cells. We identify 1,428 protein complexes that associate with RNA, indicating that more than 20% of known human protein complexes contain RNA. To explore the role of RNA in the assembly of each complex, we identify complexes that dissociate, change composition, or form stable protein-only complexes in the absence of RNA. We use our method to systematically identify cell-type-specific RNA-associated proteins in mouse embryonic stem cells and finally, distribute our resource, rna.MAP, in an easy-to-use online interface (rna.proteincomplexes.org). Our system thus provides a methodology for explorations across human tissues, disease states, and throughout all domains of life.

Keywords: DIF-FRAC; RBP; RNA-binding protein; RNP; biochemical fractionation; interactome; mass spectrometry; protein complexes; proteomics; ribonucleoprotein complex.


Conflict of interest statement

DECLARATION OF INTERESTS

The authors declare no competing interests.

Figures

Figure 1.
Figure 1.. Differential Fractionation (DIF-FRAC) Identifies RNP Complexes
(A) The DIF-FRAC workflow requires two equivalent cell culture lysates for a control and an RNase A-treated sample. Lysate is separated into fractions using size-exclusion chromatography (SEC), and proteins in each fraction are identified using mass spectrometry to determine individual protein elution profiles proteome-wide for each condition. An elution shift of a protein upon RNase A treatment is indicative of an RNA-protein association. Elution shifts are cross-referenced with known protein complexes to identify RNP complexes. (B) Separations of HEK293T lysate under control (black) and RNase A-treated (red) conditions monitored by bulk SEC absorbance profiles at A280 show loss of high-molecular weight signal upon treatment. (C) Negative control separations of erythrocyte lysate under control (black) and RNase A-treated (red) conditions monitored by bulk SEC absorbance profiles at A280 show no change in absorbance signal. (D) RNA-binding protein elution profile for positive control nucleolar RNA helicase 2 (DDX21) (abundance = count of unique PSMs). The elution profile shows sensitivity to RNase A treatment. (E) Elution profile for negative control phosphoglucomutase (PGM1) is not sensitive to RNase A treatment. (F) Elution profiles for subunits of the spliceosome RNP complex (i.e., positive control) show co-elution of complex in control and a shift in elution upon RNase A treatment. (G) Elution profile for the non-RNA-associated MCM complex (i.e., negative control) shows no detectable elution shift. (H) Example traces of four known RNA-binding proteins exhibiting different behaviors of elution profile changes upon RNase A treatment. NCL shows a loss in molecular weight, while SUGP1 shows an increase in molecular weight. RPL18A shows a decrease in observed abundance, while MACF1 shows an increase in observed abundance. In (B)–(H), dashed lines correspond to the elution volumes of molecular weight standards thyroglobulin (Mr = 669 kDa), apoferritin (Mr = 443 kDa), albumin (Mr = 66 kDa), and carbonic anhydrase (Mr = 29 kDa). Molecular weight labels on subsequent plots are removed for clarity. (I) A DIF-FRAC score is calculated for each protein from the absolute value of the difference of the elution profiles between control and RNase A-treated samples, and then summed. A p value is then calculated from a Z score compared to a background distribution of DIF-FRAC scores preserving the rankings among proteins. See also Figure S2A. (J) DIF-FRAC p value calculated on HEK293T data shows strong ability to discriminate known RNA-binding proteins from other proteins. See also Figure S2B.
Figure 2.
Figure 2.. DIF-FRAC Reveals a Map of Stable RNP Complexes
(A) One hundred fifteen RNP complexes identified by the DIF-FRAC method termed “RNP Select.” Green nodes represent RNA-binding proteins annotated as “RNP complex” in UniProt, and yellow nodes are unannotated proteins. Nodes with thick black border and thin black border represent p values < 0.05 and < 0.5, respectively. Transparent nodes represent undetected members of the complex in our proteomic experiments. RNP Select complexes are defined as complexes whose protein subunits co-elute in the control DIF-FRAC sample (>0.75 average correlation coefficient), and >50% of subunits have DIF-FRAC p values > 0.5. DIF-FRAC identified many known RNP complexes, such as the ribosome, mitochondrial ribosome, and snRNP, as well as novel RNP complexes such as RFC, COG, ASC, and SPATA5. (B) Individual RNP complexes with elution profiles, including (i) snRNP, (ii) IGF2BP1, (iii) CapGUN, (iv) COG, (v) ASC, and (vi) SPATA5. Abundance represents count of unique PSMs for each protein. See also Figure S4.
Figure 3.
Figure 3.. DIF-FRAC Identifies Three Classes of RNP Complexes
(A) “Apo-stable” RNP complexes: elution profiles of the exosome (top, CORUM: 7443), RNase P (middle, CORUM: 123), and the multi-synthetase complex (bottom, CORUM: 3040) show that each complex is a stable complex that binds RNA, and the complex remains intact in the absence of RNA. Blue shading represents RNA-bound form, and red shading represents RNA-unbound complex. See also Figure S5. (B) “Structural” RNP complexes: elution profiles of the 60S ribosomal subunit (CORUM: 308) show that the complex destabilizes upon RNA degradation, and subunits no longer co-elute upon RNase A treatment. DIF-FRAC elution data show the ribosomal subunits RPLP0, RPLP1, and RPLP2 (orange) remain as a subcomplex upon RNA degradation, consistent with their position in the solved ribosome structure whose interactions are not mediated by RNA(bottom, PDB: 4V6X, protein in blue, RNA in gray, ribosomal stalk in orange). (C) “Compositional” RNP complexes. Top: elution profiles of WCRF-Cohesin-NuRD (CORUM: 282) and NuRD-WCRF suggest that RNA association promotes different forms of the complex. Middle: elution profiles of Drg1-ZC3H15-LRRC41 complex (hu.MAP: 2767), which forms only in the absence of RNA. Bottom: elution profiles of the TFIIIC-containing TOP1-SUB1 complex (CORUM: 1106) loses two subunits, TOP1 and SUB1, upon RNA degradation. Green shading represents RNA-unbound complex. Vertical dashed lines correspond molecular weight standards described in Figure 1. See also Figure S5.
Figure 4.
Figure 4.. DIF-FRAC Identifies Four Distinct Signals for RNA-Associated Proteins
(A–D) Examples of elution profiles for disease related proteins that (A) decrease in size, MAP1A; (B) decrease in observed abundance (less soluble), BANF1; (C) increase in size, RCN1; and (D) increase in observed abundance (more soluble), HMMR, upon RNA degradation. See also Table S3 and Figure S6.
Figure 5.
Figure 5.. RFC Is an RNP Complex
(A and B) Elution profiles in both human (A) and mouse (B) demonstrate that RFC1–5 forms an RNP complex (blue/yellow highlight). A smaller subcomplex of RFC2–5 (green highlight) becomes the dominant form upon RNA degradation. (C) A cartoon to show the RNA dependence of annotated complexes RFC1–5 (blue) and RFC2–5 (green) as determined by DIF-FRAC. RNA is shown in gray. (D) Electromorphic mobility shift assays (EMSA) of various concentrations of purified S. cerevisiae RFC mixed with 1 nM 32P-labeled oligonucleotides. Representative gels show that RFC binds dsDNA and dsRNA substrates. RFC-nucleic acid complexes were separated on 10% native gels. Binding constants are in the nanomolar range (see also Figure S7). (E) RFC component identification in RNA hairpin pull-down experiments (right panel) and the top 25 hairpin pull-downs on the basis of the sum of PSMs (left panel).
Figure 6.
Figure 6.. DIF-FRAC Identifies RNP Complexes across Cell Types and Species
(A) DIF-FRAC identifies 1,165 RNA-associated proteins in mESCs (mouse embryonic stem cells) and 1,012 RNA-associated proteins in HEK293T cells. (B) Venn diagram of considerable overlap between previously published large-scale RNA-protein interaction studies, literature-annotated RNA-binding proteins, and DIF-FRAC-identified RNA-associated proteins in mESCs. (C) RNA-associated human-mouse orthologs are identified reproducibly in DIF-FRAC experiments. (D and E) Elution profiles for known pluripotency factors Sox2 (D) and Jarid2 (E) show association with RNA in mESCs. (F and G) Elution profiles of the centralspindlin complex for (F) mESCs and (G) HEK293T cells demonstrate that centralspindlin is an RNP complex in both species. Yellow and blue shading represents RNA-bound complex in mESCs and HEK293T cells, respectively.

References

    1. Agafonov DE, Kastner B, Dybkov O, Hofele RV, Liu W-T, Urlaub H, Lührmann R, and Stark H (2016). Molecular architecture of the human U4/U6.U5 tri-snRNP. Science 351, 1416–1420. - PubMed
    1. Anger AM, Armache J-P, Berninghausen O, Habeck M, Subklewe M, Wilson DN, and Beckmann R (2013). Structures of the human and Drosophila 80S ribosome. Nature 497, 80–85. - PubMed
    1. Apweiler R, Bairoch A, Wu CH, Barker WC, Boeckmann B, Ferro S, Gasteiger E, Huang H, Lopez R, Magrane M, et al. (2004). UniProt: the Universal Protein knowledgebase. Nucleic Acids Res. 32, D115–D119. - PMC - PubMed
    1. Ashburner M, Ball CA, Blake JA, Botstein D, Butler H, Cherry JM, Davis AP, Dolinski K, Dwight SS, Eppig JT, et al. ; The Gene Ontology Consortium (2000). Gene Ontology: tool for the unification of biology. Nat. Genet 25, 25–29. - PMC - PubMed
    1. Baltz AG, Munschauer M, Schwanhäusser B, Vasile A, Murakawa Y, Schueler M, Youngs N, Penfold-Brown D, Drew K, Milek M, et al. (2012). The mRNA-bound proteome and its global occupancy profile on protein-coding transcripts. Mol. Cell 46, 674–690. - PubMed

Publication types