. 2019 Nov 4;47(19):10072-10085.
doi: 10.1093/nar/gkz762.

Human mitochondrial DNA is extensively methylated in a non-CpG context

Affiliations

Human mitochondrial DNA is extensively methylated in a non-CpG context

Vibha Patil et al. Nucleic Acids Res. .

Abstract

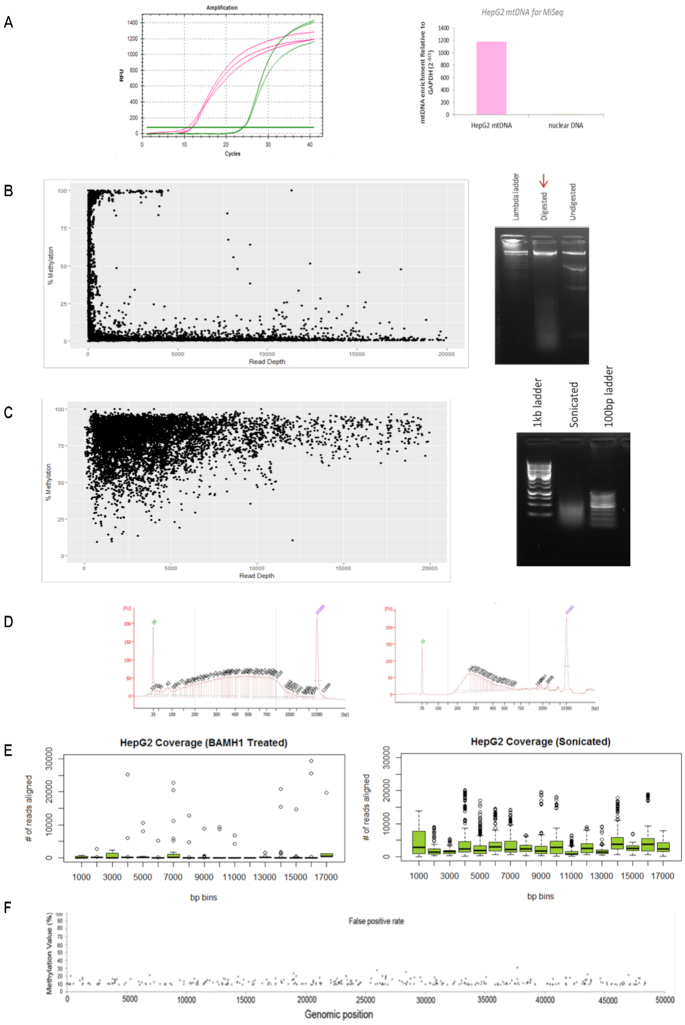
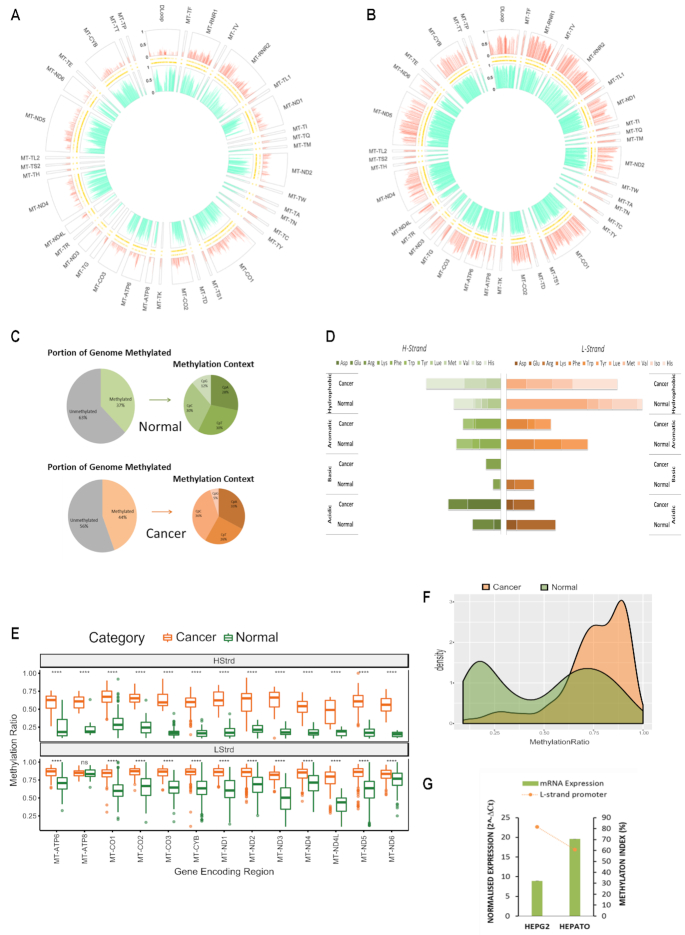
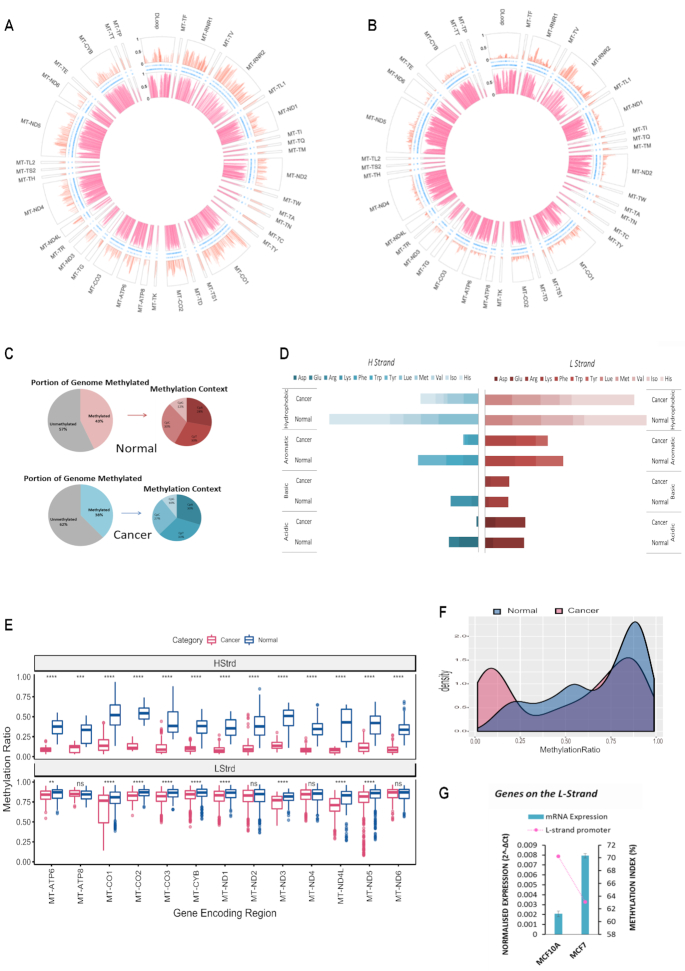
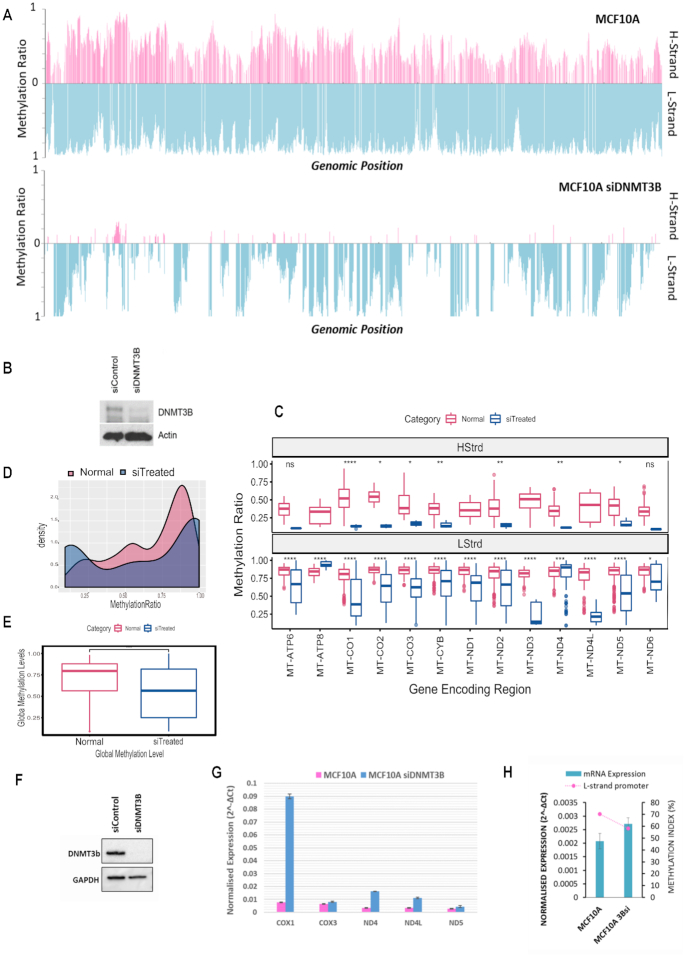
Mitochondrial dysfunction plays critical roles in cancer development and related therapeutic response; however, exact molecular mechanisms remain unclear. Recently, alongside the discovery of mitochondrial-specific DNA methyltransferases, global and site-specific methylation of the mitochondrial genome has been described. Investigation of any functional consequences however remains unclear and debated due to insufficient evidence of the quantitative degree and frequency of mitochondrial DNA (mtDNA) methylation. This study uses WGBS to provide the first quantitative report of mtDNA methylation at single base pair resolution. The data show that mitochondrial genomes are extensively methylated predominantly at non-CpG sites. Importantly, these methylation patterns display notable differences between normal and cancer cells. Furthermore, knockdown of DNA methyltransferase enzymes resulted in a marked global reduction of mtDNA methylation levels, indicating these enzymes may be associated with the establishment and/or maintenance of mtDNA methylation. DNMT3B knockdown cells displayed a comparatively pronounced global reduction in mtDNA methylation with concomitant increases in gene expression, suggesting a potential functional link between methylation and gene expression. Together these results demonstrate reproducible, non-random methylation patterns of mtDNA and challenge the notion that mtDNA is lowly methylated. This study discusses key differences in methodology that suggest future investigations must allow for techniques that assess both CpG and non-CpG methylation.


Figures

Figure 1.
Figure 1.
Mitochondrial DNA sequencing requires method adjustments. (A) Raw amplification cycles of mtDNA enrichment assessed with qPCR of a mitochondrial specific genomic region compared to nuclear specific GAPDH genomic region (left panel). Relative fold enrichment of mtDNA to nuclear DNA (2−ΔCt) for HepG2 mtDNA extractions is indicated (right panel). The lack of nuclear DNA enrichment confirms the quality of mtDNA extraction. (B) Cytosine methylation compared to sequencing read depth (left panel) of HepG2 mtDNA which was digested with 2U of BamHI overnight at 37°C and visualised on agarose gel (right panel). (C) Cytosine methylation compared to sequencing read depth (left panel) of HepG2 mtDNA that was fragmented via sonication (100–7000 bp) and visualized on agarose gel (right panel). (D) HepG2 sonicated mtDNA (left panel) and bisulfite modified mtDNA (right panel) was assessed on the BioAnalyser to ensure sonication was efficient and that modified mtDNA produced the standard expected curve. (E) Average number of reads aligning to the mitochondrial genome per 1000 bp. HepG2 sample that was sonicated prior to sequencing showed an improvement in coverage compared to the BamHI-treated HepG2 sample. (F) A 100% unmethylated plasmid DNA control was processed and sequenced alongside mtDNA samples to ensure an appropriate false positive threshold can be used for data analysis. The X-axis represents the genomic position of the plasmid genome (48 kb). The Y-axis represents the methylation value detected at each cytosine. The dots represent the 1.56% false detection rate.
Figure 2.
Figure 2.
Baseline patterns of the mitochondrial methylome in normal and cancer liver cells. (A andB) MtDNA isolated from hepatocytes and liver cancer cells (HepG2) that was sequenced using the NSG MiSeq platform as described in Figure 1. The circular plot represents genomic position (1–16 kb) of all methylated cytosines with respect to sequence order. Each segment of the circle represents a separate functionally relevant region, tRNA, rRNA, gene or D-Loop. The Y-axis indicating that methylation level is represented on the left-hand side of the D-Loop segment. The large outer ring displays methylation at each cytosine within the H-Strand, whereas the large inner ring displays methylation at each cytosine on the L-Strand. Thin inner bands indicate the genomic position of all cytosines within the H-Strand and L-Strand sequence. Global mtDNA methylation patterns differ between hepatocytes and cancer cells and are also strand specific. (C) Summary statistics of the frequency of mitochondrial mCpN context in liver cells. (D) Methylation Index across tRNA encoding regions in liver cancer versus normal cells. Each horizontal segment compares the MI within tRNAs that have been grouped according to the amino acid they carry (acidic, basic, aromatic or hydrophobic). The left panel indicates MI across H-Strand and right panel indicates MI across L-Strand. (E) Comparative boxplots indicating significant (P < 0.001) difference of mean methylation across gene encoding regions of normal versus cancer cells in each strand. (F) Density plot of the distribution of methylation values along the D-Loop region. (G) Relative ND6 mRNA expression normalized to mtDNA amount compared with methylation index across the LSP. High LSP methylation associates with low ND6 expression.
Figure 3.
Figure 3.
Baseline patterns of the mitochondrial methylome in normal and cancer breast cells. MtDNA was sequenced using the NSG MiSeq platform. The circular plot represents genomic position (1–16 kb) of all methylated cytosines with respect to sequence order. Each segment of the circle represents a separate functionally relevant region, tRNA, rRNA, gene or DLoop. The Y-axis indicating methylation level is represented on the left-hand side of the D-Loop segment. The large outer ring displays methylation at each cytosine within the H-Strand whereas the large inner ring displays methylation at each cytosine on the L-Strand. Thin inner bands indicate the genomic position of all cytosines within the H-Strand, L-Strand sequence. Global mtDNA methylation patterns differ between these cell types and are also strand specific. (A) Normal breast epithelial cells (MCF10A); (B) Cancer epithelial cells (MCF7); (C) Summary statistics of the frequency of mitochondrial mCpN context in liver cells and (D) Methylation Index across tRNA encoding regions in breast cancer versus normal. Each horizontal segment compares the MI within tRNAs that have been grouped according to the amino acid they carry (acidic, basic, aromatic or hydrophobic). The left panel indicates MI across H-Strand and right panel indicates MI across L-Strand. (E) Comparative boxplot indicating significant (P < 0.001) difference of mean methylation across gene encoding regions of normal versus cancer cells in each strand. (F) Density plot of the distribution of methylation values along the D-Loop region. (G) Relative ND6 mRNA expression normalized to mtDNA amount compared with methylation index across the LSP. High LSP methylation associates with low ND6 expression
Figure 4.
Figure 4.
Silencing DNMT3B modulates mitochondrial DNA methylation concomitant to expression changes of mitochondrial transcripts. (A) MtDNA methylation in MCF10A cells exposed to a 96-h treatment of DNMT3B siRNA compared to control. A global drop in methylation ratio is observed for H and L strand methylation in DNMT3Bsi treated cells. (B) Whole cell protein was assayed for relative amounts of DNMT3B via western blot to confirm assay efficiency. (C) Comparative boxplot indicating significant (P < 0.001) difference of mean methylation across gene encoding regions of control versus knockdown treated cells in each strand. (D) Paired Wilcox t-test showing significance of the global drop in methylation between control and treated cells (P < 0.001). (E) Density plot of the distribution of methylation values along the D-Loop region. (F) Whole cell protein of repeat experiment assayed for relative amounts of DNMT3B via western blot to confirm efficiency. (G) Relative mRNA expression normalized to mtDNA amount compared of genes encoded on the H-strand. Treated cells show an increase in gene expression compared to control. (H) Relative ND6 mRNA expression normalized to mtDNA amount compared with methylation index across the LSP. High LSP methylation associates with low ND6 expression.

References

    1. Porporato P.E., Filigheddu N., Pedro J.M.B., Kroemer G., Galluzzi L.. Mitochondrial metabolism and cancer. Cell Res. 2018; 28:265–280. - PMC - PubMed
    1. Chinnery P.F., Hudson G.. Mitochondrial genetics. Br. Med. Bull. 2013; 106:135–159. - PMC - PubMed
    1. Tapper D.P., Clayton D.A.. Mechanism of replication of human mitochondrial DNA. Localization of the 5′ ends of nascent daughter strands. J. Biol. Chem. 1981; 256:5109–5115. - PubMed
    1. Crews S., Ojala D., Posakony J., Nishiguchi J., Attardi G.. Nucleotide sequence of a region of human mitochondrial DNA containing the precisely identified origin of replication. Nature. 1979; 277:192–198. - PubMed
    1. Fish J., Raule N., Attardi G.. Discovery of a major D-loop replication origin reveals two modes of human mtDNA synthesis. Science. 2004; 306:2098–2101. - PubMed

Publication types

Substances