

The Typhoid Fever Surveillance in Africa Program: Geospatial Sampling Frames for Household-based Studies: Lessons Learned From a Multicountry Surveillance Network in Senegal, South Africa, and Sudan
- PMID: 31665783
- PMCID: PMC6821174
- DOI: 10.1093/cid/ciz755
The Typhoid Fever Surveillance in Africa Program: Geospatial Sampling Frames for Household-based Studies: Lessons Learned From a Multicountry Surveillance Network in Senegal, South Africa, and Sudan
Abstract
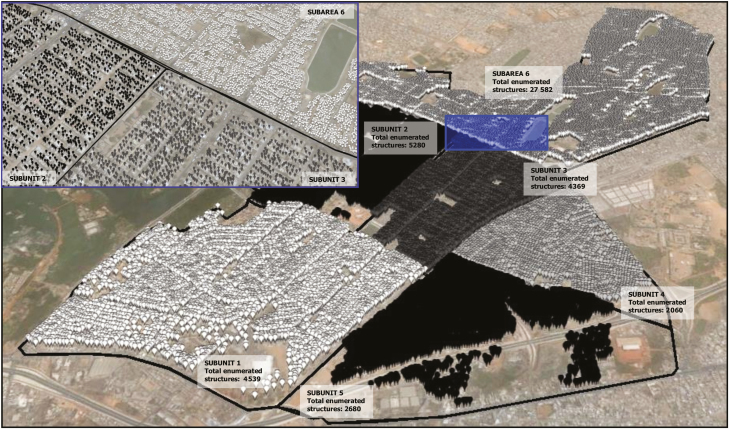
Background: Robust household sampling, commonly applied for population-based investigations, requires sampling frames or household lists to minimize selection bias. We have applied Google Earth Pro satellite imagery to constitute structure-based sampling frames at sites in Pikine, Senegal; Pietermaritzburg, South Africa; and Wad-Medani, Sudan. Here we present our experiences in using this approach and findings from assessing its applicability by determining positional accuracy.
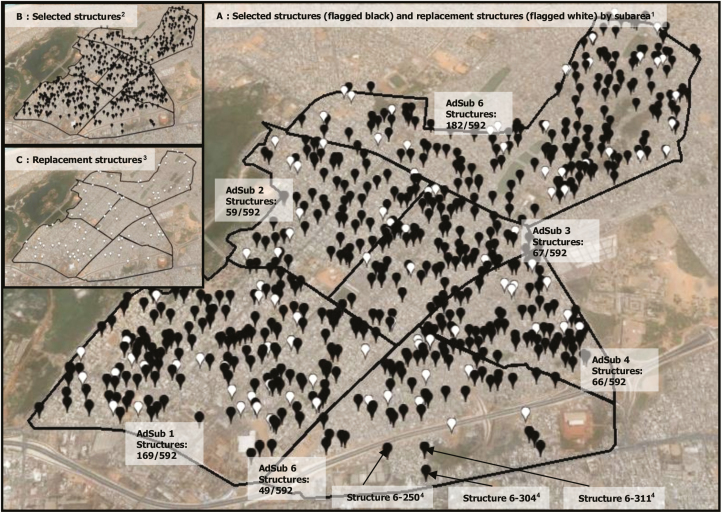
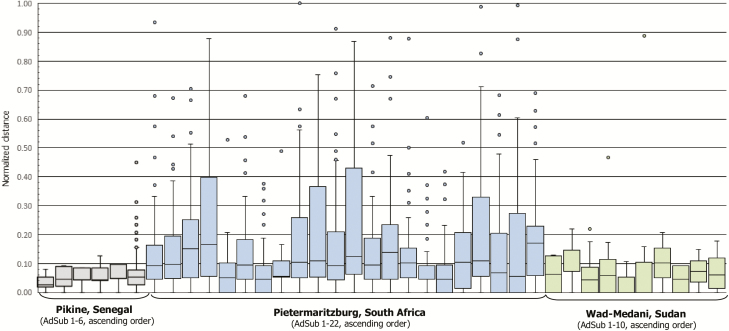
Methods: Printouts of satellite imagery combined with Global Positioning System receivers were used to locate and to verify the locations of sample structures (simple random selection; weighted-stratified sampling). Positional accuracy was assessed by study site and administrative subareas by calculating normalized distances (meters) between coordinates taken from the sampling frame and on the ground using receivers. A higher accuracy in conjunction with smaller distances was assumed. Kruskal-Wallis and Dunn multiple pairwise comparisons were performed to evaluate positional accuracy by setting and by individual surveyor in Pietermaritzburg.
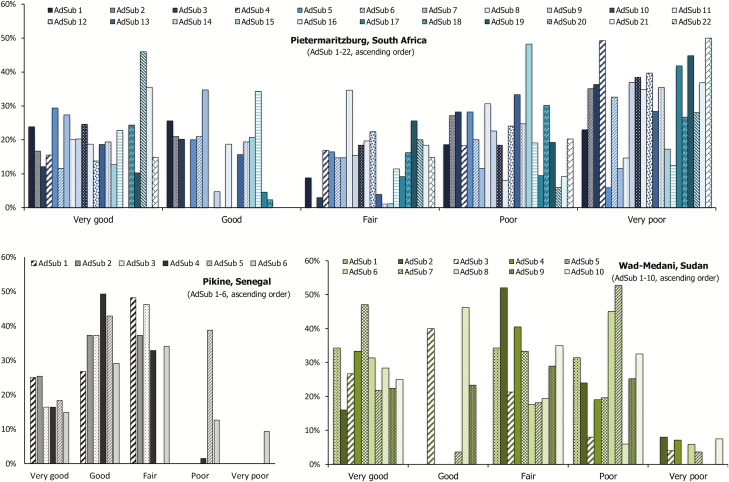
Results: The median normalized distances and interquartile ranges were 0.05 and 0.03-0.08 in Pikine, 0.09 and 0.05-0.19 in Pietermaritzburg, and 0.05 and 0.00-0.10 in Wad-Medani, respectively. Root mean square errors were 0.08 in Pikine, 0.42 in Pietermaritzburg, and 0.17 in Wad-Medani. Kruskal-Wallis and Dunn comparisons indicated significant differences by low- and high-density setting and interviewers who performed the presented approach with high accuracy compared to interviewers with poor accuracy.
Conclusions: The geospatial approach presented minimizes systematic errors and increases robustness and representativeness of a sample. However, the findings imply that this approach may not be applicable at all sites and settings; its success also depends on skills of surveyors working with aerial data. Methodological modifications are required, especially for resource-challenged sites that may be affected by constraints in data availability and area size.
Keywords: geospatial sampling frame; positional accuracy; satellite imagery; sub-Saharan Africa.
© The Author(s) 2019. Published by Oxford University Press for the Infectious Diseases Society of America.
Figures
References
-
- United Nations. Designing household survey samples: practical guidelines 2008. Available at: https://unstats.un.org/unsd/demographic/sources/surveys/Series_F98en.pdf. Accessed 25 December 2018.
-
- Adazu K, Lindblade KA, Rosen DH, et al. . Health and demographic surveillance in rural western Kenya: a platform for evaluating interventions to reduce morbidity and mortality from infectious diseases. Am J Trop Med Hyg 2005; 73:1151–8. - PubMed
