. 2020 Feb;225(3):1355-1369.
doi: 10.1111/nph.16290. Epub 2019 Dec 6.

Large-scale genomic sequence data resolve the deepest divergences in the legume phylogeny and support a near-simultaneous evolutionary origin of all six subfamilies

Affiliations

Large-scale genomic sequence data resolve the deepest divergences in the legume phylogeny and support a near-simultaneous evolutionary origin of all six subfamilies

Erik J M Koenen et al. New Phytol. 2020 Feb.

Abstract

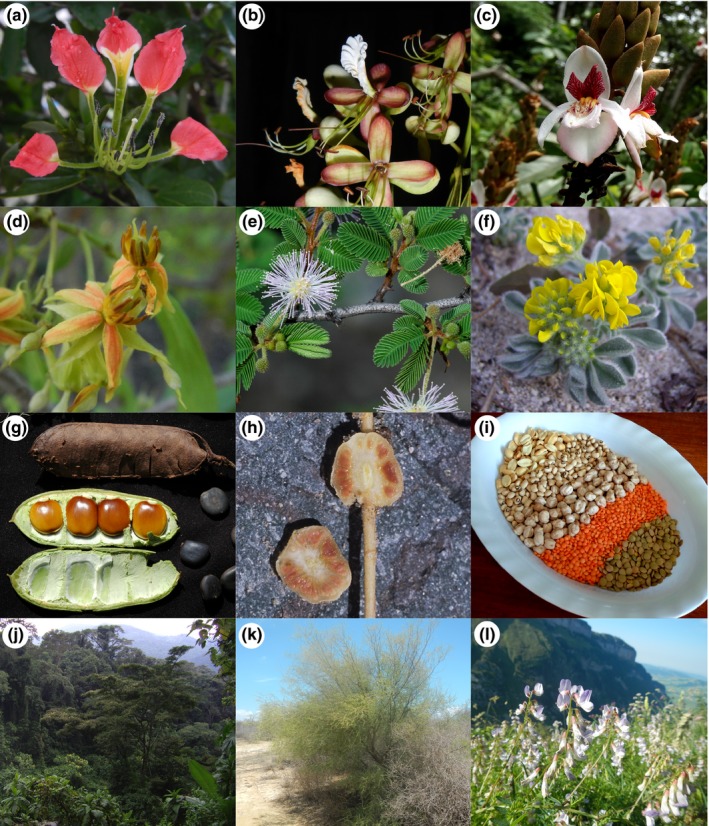
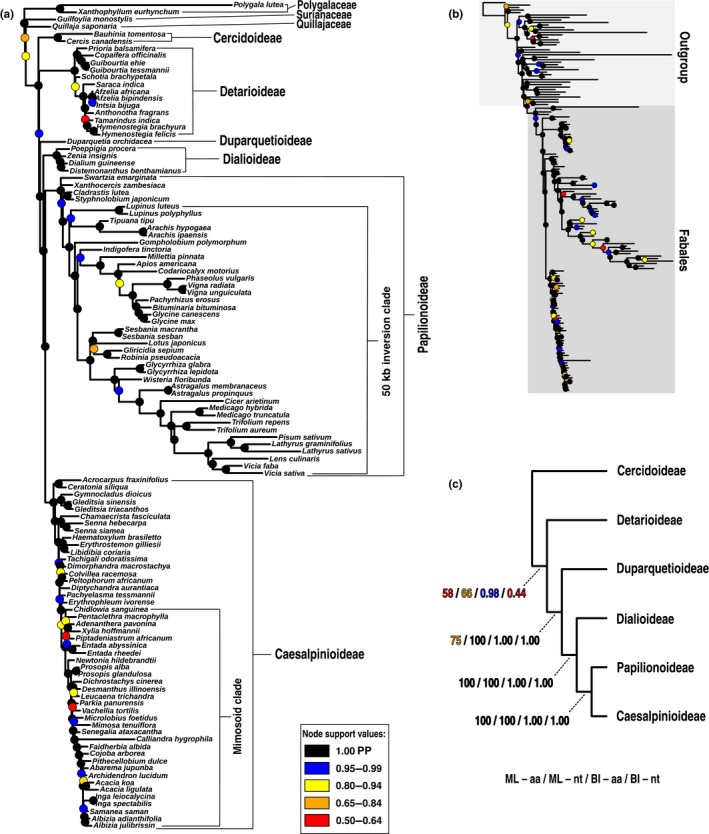
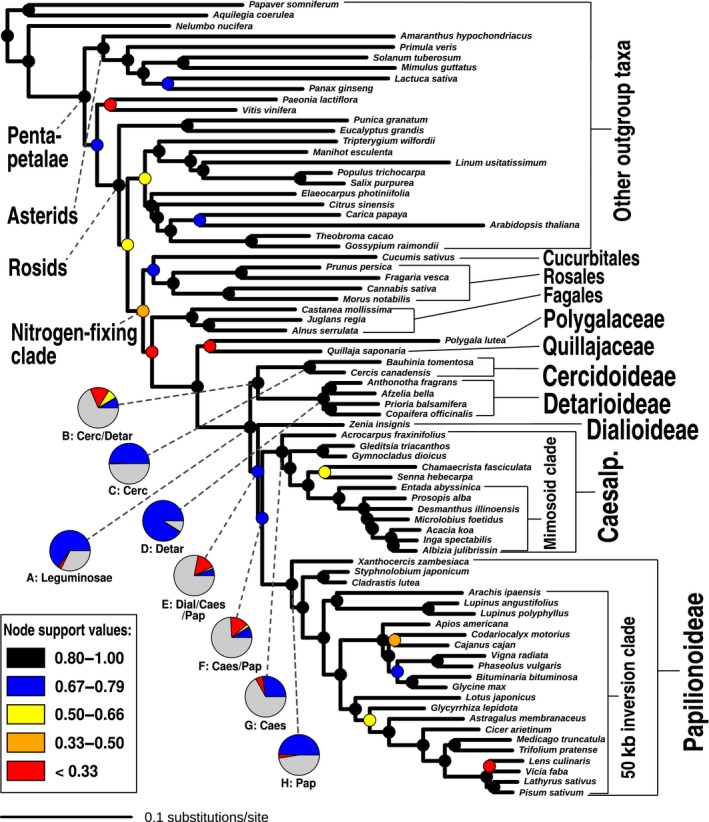
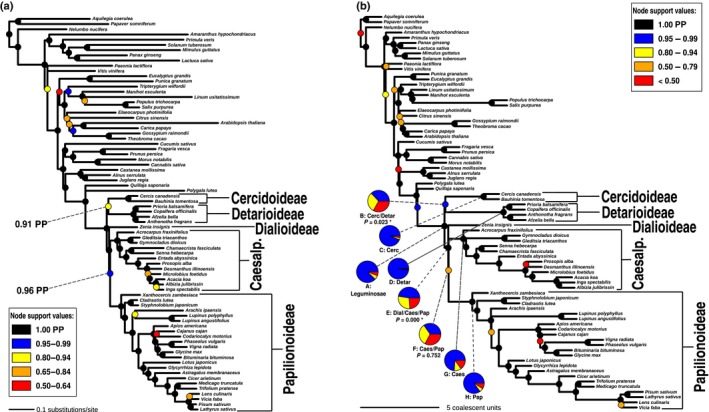
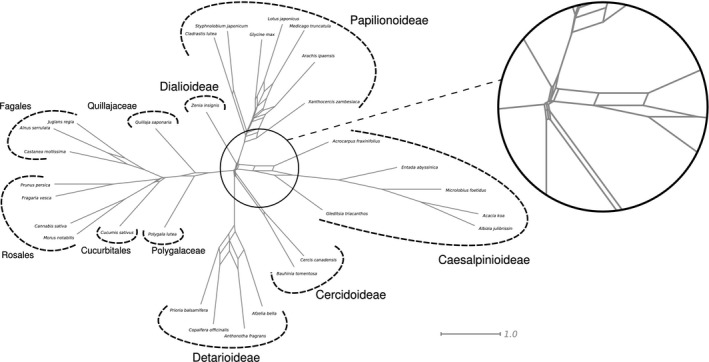
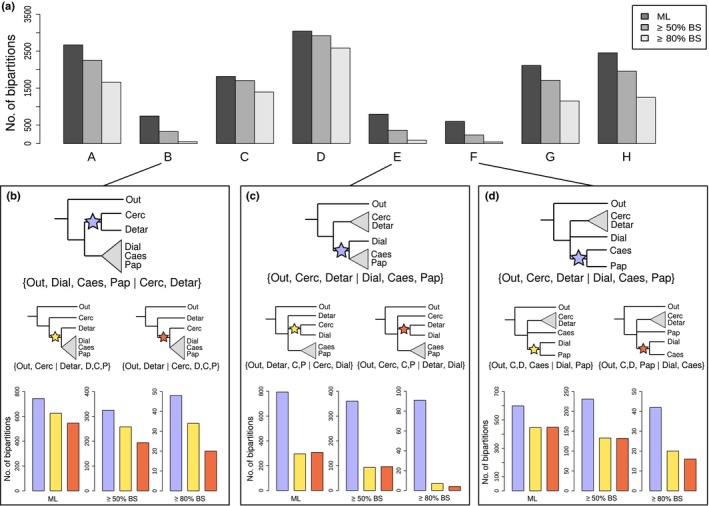
Phylogenomics is increasingly used to infer deep-branching relationships while revealing the complexity of evolutionary processes such as incomplete lineage sorting, hybridization/introgression and polyploidization. We investigate the deep-branching relationships among subfamilies of the Leguminosae (or Fabaceae), the third largest angiosperm family. Despite their ecological and economic importance, a robust phylogenetic framework for legumes based on genome-scale sequence data is lacking. We generated alignments of 72 chloroplast genes and 7621 homologous nuclear-encoded proteins, for 157 and 76 taxa, respectively. We analysed these with maximum likelihood, Bayesian inference, and a multispecies coalescent summary method, and evaluated support for alternative topologies across gene trees. We resolve the deepest divergences in the legume phylogeny despite lack of phylogenetic signal across all chloroplast genes and the majority of nuclear genes. Strongly supported conflict in the remainder of nuclear genes is suggestive of incomplete lineage sorting. All six subfamilies originated nearly simultaneously, suggesting that the prevailing view of some subfamilies as 'basal' or 'early-diverging' with respect to others should be abandoned, which has important implications for understanding the evolution of legume diversity and traits. Our study highlights the limits of phylogenetic resolution in relation to rapid successive speciation.

Keywords: Fabaceae; Leguminosae; gene tree conflict; incomplete lineage sorting; lack of phylogenetic signal; phylogenomics.


Figures

Figure 1
Figure 1
Diversity, ecology and economic importance of legumes. (a–f) The family is subdivided into six subfamilies: (a) Cercidoideae (Bauhinia madagascariensis); (b) Detarioideae (Macrolobium angustifolium); (c) Duparquetioideae (Duparquetia orchidacea); (d) Dialioideae (Baudouinia sp.); (e) Caesalpinioideae (Mimosa pectinatipinna); and (f) Papilionoideae (Medicago marina). (g) While the family has a very diverse floral morphology, the fruit (Brodriguesia santosii), which comes in many shapes and is most often referred to as a 'pod' or 'legume', is the defining feature of the family. (h) A large fraction of legume species is known to fix atmospheric nitrogen symbiotically with 'rhizobia', bacteria that are incorporated in root nodules, for example in Lupinus nubigenus. (i) Economically, the family is the second most important of flowering plants after the grasses, with a wide array of uses, including timber, ornamentals, fodder crops, and, notably, pulse crops such as peanuts (Arachis hypogaea), beans (Phaseolus vulgaris), chickpeas (Cicer arietinum) and lentils (Lens culinaris). (j–l) Ecologically, legumes are also extremely diverse and important, occurring and often dominating globally across disparate ecosystems, including: wet tropical forest, for example, Albizia grandibracteata in the East African Albertine Rift (j); savannas, seasonally dry tropical forests, and semi‐arid thorn‐scrub, for example. Mimosa delicatula in Madagascar (k); and temperate woodlands and grasslands, for example, Vicia sylvatica in the European Alps (l). Photographs: (a, b, d, i–l) Erik Koenen; (c) Jan Wieringa; (e–h) Colin Hughes.
Figure 2
Figure 2
Phylogeny of legumes based on Bayesian analyses of 72 protein‐coding chloroplast genes under the CATGTR model in phylobayes. (a) Majority‐rule consensus tree of the amino acid alignment, showing only the Fabales portion of the tree, outgroup taxa pruned; (b) complete tree including outgroup taxa; (c) simplified tree showing support for subfamily relationships with different inference methods (ML, maximum likelihood; BI, Bayesian inference) and sequence types (aa, amino acids; nt, nucleotides). Majority‐rule consensus trees for both the amino acid and nucleotide alignments with tip labels for all taxa and support values indicated are included in Supporting Information Figs S1 and S2. In (a) and (b), coloured circles indicate node support in posterior probabilities (PP).
Figure 3
Figure 3
Maximum likelihood phylogeny of legumes estimated with raxml under the LG4X model from a concatenated alignment of 1103 nuclear orthologues. Internode certainty all (ICA) values are indicated with coloured symbols on nodes for simplicity of presentation (see Supporting Information Fig. S5 for actual support values for all nodes). For the first four divergences in the legume family, as well as the subfamily nodes for the four subfamilies represented by more than one accession (nodes labelled A–H), pie charts indicate the proportions of gene trees supporting the relationship shown (blue), supporting the most prevalent conflicting bipartition (yellow), supporting other conflicting bipartitions (red) and uninformative genes (i.e. no bootstrap support (BS) and/or missing relevant taxa; grey). Numbers of bipartitions for the pie charts are derived from phyparts analyses with a 50% BS filter. Labelled nodes A–H are analysed in more detail in Fig. 6. Abbreviations for subfamilies: Cerc, Cercidoideae; Detar, Detarioideae; Dial, Dialioideae; Caes, Caesalpinioideae; Pap, Papilionoideae.
Figure 4
Figure 4
Bayesian and multispecies coalescent analyses yield congruent relationships, identical to those in Fig. 3 obtained with maximum likelihood (ML) analysis of nuclear data. (a) Bayesian gene jackknifing majority‐rule consensus tree of concatenated alignments of c. 220 genes per replicate. Support indicated by coloured circles on nodes represents posterior probability (PP) averaged over 25 replicates for 500 posterior trees each (in total, 12 500 posterior trees). (b) Phylogeny estimated under the multispecies coalescent with astral from ML gene trees. Support indicated by coloured symbols on nodes represents local posterior probability. Pie charts show relative quartet support for the first (blue) and the two (yellow and red) alternative quartets. P‐values for the polytomy test are given for nodes B, E and F below the respective pie charts for those nodes. Significance (P ≤ 0.05) is indicated with an asterisk (see Supporting Information Figs S6, S7 for phylogenetic trees with all PP and quartet support values indicated). Abbreviations for subfamlies: Cerc, Cercidoideae; Detar, Detarioideae; Dial, Dialioideae; Caes, Caesalpinioideae; Pap, Papilionoideae.
Figure 5
Figure 5
Filtered supernetwork inferred from the 1103 one‐to‐one orthologues, with extremely short internal edges around the origin of the legumes, highlighting their near‐simultaneous divergence.
Figure 6
Figure 6
Leguminosae and its subfamilies are each supported by a large fraction of gene trees, in contrast to relationships among the subfamilies. (a) Prevalence of bipartitions that are equivalent to nodes A–H (see Figs 3, 4b) among the 3473 gene trees inferred from the rooted ingroup homologue clusters (including one‐to‐one orthologues) in which all five subfamilies and the outgroup were included. Numbers of bipartitions are shown as counted from the best‐scoring maximum likelihood (ML) gene trees as well as taking only bipartitions with ≥ 50% and ≥ 80% bootstrap support (BS) into account, as indicated in the legend. (b–d) Prevalence of bipartitions for nodes B, E and F plotted next to the most common alternative bipartitions. The locations of the stars in the illustrations indicate the internodes of the phylogeny that are equivalent to the bipartitions for which counts are plotted below, as counted from the ML estimates and for bipartitions with ≥ 50% or ≥ 80% BS. Colours of the stars correspond to the colours of the bars in the bar plots. Abbreviations in tree plots in (b–d) are as follows: Out, outgroup; Cerc, Cercidoideae; Detar, Detarioideae; Dial, Dialioideae; Caes, Caesalpinioideae; Pap, Papilionoideae; C; D, Cercidoideae + Detarioideae; D; C; P, Dialioideae + Caesalpinioideae + Papilionoideae; C; P, Caesalpinioideae + Papilionoideae.

References

    1. Bankevich A, Nurk S, Antipov D, Gurevich AA, Dvorkin M, Kulikov AS, Lesin VM, Nikolenko SI, Pham S, Prjibelski AD, Pyshkin AV, Sirotkin AV, Vyahhi N, Tesler G, Alekseyev MA, Pevzner PA. 2012. SPAdes: a new genome assembly algorithm and its applications to single‐cell sequencing. Journal of Computational Biology 19: 455–477. - PMC - PubMed
    1. Bolger AM, Lohse M, Usadel B. 2014. Trimmomatic: a flexible trimmer for Illumina sequence data. Bioinformatics 30: 2114–2120. - PMC - PubMed
    1. Bruneau A, Mercure M, Lewis GP, Herendeen PS. 2008. Phylogenetic patterns and diversification in the caesalpinioid legumes. Botany 86: 697–718.
    1. Bruneau A, Klitgaard BB, Prenner G, Fougere‐Danezan M, Tucker SC. 2014. Floral evolution in the Detarieae (Leguminosae): phylogenetic evidence for labile floral development in an early‐diverging legume lineage. International Journal of Plant Sciences 175: 392–417.
    1. Cannon SB, McKain MR, Harkess A, Nelson MN, Dash S, Deyholos MK, Peng Y, Joyce B, Stewart CN Jr, Rolf M, Kutchan T. 2015. Multiple polyploidy events in the early radiation of nodulating and nonnodulating legumes. Molecular Biology and Evolution 32: 193–210. - PMC - PubMed

Publication types

LinkOut - more resources