. 2020 Jan;40(1):128-144.
doi: 10.1161/ATVBAHA.119.313169. Epub 2019 Oct 31.

ApoE (Apolipoprotein E) in Brain Pericytes Regulates Endothelial Function in an Isoform-Dependent Manner by Modulating Basement Membrane Components

Affiliations

ApoE (Apolipoprotein E) in Brain Pericytes Regulates Endothelial Function in an Isoform-Dependent Manner by Modulating Basement Membrane Components

Yu Yamazaki et al. Arterioscler Thromb Vasc Biol. 2020 Jan.

Abstract

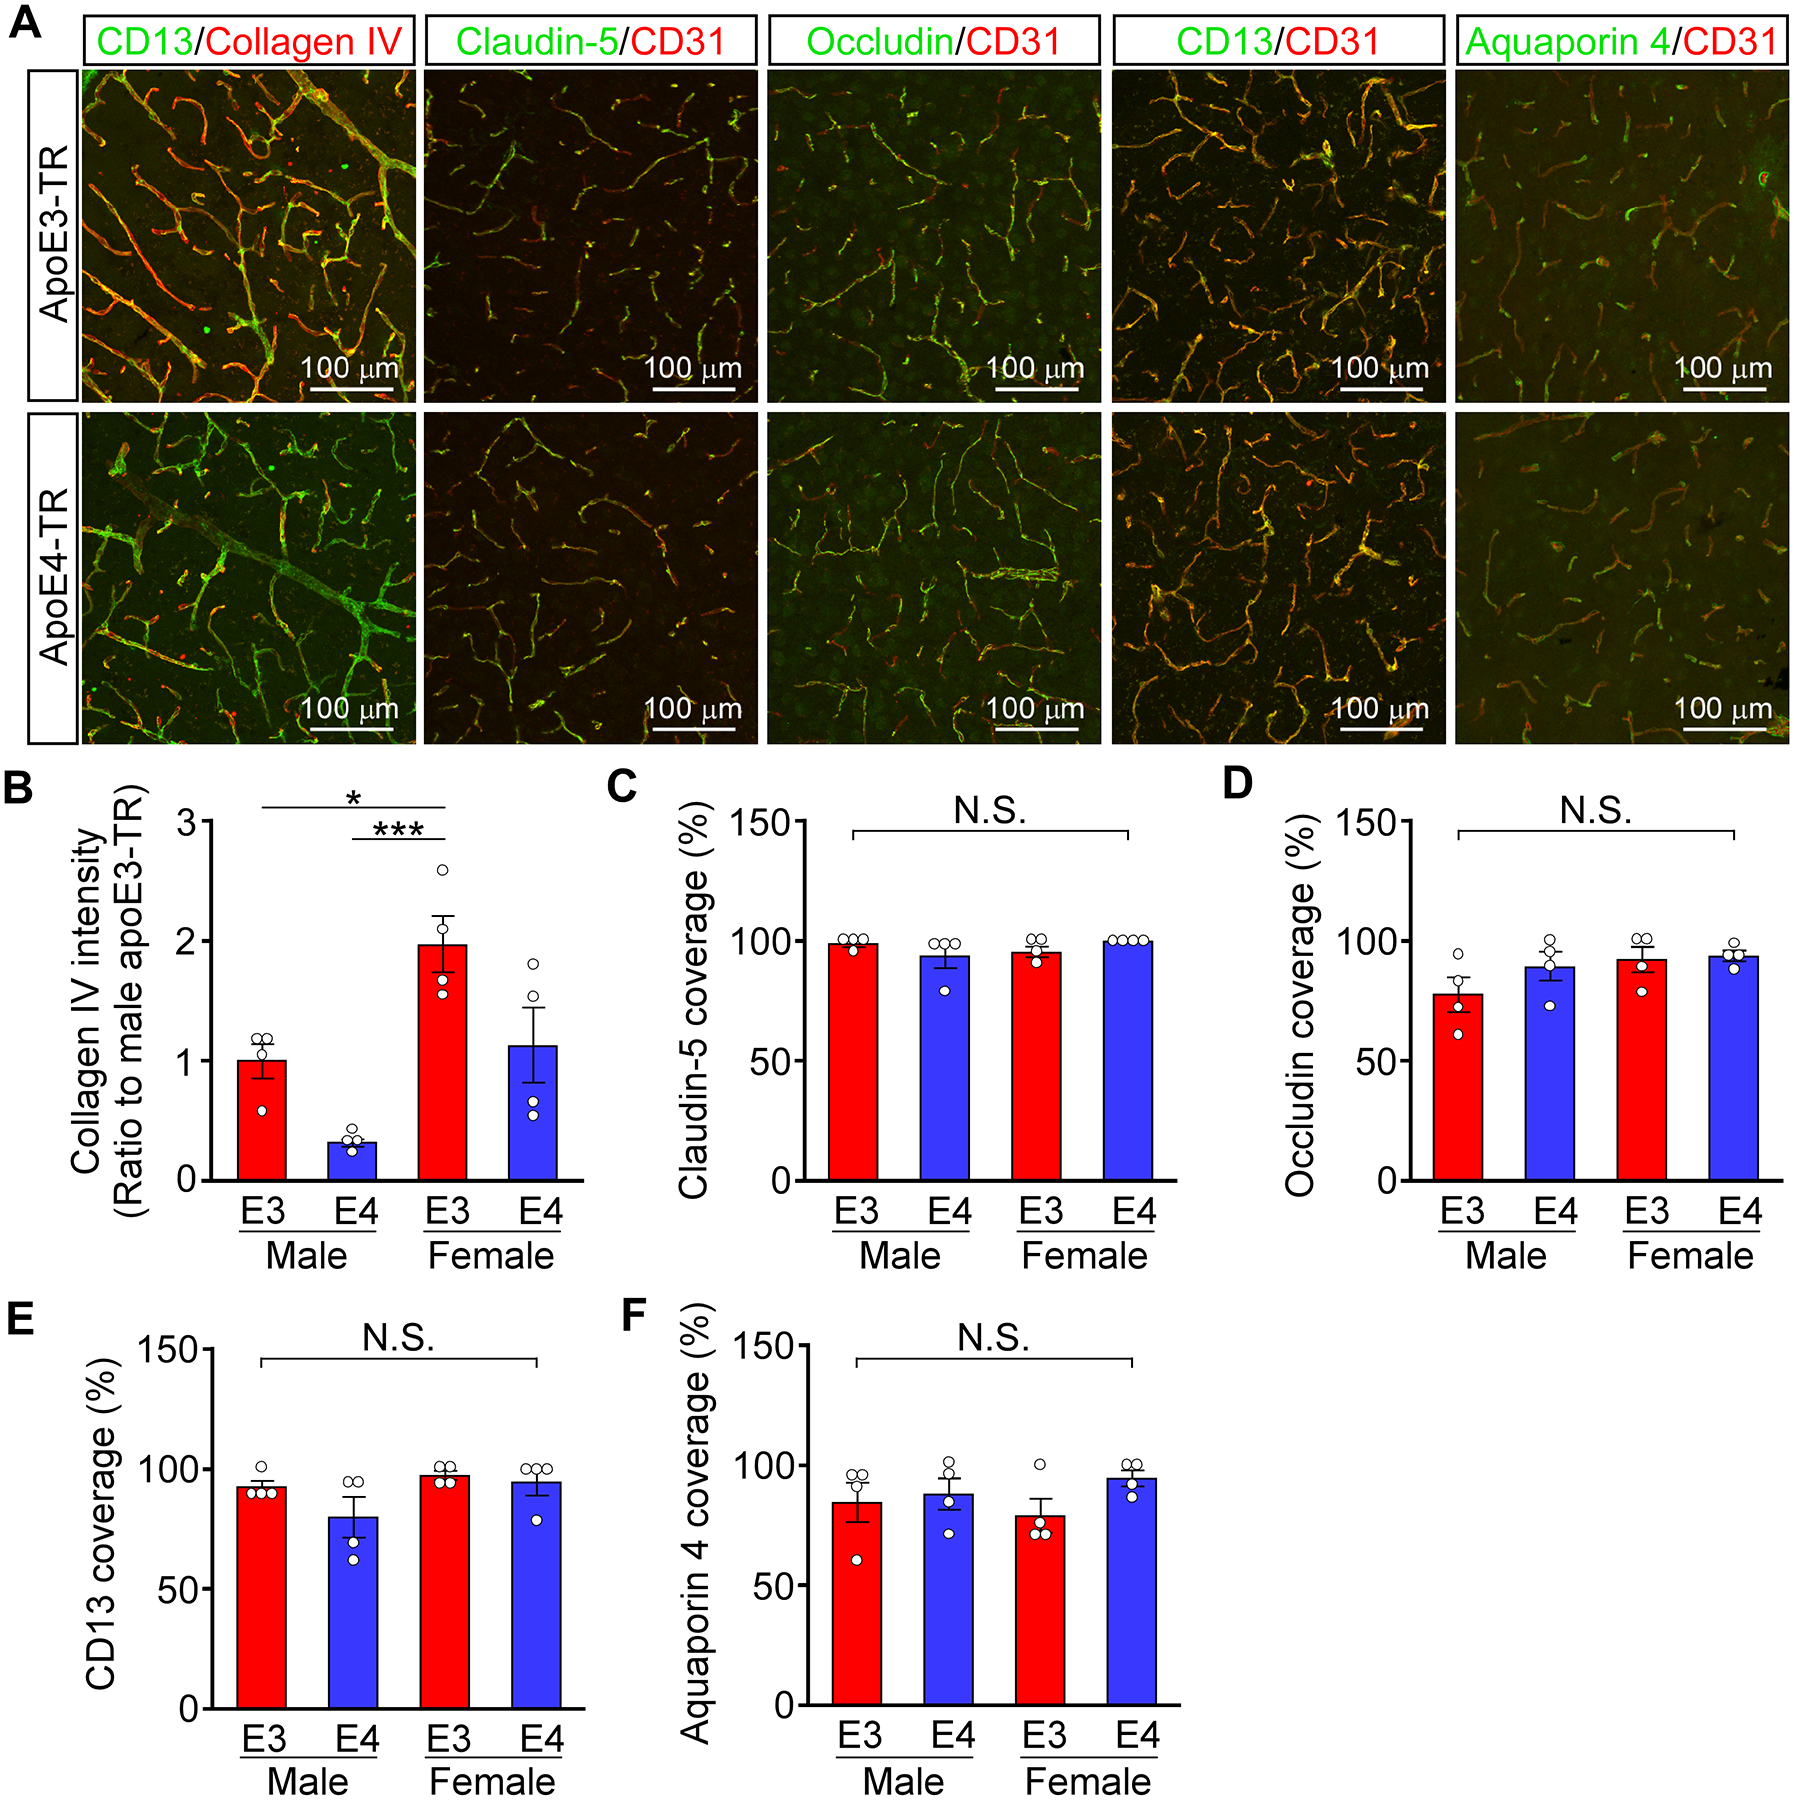
Objective: The ε4 allele of the APOE gene (APOE4) is the strongest genetic risk factor for Alzheimer disease when compared with the common ε3 allele. Although there has been significant progress in understanding how apoE4 (apolipoprotein E4) drives amyloid pathology, its effects on amyloid-independent pathways, in particular cerebrovascular integrity and function, are less clear. Approach and Results: Here, we show that brain pericytes, the mural cells of the capillary walls, differentially modulate endothelial cell phenotype in an apoE isoform-dependent manner. Extracellular matrix protein induction, tube-like structure formation, and barrier formation were lower with endothelial cells cocultured with pericytes isolated from apoE4-targeted replacement (TR) mice compared with those from apoE3-TR mice. Importantly, aged apoE4-targeted replacement mice had decreased extracellular matrix protein expression and increased plasma protein leakages compared with apoE3-TR mice.

Conclusions: ApoE4 impairs pericyte-mediated basement membrane formation, potentially contributing to the cerebrovascular effects of apoE4.

Keywords: Alzheimer disease; blood-brain barrier; collagen IV; extracellular matrix; pericytes; risk factors; tight junction.


Figures

Figure 1.
Figure 1.. Primary pericytes from apoE-TR mice abundantly secrete lipidated apoE.
A, Representative images of pericytes stained for NG2 (left) and PDGFRβ (right) are shown. Nuclei were counterstained with 4’,6-diamidino-2-phenylindole (DAPI). B, The amount of apoE in the conditioned media from primary cultures of endothelial cells (EC), pericytes (PC), and astrocytes (AS) was measured by ELISA and normalized against the total protein concentrations in cell lysates. C, Conditioned media from primary cultures of PC and AS were concentrated and subjected to size-exclusion chromatography run by FPLC using a Superose-6 column. The amount of apoE in each fraction was determined by ELISA. Values of three independent experiments were averaged and plotted against fraction numbers. D, Conditioned media from primary cultures of PC and AS were concentrated and subjected to an immunoprecipitation using an apoE-specific antibody. The amount of apoE-associated cholesterol was determined by Amplex Red cholesterol assay after immunoprecipitation with anti-apoE antibody. Data in B and D are presented as mean ± s.e.m. (N=4). Each dot in B and D represents a measurement from one independent primary cell culture prepared from brains of 4 male and 4 female mice. *P<0.05, apoE3-EC vs. apoE3-PC, Mann-Whitney test (B, top panel). *P<0.05, apoE4-EC vs. apoE4-PC, Mann-Whitney test (B, bottom panel). The amount of apoE in the conditioned media from primary AS is not included in the statistical analysis (B). *P<0.05, apoE3-PC vs. apoE3-AS, Mann-Whitney test (D, top panel); *P<0.05, apoE4-PC vs. apoE4-AS, Mann-Whitney test (D, bottom panel).
Figure 2.
Figure 2.. ApoE isoform-dependent effects of pericytes on endothelial cell gene expression in contact and non-contact co-culture systems.
A, Left; in a contact co-culture model, HUVECs (EC) were plated with primary cultures of pericytes from apoE3-TR (apoE3-PC) or apoE4-TR (apoE4-PC) mice at a ratio of EC to PC of 5:1. Right; in a non-contact co-culture model, apoE3-PC and apoE4-PC were cultured on semipermeable filter inserts, while EC were cultured into the well of culture plate. B-G, The mRNA levels of COL4A1 (B), COL4A2 (C), NID1 (D), NID2 (E), FN1 (F) and HSPG (G) in EC were determined by qRT-PCR and compared between EC monoculture, EC co-cultured with apoE3-PC or apoE4-PC. Data in B-G are presented as mean ± s.e.m. (N=4). Each dot in B-G represents a measurement from one independent primary cell culture prepared from brains of 4 male and 4 female mice. **P<0.01, EC monoculture vs. EC co-cultured with apoE3-PC; *P<0.05, EC co-cultured with apoE3-PC vs. EC co-cultured with apoE4-PC; N.S, not significant, one-way ANOVA followed by Tukey’s multiple comparison tests (B, left panel). N.S., not significant, Kruskal-Wallis test followed by Dunn’s multiple comparison tests (B, right panel). ***P<0.001, EC monoculture vs. EC co-cultured with apoE3-PC; *P<0.05, EC co-cultured with apoE3-PC vs. EC co-cultured with apoE4-PC; N.S., not significant, one-way ANOVA followed by Tukey’s multiple comparison tests (C, left panel). ***P<0.001, EC monoculture vs. EC co-cultured with apoE3-PC; EC monoculture vs. EC co-cultured with apoE4-PC; N.S., not significant, one-way ANOVA followed by Tukey’s multiple comparison tests (C, right panel). **P<0.01, EC monoculture vs. EC co-cultured with apoE3-PC; N.S., not significant, Kruskal-Wallis test followed by Dunn’s multiple comparison tests (D, left panel). N.S., not significant, Kruskal-Wallis test followed by Dunn’s multiple comparison tests (D, right panel). **P<0.01, EC monoculture vs. EC co-cultured with apoE3-PC; N.S, not significant, Kruskal-Wallis test followed by Dunn’s multiple comparison tests (E, left panel). ****P<0.0001, EC monoculture vs. EC co-cultured with apoE3-PC; ***P<0.001, EC monoculture vs. EC co-cultured with apoE4-PC; N.S., not significant, one-way ANOVA followed by Tukey’s multiple comparison tests (E, right panel). **P<0.01, EC monoculture vs. EC co-cultured with apoE3-PC; N.S, not significant, Kruskal-Wallis test followed by Dunn’s multiple comparison tests (F, left panel). ***P<0.001, EC monoculture vs. EC co-cultured with apoE3-PC; *P<0.05, EC monoculture vs. EC co-cultured with apoE4-PC; N.S., not significant, one-way ANOVA followed by Tukey’s multiple comparison tests (F, right panel). ****P<0.0001, EC monoculture vs. EC co-cultured with apoE3-PC; **P<0.05, EC monoculture vs. EC co-cultured with apoE4-PC; N.S., not significant, one-way ANOVA followed by Tukey’s multiple comparison tests (G, left panel). **P<0.01, EC monoculture vs. EC co-cultured with apoE3-PC, EC monoculture vs. EC co-cultured with apoE4-PC; N.S., not significant, one-way ANOVA followed by Tukey’s multiple comparison tests (G, right panel).
Figure 3.
Figure 3.. Pericyte-mediated vasculogenesis in a 3-D co-culture system depends on apoE isoforms.
HUVECs (EC) were co-cultured with primary pericytes from apoE3-TR (apoE3-PC) or apoE4-TR (apoE4-PC) mice at a ratio of EC to pericytes of 5:1 in 3-D collagen matrices. A, Representative phase contrast images for vascular network formation after 5 days of the co-culture in 3-D matrices. Left, EC co-cultured with apoE3-PC; Right, EC co-cultured with apoE4-PC. B, Endothelial tube-like structures visualized by CD31 staining and PC visualized by PDGFRβ staining after 5 days of co-culture. Left, EC monoculture; middle, EC co-cultured with apoE3-PC; right, EC co-cultured with apoE4-PC. C, D, Endothelial network density (total endothelial length of network/area; C) and mean branch length (average length of tube-like structures; D) after 5 days of the co-culture in 3-D matrices were quantified and compared between EC monoculture, and EC co-cultured with apoE3-PC or apoE4-PC. E, The mRNA levels of COL4A1 and COL4A2 in EC after co-cultured with PC in 3-D matrices for 5 days were determined by qRT-PCR. Data in C-F are presented as mean ± s.e.m. (N=6). Each dot in C-F represents a measurement from one independent primary cell culture prepared from brains of 4 male and 4 female mice. *P<0.05, EC co-cultured with apoE3-PC vs. EC co-cultured with apoE4-PC, two-tailed Student t test. The measurements from EC monoculture are shown for reference and are not included in the statistical analysis (C). ***P<0.001, EC co-cultured with apoE3-PC vs. EC co-cultured with apoE4-PC, two-tailed Student t test. The measurements from EC monoculture are shown for reference and are not included in the statistical analysis (D). **P<0.01, EC co-cultured with apoE3-PC vs. EC co-cultured with apoE4-PC, two-tailed Student t test. The measurements from EC monoculture are shown for reference and are not included in the statistical analysis (E). **P<0.01, EC co-cultured with apoE3-PC vs. EC co-cultured with apoE4-PC, two-tailed Student t test. The measurements from EC monoculture are shown for reference and are not included in the statistical analysis (F).
Figure 4.
Figure 4.. Pericytic apoE isoforms differentially modulate endothelial barrier integrity in vitro.
A, Schematic representation of the triple co-culture for an in vitro BBB model. Mouse primary cultures of endothelial cells (EC) were cultured on semipermeable filter inserts and primary pericytes (PC) were plated on the bottom side of the filters, whereas primary astrocytes (AS) were cultured on the well of culture plate. Endothelial barrier integrity was evaluated by transendothelial electric resistance (TEER) measurement at 5 days after plating for co-culture. B, Using the in vitro BBB models composed of PC from apoE3-TR (apoE3-PC) or apoE4-TR mice (apoE4-PC), and EC and AS from Apoe-KO mice, TEER was measured. C, Using the in vitro BBB models composed of EC from apoE3-TR (apoE3-EC) or apoE4-TR mice (apoE4-EC), and PC and AS from Apoe-KO mice, TEER was measured. D, E, The amounts of tight junction proteins (claudin-5 and occludin) and collagen IV in EC lysates were determined by ELISA in the BBB models with apoE3-PC or apoE4-PC (D) and apoE3-EC or apoE4-EC (E). F, G, Tight junction proteins (claudin-5 and occludin) in EC layers of the in vitro BBB models composed of apoE3-PC or apoE4-PC, and EC and AS from Apoe-KO mice were visualized by immunofluorescence (F). Nuclei were counterstained with 4’,6-diamidino-2-phenylindole (DAPI). The cell border staining pattern was quantified by a semi-quantitative score system and compared (G). Grade 1, 0–24% continuous border staining; Grade 2, 25–49% continuous border staining; Grade 3, 50–74% continuous border staining; Grade 4, 75–99% continuous border staining; Grade 5, completely continuous border staining. Data in B-D are presented as mean ± s.e.m. (N=6). Each dot in B-E represents a measurement from one independent primary cell culture prepared from brains of 4 male and 4 female mice. **P<0.01, in vitro BBB models composed of apoE3-PC, and EC and AS from Apoe-KO mice vs. in vitro BBB models composed of apoE4-PC, and EC and AS from Apoe-KO mice, two-tailed Student t test (B). N.S., not significant, in vitro BBB models composed of apoE3-EC, and PC and AS from Apoe-KO mice vs. in vitro BBB models composed of apoE4-EC, and PC and AS from Apoe-KO mice, two-tailed Student t test (C). N.S., not significant, in vitro BBB models composed of apoE3-PC, and EC and AS from Apoe-KO mice vs. in vitro BBB models composed of apoE4-PC, and EC and AS from Apoe-KO mice, Mann-Whitney test (D, left panel). N.S., not significant, in vitro BBB models composed of apoE3-PC, and EC and AS from Apoe-KO mice vs. in vitro BBB models composed of apoE4-PC, and EC and AS from Apoe-KO mice, two-tailed Student t test (D, middle panel). **P<0.01, in vitro BBB models composed of apoE3-PC, and EC and AS from Apoe-KO mice vs. in vitro BBB models composed of apoE4-PC, and EC and AS from Apoe-KO mice, two-tailed Student t test (D, right panel). N.S., not significant, in vitro BBB models composed of apoE3-EC, and PC and AS from Apoe-KO mice vs. in vitro BBB models composed of apoE4-EC, and PC and AS from Apoe-KO mice, two-tailed Student t test (E). Six independent primary cell lines, each of which were prepared from brains of 4 male and 4 female mice, were analyzed. N.S., not significant, in vitro BBB models composed of apoE3-PC, and EC and AS from Apoe-KO mice vs. in vitro BBB models composed of apoE4-PC, and EC and AS from Apoe-KO mice, χ2 test (G).
Figure 5.
Figure 5.. Reduced collagen-IV deposition along cortical capillaries in apoE4-TR mice.
A, Collagen IV, CD31, claudin-5, occludin, CD13 and AQP4 were stained in frozen cortical sections from apoE3-TR (male; N=4, female; N=4) or apoE4-TR mice (male; N=4, female; N=4) at the age of 22 months. B, Total fluorescence intensity of collagen IV in cortical sections from those apoE-TR mice were quantified by ImageJ software (apoE, p=0.0034; sex, p=0.0011, apoE × sex, p=0.7080). C-F, The % of coverage against CD31-positive endothelial by claudin-5 (C, apoE, p=0.9304; sex, p=0.6093, apoE × sex, p=0.1227), occludin (D, apoE, p=0.2478; sex, p=0.1107, apoE × sex, p=0.3657), CD13 (E, apoE, p=0.1683; sex, p=0.0897, apoE × sex, p=0.3923) or AQP4 (F, apoE, p=0.1698; sex, p=0.9376, apoE × sex, p=0.3703) was quantified in cortical sections from the mice. Data in B-F are presented as mean ± s.e.m. Each dot in B-F represents a measurement from one mouse. *P<0.05, ***P<0.001 by Tukey-Kramer’s post-hoc analysis of two-way ANOVA. N.S., not significant among groups.
Figure 6.
Figure 6.. Increased plasma protein leakage in the cortex of apoE4-TR mice.
A-E, The levels of collagen IV (A; apoE, p<0.0001; sex, p=0.4401, apoE × sex, p=0.7307), claudin-5 (B; apoE, p=0.4365; sex, p=0.5057, apoE × sex, p=0.4332), occludin (C, apoE, p=0.7529; sex, p=0.8528, apoE × sex, p=0.9210), fibrinogen (D, apoE, p=0.0002; sex, p=0.9759, apoE × sex, p=0.5057) and IgG (E, apoE, p=0.0428; sex, p=0.5767, apoE × sex, p=0.6582) were determined by ELISA in apoE3-TR (male; N=8, female; N=9) and apoE4-TR mice (male; N=8, female; N=8) at 22 months of age. The measurement was normalized by protein concentration in each of the samples. Data in A-E are presented as mean ± s.e.m. Each dot represents a measurement from one mouse. *P<0.05, **P<0.01 by Tukey-Kramer’s post-hoc analysis of two-way ANOVA. N.S., not significant among groups. F-G, The correlations between the levels of leaked plasma protein (fibrinogen and IgG) and that of collagen IV calculated across the male or female apoE3-TR (red circle) and apoE4-TR (blue circle) mice were assessed through nonparametric Spearman correlation analysis. The correlation coefficient (R2) and p value are shown in each panel.

Comment in

References

    1. Van Cauwenberghe C, Van Broeckhoven C, Sleegers K. The genetic landscape of alzheimer disease: Clinical implications and perspectives. Genet Med. 2016;18:421–430 - PMC - PubMed
    1. Liu CC, Kanekiyo T, Xu H, Bu G. Apolipoprotein e and alzheimer disease: Risk, mechanisms and therapy. Nat Rev Neurol. 2013;9:106–118 - PMC - PubMed
    1. Bu G. Apolipoprotein e and its receptors in alzheimer’s disease: Pathways, pathogenesis and therapy. Nat Rev Neurosci. 2009;10:333–344 - PMC - PubMed
    1. Farrer LA, Cupples LA, Haines JL, Hyman B, Kukull WA, Mayeux R, Myers RH, Pericak-Vance MA, Risch N, van Duijn CM. Effects of age, sex, and ethnicity on the association between apolipoprotein e genotype and alzheimer disease. A meta-analysis. Apoe and alzheimer disease meta analysis consortium. Jama. 1997;278:1349–1356 - PubMed
    1. Kamboh MI, Aston CE, Ferrell RE, Hamman RF. Impact of apolipoprotein e polymorphism in determining interindividual variation in total cholesterol and low density lipoprotein cholesterol in hispanics and non-hispanic whites. Atherosclerosis. 1993;98:201–211 - PubMed

Publication types

MeSH terms