. 2019 Oct 30;16(1):196.
doi: 10.1186/s12974-019-1589-y.

MCP1-CCR2 and neuroinflammation in the ALS motor cortex with TDP-43 pathology

Affiliations

MCP1-CCR2 and neuroinflammation in the ALS motor cortex with TDP-43 pathology

Javier H Jara et al. J Neuroinflammation. .

Abstract

Background: The involvement of non-neuronal cells and the cells of innate immunity has been attributed to the initiation and progression of ALS. TDP-43 pathology is observed in a broad spectrum of ALS cases and is one of the most commonly shared pathologies. The potential involvement of the neuroimmune axis in the motor cortex of ALS patients with TDP-43 pathology needs to be revealed. This information is vital for building effective treatment strategies.

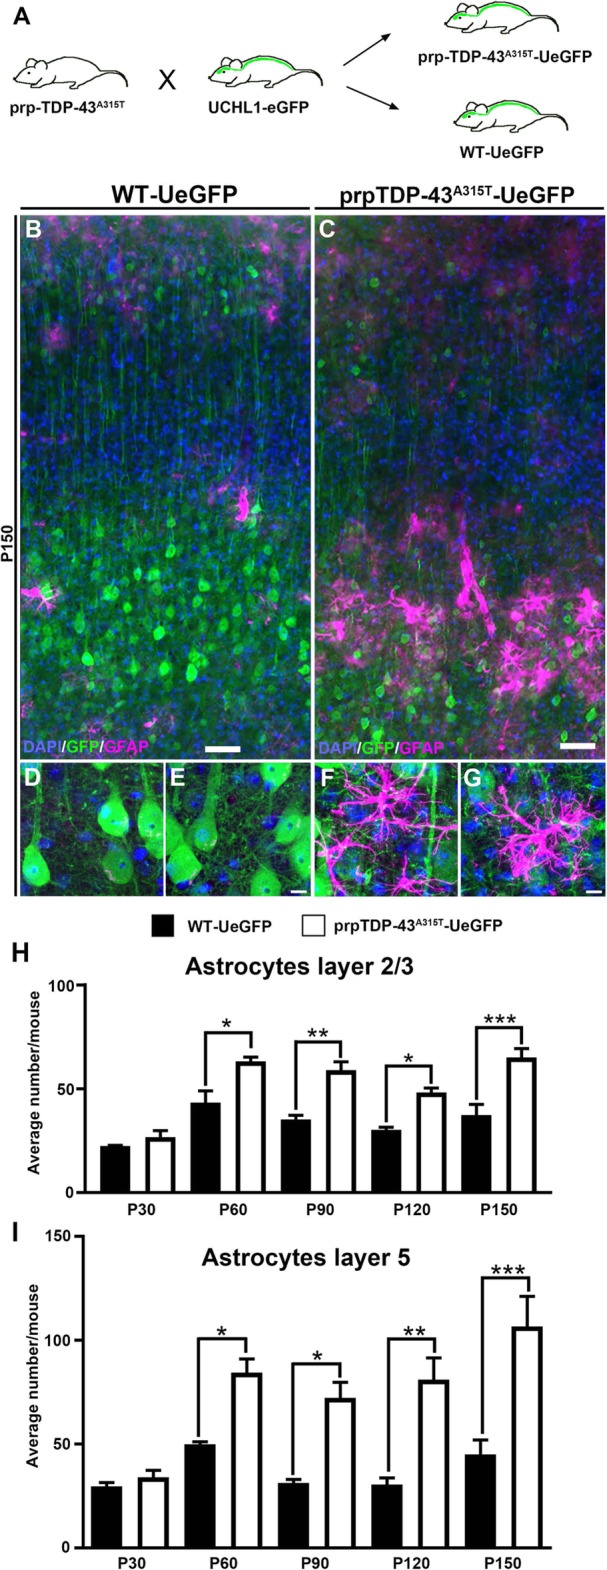
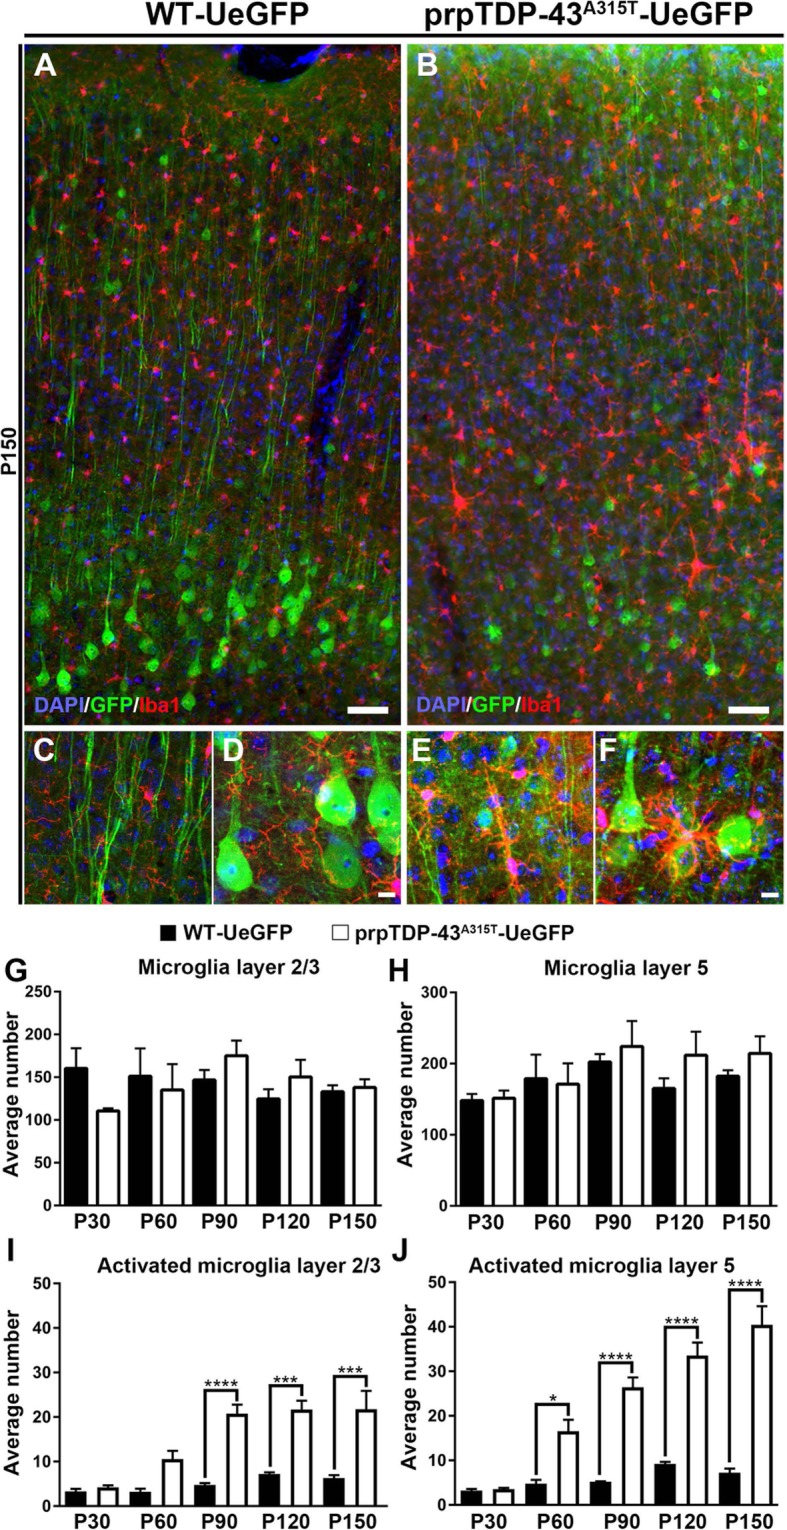
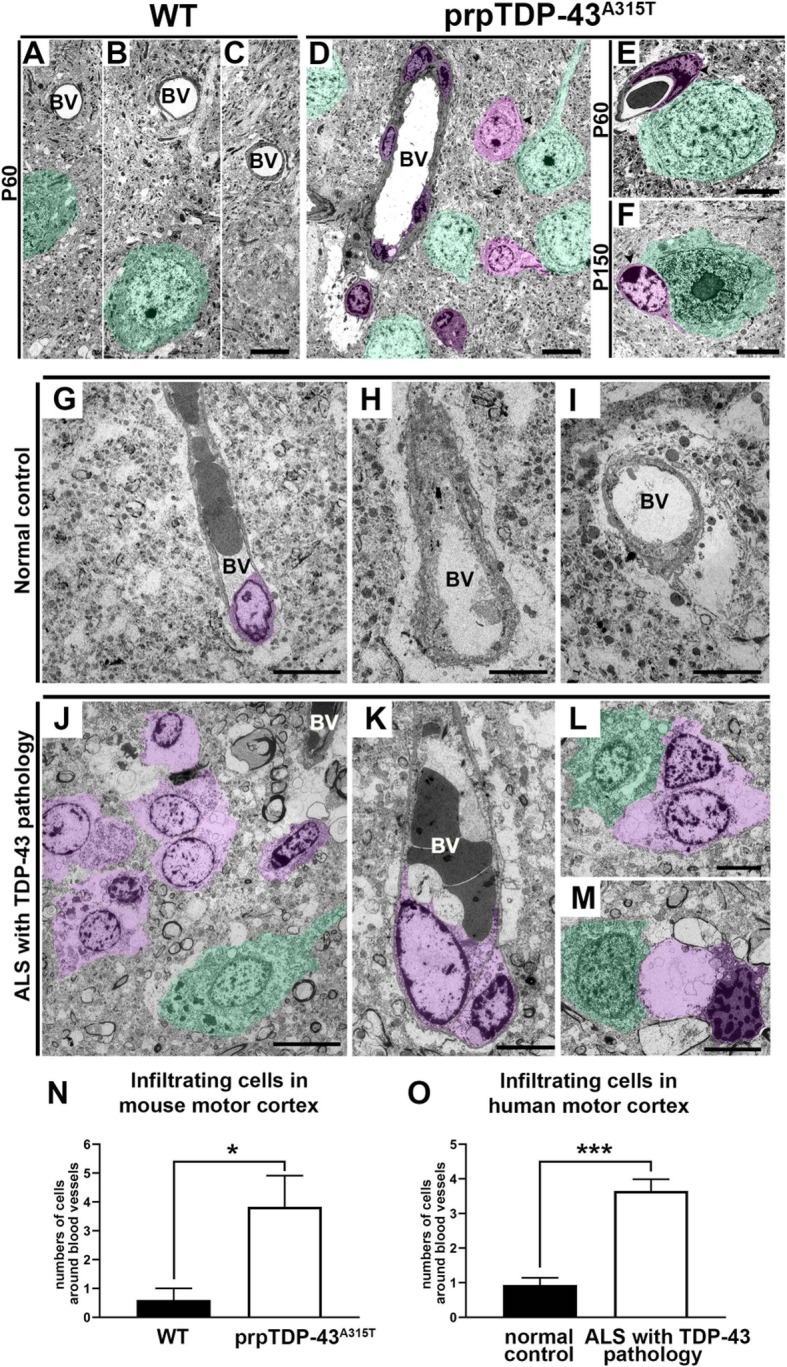
Methods: We investigated the presence of astrogliosis and microgliosis in the motor cortex of ALS patients with TDP-43 pathology. prpTDP-43A315T-UeGFP mice, corticospinal motor neuron (CSMN) reporter line with TDP-43 pathology, are utilized to reveal the timing and extent of neuroimmune interactions and the involvement of non-neuronal cells to neurodegeneration. Electron microscopy and immunolabeling techniques are used to mark and monitor cells of interest.

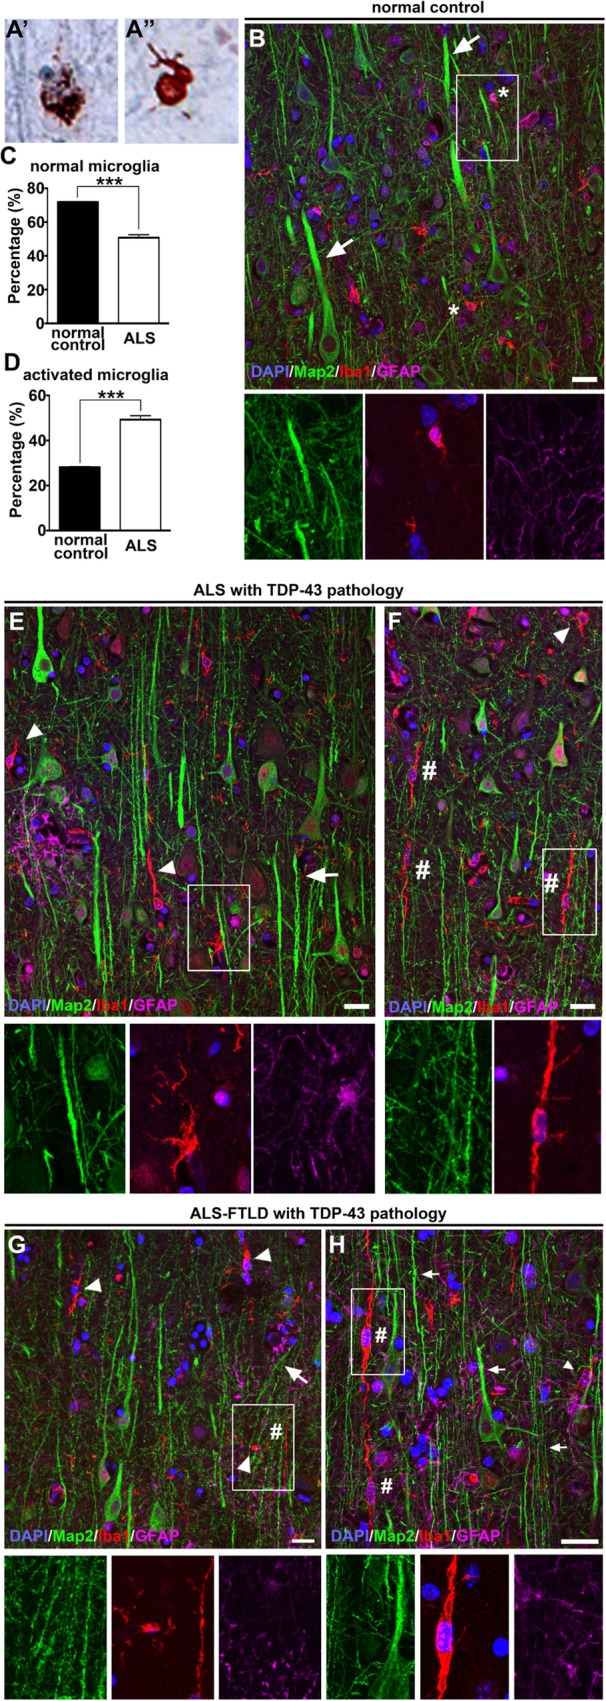
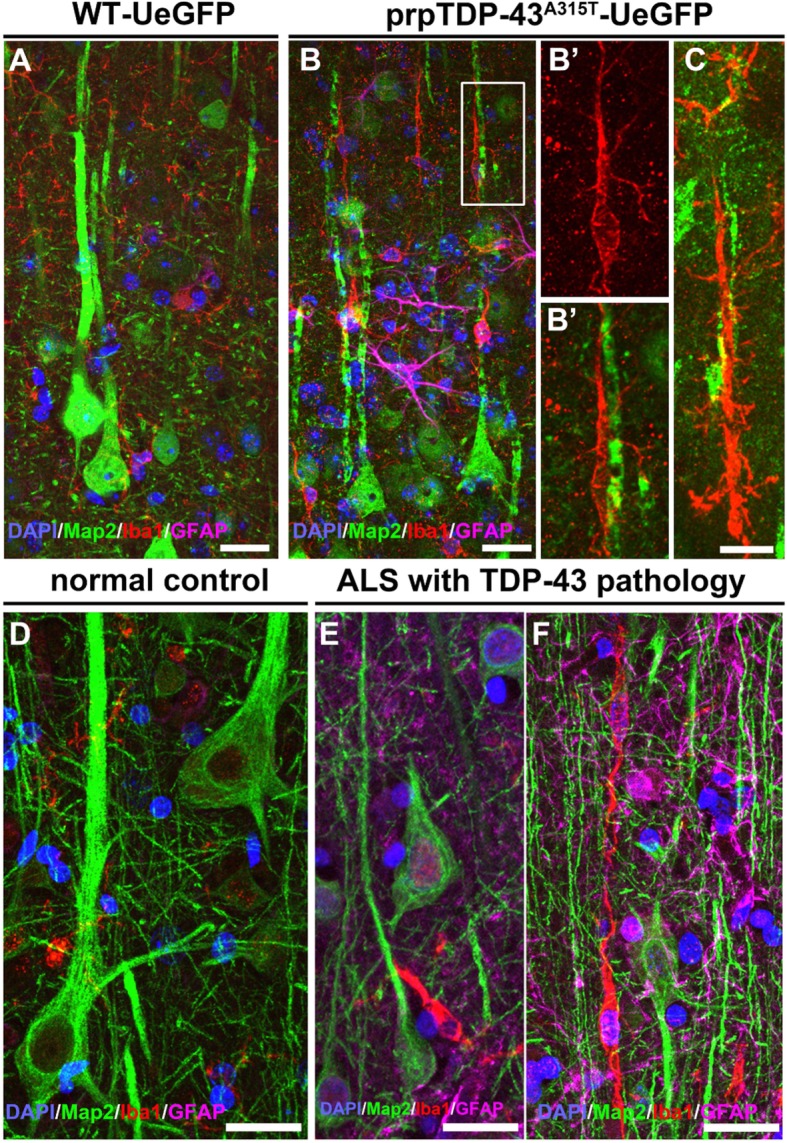
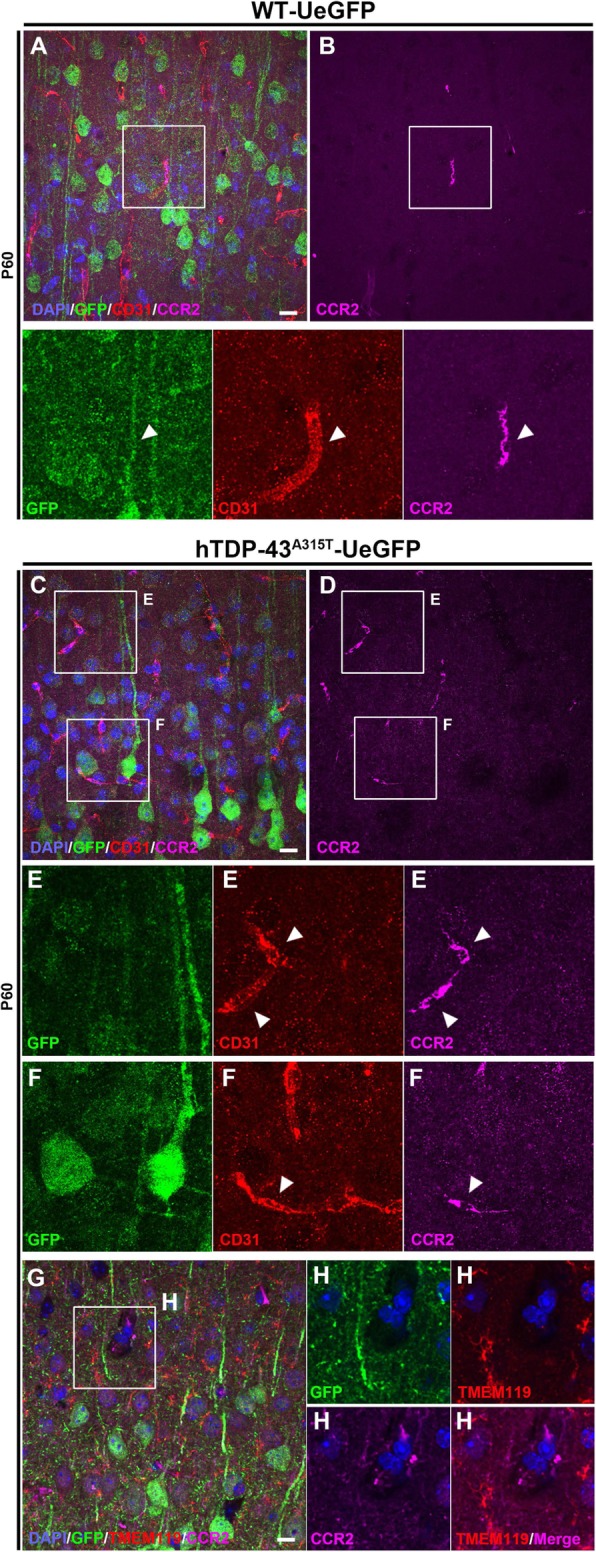
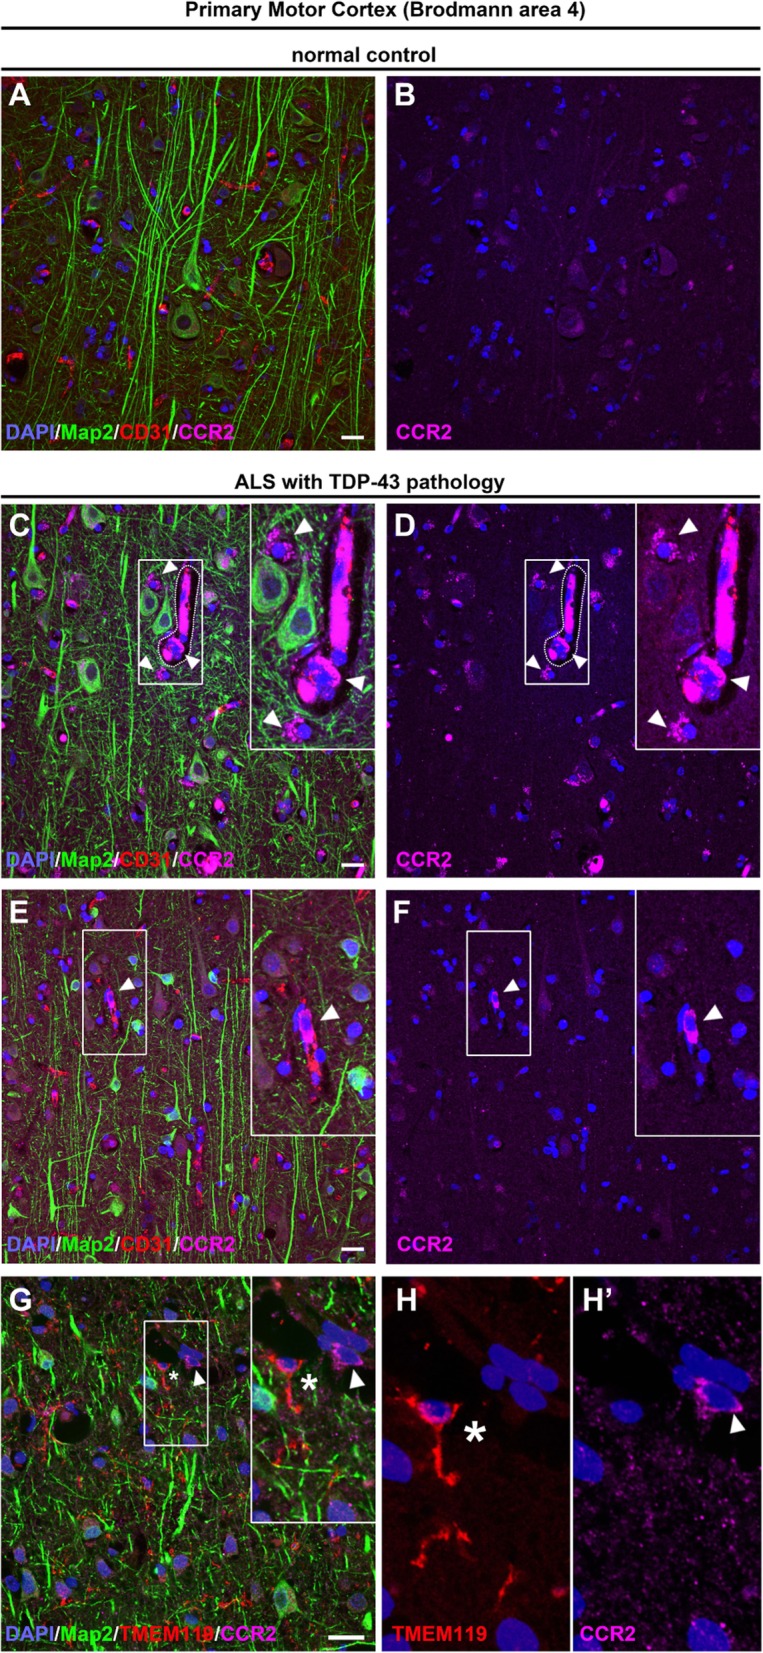
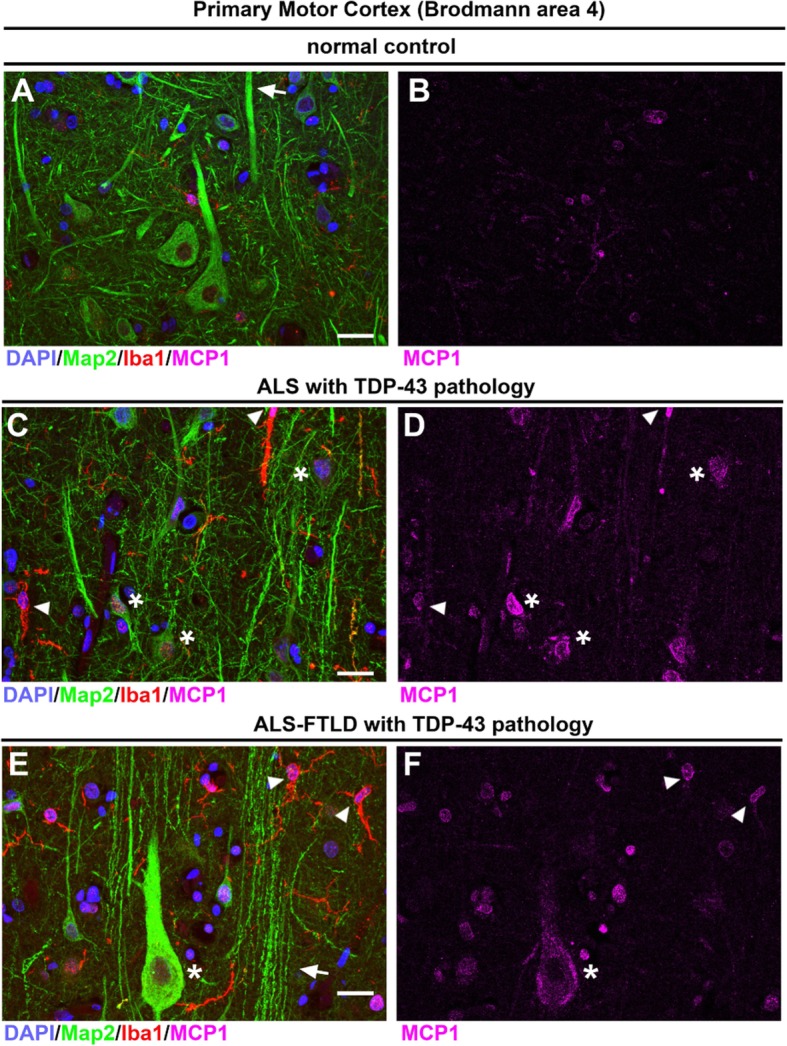
Results: We detected both activated astrocytes and microglia, especially rod-like microglia, in the motor cortex of patients and TDP-43 mouse model. Besides, CCR2+ TMEM119- infiltrating monocytes were detected as they penetrate the brain parenchyma. Interestingly, Betz cells, which normally do not express MCP1, were marked with high levels of MCP1 expression when diseased.

Conclusions: There is an early contribution of a neuroinflammatory response for upper motor neuron (UMN) degeneration with respect to TDP-43 pathology, and MCP1-CCR2 signaling is important for the recognition of diseased upper motor neurons by infiltrating monocytes. The findings are conserved among species and are observed in both ALS and ALS-FTLD patients.

Keywords: MCP1-CCR2 axis; Microglia; TDP-43; Upper motor neurons.


Conflict of interest statement

The authors declare that they have no competing interests.

Figures

Fig. 1
Fig. 1
Microgliosis is observed throughout the motor cortex of ALS patients with TDP-43 pathology. Representative images of layer 5 of the motor cortex isolated from postmortem normal controls and ALS patients. Representative image of cortical neuron showing neuronal cytoplasmic inclusions (a) and glial cytoplasmic inclusions (a’) of pTDP-43 (b). Normal controls have large Betz cells (Map 2+) located in layer 5 of the motor cortex with normal apical dendrites (arrows) with no evidence of microgliosis (Iba1+) or astrogliosis (GFAP+). Inset is enlarged bellow. c Graph represents percentage of normal microglia per section ± SEM in normal controls (black column) and with TDP-43 pathology (white column). d Graph represents percentage of activated microglia per section ± SEM in normal controls (black column) and withTDP-43 pathology (white column). e, f ALS cases with TDP-43 pathology have smaller Betz cells, microgliosis with rod-like microglia, and astrogliosis. g, h ALS-FTLD cases with TDP-43 pathology also have smaller Betz cells, microgliosis with rod-like microglia, and astrogliosis. Insets are enlarged bellow. ***p < 0.0001. Asterisk denotes normal microglia, arrows point to apical dendrites, arrowheads point to activated microglia, and number signs point to rod-like microglia. Scale bar = 20 μm
Fig. 2
Fig. 2
There is increased astrogliosis in the motor cortex of prpTDP-43A315T-UeGFP. a Breeding strategy to generate prpTDP-43A315T-UeGFP mice upon crossbreeding of prpTDP-43A315T and UCHL1-eGFP mice. b A representative low-magnification image of motor cortex of WT-UeGFP mice showing presence of few astrocytes with high-magnification images from layer 5 of motor cortex in (d and e). c A representative low image of motor cortex of prpTDP-43A315T-UeGFP mice showing presence of increased number of astrocytes with magnification images from layer 5 of motor cortex of prpTDP-43A315T-UeGFP mice showing astrocytes in close proximity to corticospinal motor neurons (f and g). h Quantification of number of astrocytes in layer 2/3 and i layer 5 shows a progressive increase in astrocytes in the motor cortex. Scale bar: a, d = 10 μm; b, c, e, f = 20 μm. *p < 0.05, **p < 0.001, ***p < 0.0001
Fig. 3
Fig. 3
Microgliosis is prominent in the motor cortex of prpTDP-43A315T-UeGFP. a A representative image of motor cortex of WT-UeGFP mice showing normal presence of microglia (Iba1+) with high-magnification images from layer 2/3 and layer 5 of motor cortex in (c and d) respectively. b A representative image of motor cortex of prpTDP-43A315T-UeGFP mice showing microgliosis with high-magnification images from layer 2/3, and layer 5 of motor cortex showing activated microglia adjacent to the apical dendrite and soma of corticospinal motor neurons in (e and f), respectively. g, h Quantification of number of microglia in layer 2/3 (g) and layer 5 (h) shows no difference in number of total microglia the motor cortex. i, j Quantification of activated microglia in layer 2/3 (i) and layer 5 shows a progressive increase of activated microglia in the motor cortex of prpTDP-43A315T-UeGFP mice. Scale bar: a, d = 10 μm; b, c, e, f = 20 μm. *p < 0.01, ***p < 0.0004, ****p < 0.0001
Fig. 4
Fig. 4
Microgliosis with respect to TDP-43 pathology is conserved among species. a A representative image of motor cortex of WT-UeGFP mice with healthy CSMN and normal levels of microglia and astrocytes. b A representative image of motor cortex of prpTDP-43A315T-UeGFP with activated microglia surrounding degenerating CSMN apical dendrites. Insets enlarged to the right (b’). c A representative image of rod-like microglia near a degenerating CSMN apical dendrite in the motor cortex of prpTDP-43A315T-UeGFP. d A representative image of layer 5 of the primary motor cortex (Brodmann area 4) isolated from normal controls showing healthy Betz cells and normal levels of microglia and astrocytes. e, f A representative image of layer 5 of the primary motor cortex (Brodmann area 4) isolated from postmortem ALS cases with TDP-43 pathology demonstrate presence of smaller Betz cells (Map 2+) surrounded by activated microglia (Iba1+) (e), and rod-like microglia near a degenerating apical dendrites of Betz cells are observed with prominent astrogliosis (f). Scale bar = 20 μm
Fig. 5
Fig. 5
Evidence of infiltrating monocyte contribution in the motor cortex of prpTDP-43A315T-UeGFP mice. a A representative image of motor cortex of WT-UeGFP mice showing an infiltrating monocyte (CCR2+) within the blood vessel (CD31+), see arrowheads. c, d A representative image of motor cortex of prpTDP-43A315T-UeGFP mice showing higher numbers of infiltrating monocytes (CCR2+) within the blood vessel (CD31+), see arrowheads and insets enlarged bellow in E, F. g, h A representative image of motor cortex of prpTDP-43A315T-UeGFP mice showing infiltrating monocytes (CCR2+) that lack TMEM119 expression within the blood vessel. Inset is enlarged to the right. Scale bar = 20 μm
Fig. 6
Fig. 6
Non-neuronal glial cells are in close proximity to CSMN in the prpTDP-43A315T mouse and to Betz cells in ALS cases with TDP-43 pathology. a–c Representative electron microscopy (EM) images in the motor cortex of WT mice. d A low-magnification EM image of motor cortex from prpTDP-43A315T mouse shows degenerating CSMN (green), several non-neuronal glial cells within blood vessels (dark purple) and in the brain parenchyma (light purple). e, f Representative high-magnification EM images of glial/macrophagic cells (purple) adjacent to CSMN. gi Representative EM images of the primary motor cortex (Brodmann area 4) isolated from normal controls showing blood vessels with few non-neuronal cells (dark purple). j A low-magnification EM image of the primary motor cortex (Brodmann area 4) isolated from ALS cases with TDP-43 pathology shows a degenerating Betz cell (green) with several non-neuronal glial cells in the vicinity (light purple). k A representative EM image of a blood vessel in motor cortex of ALS cases with TDP-43 pathology showing glial/macrophage protruding out (light purple). l, m Representative EM images showing degenerating Betz cells (green) in close proximity to glial/macrophages (light purple). n Graph represents average number of infiltrating cells around blood vessel per section in the mouse motor cortex of WT (black column) and prpTDP-43A315T (white column). o Graph represents average number of infiltrating cells around blood vessel per section in the human motor cortex of normal controls (black column) and ALS with TDP-43 pathology (white column). BV, blood vessel. *p < 0.05, ***p < 0.0001. Scale bar: af, h, i, km = 5 μm. f, i = 10 μm
Fig. 7
Fig. 7
Evidence of infiltrating monocyte contribution in motor cortex of patients with TDP-43 pathology. Images of layer 5 of the primary motor cortex (Brodmann area 4) in normal controls and postmortem ALS cases. a, b Betz cells look healthy with normal apical dendrites in normal controls, and infiltrating monocytes (CCR2+) are not detected. cf Numerous CCR2+ infiltrating monocytes are present in the motor cortex of patients with TDP-43 pathology. c, d Infiltrating monocytes are found in close proximity to degenerating Betz cells and within or near blood vessels (arrowheads). Insets enlarged within the panel. e, f A representative image showing an infiltrating monocyte in the brain parenchyma (arrowheads). Insets enlarged within the panel. g, h A representative image of motor cortex from patients with TDP-43 pathology shows infiltrating monocytes (CCR2+; arrowhead) that lack TMEM119 expression (asterisk) within the blood vessel. Inset is enlarged to the right. Scale bar = 20 μm
Fig. 8
Fig. 8
Neuronal expression of MCP1 increases in ALS cases with TDP-43 and ALS-FTLD cases with TDP-43 pathology. Images of layer 5 of the primary motor cortex (Brodmann area 4) isolated from normal controls and postmortem ALS cases. a, b Normal controls express low levels of MCP1 and Betz cells (Map 2+) have healthy apical dendrites (arrows). c, d ALS cases with TDP-43 pathology have smaller Betz cells or degenerating Betz cells (asterisks) that express MCP1 and they are surrounded by activated microglia (Iba1+, arrowhead). e, f ALS-FTLD with TDP-43 pathology cases have Betz cells expressing high levels of MCP1 (asterisk), and there are numerous degenerating apical dendrites (arrows) with activated microglia (arrowheads) near degenerating apical dendrites. Scale bar = 20 μm

Similar articles

Cited by

References

    1. Bruijn LI, Miller TM, Cleveland DW. Unraveling the mechanisms involved in motor neuron degeneration in ALS. Annu Rev Neurosci. 2004;27:723–749. doi: 10.1146/annurev.neuro.27.070203.144244. - DOI - PubMed
    1. Brown RH, Jr, Robberecht W. Amyotrophic lateral sclerosis: pathogenesis. Semin Neurol. 2001;21:131–139. doi: 10.1055/s-2001-15260. - DOI - PubMed
    1. Alstermark B, Isa T. Circuits for skilled reaching and grasping. Annu Rev Neurosci. 2012;35:559–578. doi: 10.1146/annurev-neuro-062111-150527. - DOI - PubMed
    1. Geevasinga N, Menon P, Ozdinler PH, Kiernan MC, Vucic S. Pathophysiological and diagnostic implications of cortical dysfunction in ALS. Nat Rev Neurol. 2016;12:651–661. doi: 10.1038/nrneurol.2016.140. - DOI - PubMed
    1. Lemon RN. Descending pathways in motor control. Annu Rev Neurosci. 2008;31:195–218. doi: 10.1146/annurev.neuro.31.060407.125547. - DOI - PubMed