. 2019 Dec 23;58(1):e00963-19.
doi: 10.1128/JCM.00963-19. Print 2019 Dec 23.

Metagenomic Nanopore Sequencing of Influenza Virus Direct from Clinical Respiratory Samples

Affiliations

Metagenomic Nanopore Sequencing of Influenza Virus Direct from Clinical Respiratory Samples

Kuiama Lewandowski et al. J Clin Microbiol. .

Abstract

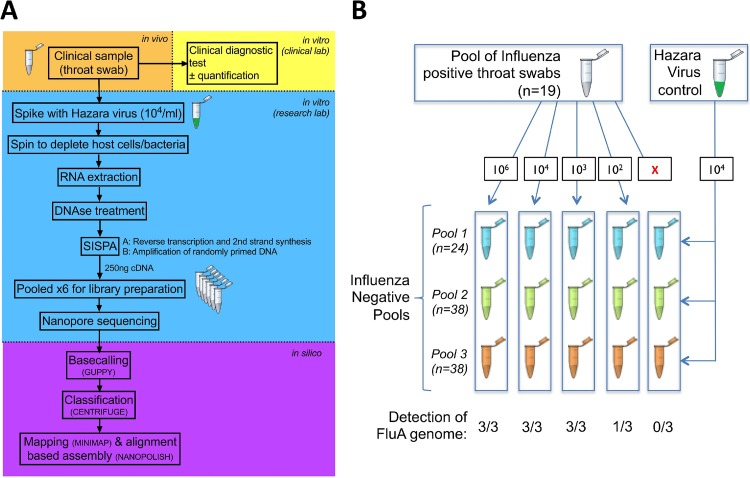
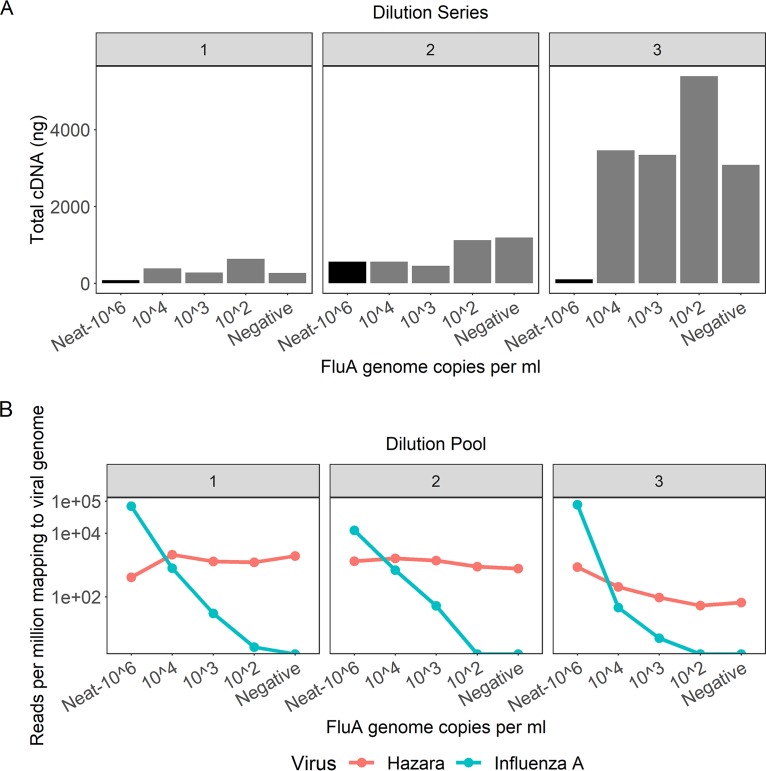
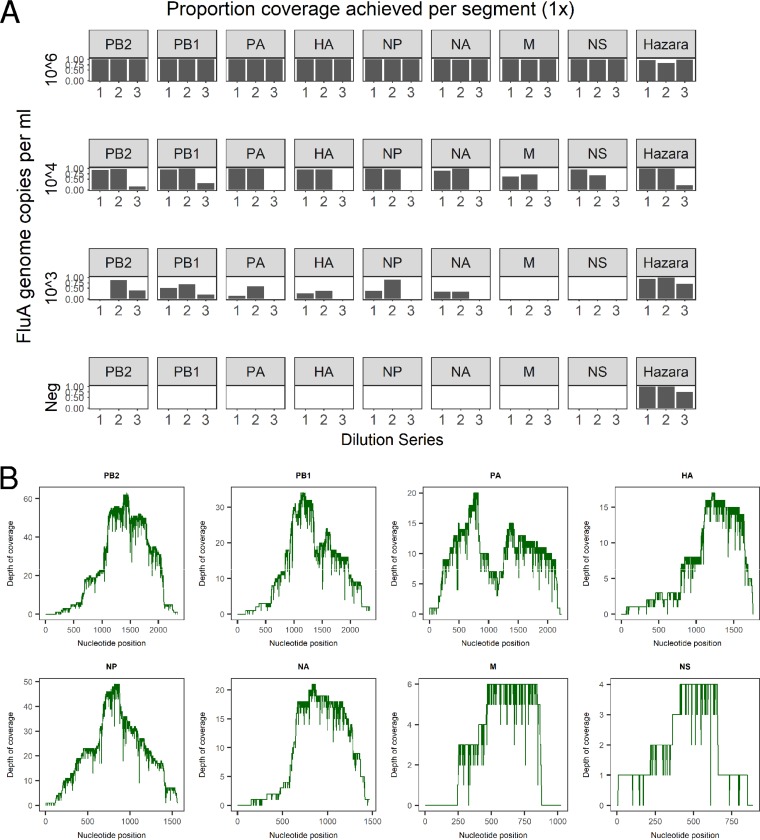
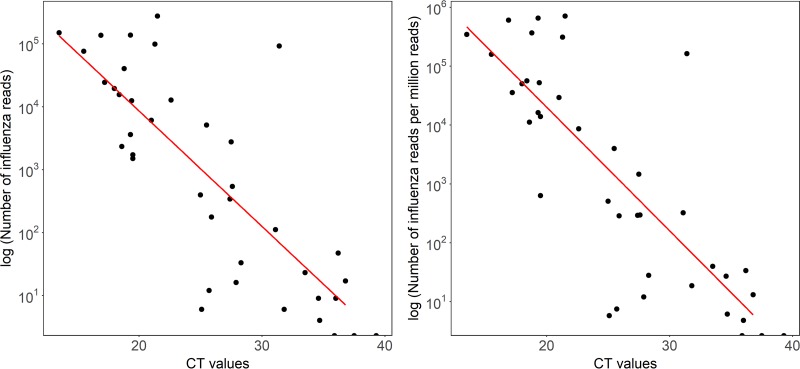
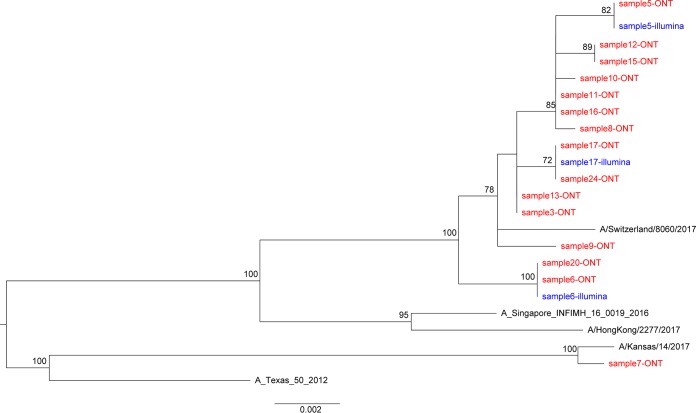
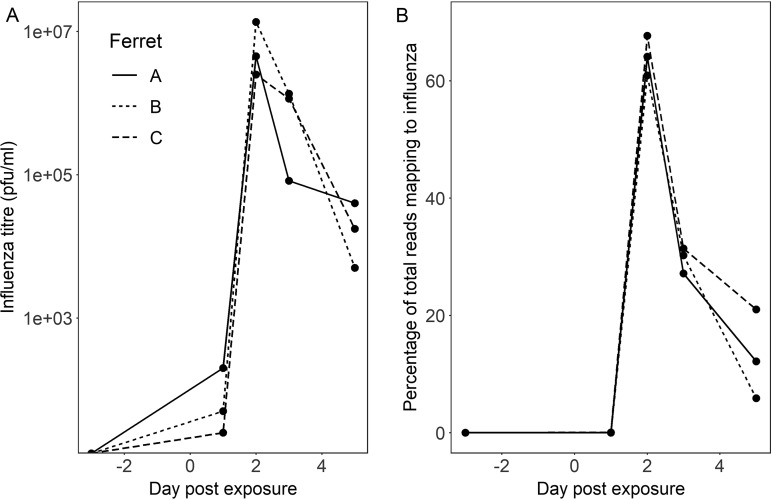
Influenza is a major global public health threat as a result of its highly pathogenic variants, large zoonotic reservoir, and pandemic potential. Metagenomic viral sequencing offers the potential for a diagnostic test for influenza virus which also provides insights on transmission, evolution, and drug resistance and simultaneously detects other viruses. We therefore set out to apply the Oxford Nanopore Technologies sequencing method to metagenomic sequencing of respiratory samples. We generated influenza virus reads down to a limit of detection of 102 to 103 genome copies/ml in pooled samples, observing a strong relationship between the viral titer and the proportion of influenza virus reads (P = 4.7 × 10⁻⁵). Applying our methods to clinical throat swabs, we generated influenza virus reads for 27/27 samples with mid-to-high viral titers (cycle threshold [CT ] values, <30) and 6/13 samples with low viral titers (CT values, 30 to 40). No false-positive reads were generated from 10 influenza virus-negative samples. Thus, Nanopore sequencing operated with 83% sensitivity (95% confidence interval [CI], 67 to 93%) and 100% specificity (95% CI, 69 to 100%) compared to the current diagnostic standard. Coverage of full-length virus was dependent on sample composition, being negatively influenced by increased host and bacterial reads. However, at high influenza virus titers, we were able to reconstruct >99% complete sequences for all eight gene segments. We also detected a human coronavirus coinfection in one clinical sample. While further optimization is required to improve sensitivity, this approach shows promise for the Nanopore platform to be used in the diagnosis and genetic analysis of influenza virus and other respiratory viruses.

Keywords: DNA sequencing; Nanopore; diagnosis; diagnostics; epidemiology; influenza; metagenomic; metagenomics; molecular epidemiology; sequencing.


Figures

FIG 1
FIG 1
Schematic to show processing protocol through clinical and research pipelines for influenza diagnosis. (A) Clinical sample collection (orange), clinical diagnostic testing (yellow), sample processing and sequencing using Oxford Nanopore Technologies (blue), and processing of sequence data (purple). (B) Outline of pooled influenza virus-positive samples into an influenza virus-negative background to generate various titers of influenza virus (from 0 to 106 genome copies/ml), undertaken in triplicate, and spiked with a standard titer of Hazara virus control at 104 genome copies/ml. FluA, influenza A virus.
FIG 2
FIG 2
Characteristics of three pools of influenza virus-negative throat swabs and Nanopore sequence results following spiking with influenza A virus. (A) Total concentration of cDNA produced per pooled sample following amplification by the SISPA reaction, grouped by dilution series. The 106 genome copies/ml sample in each pool is the original, undiluted material, represented by the black bars. Samples diluted to influenza virus titers of 104, 103, and 102 contain more cDNA due to higher background material (bacterial/human) present in the diluent. Dilution series 1 and 2 contain comparable amounts of background material; dilution series 3 contains substantially more background. (B) Viral reads generated by Nanopore sequencing of samples with different titers of influenza A virus and a consistent titer of Hazara virus (104 genome copies/ml). Graphs show reads per million of total reads mapping to influenza A or Hazara virus genomes, across the three individual dilution series. Note the logarithmic scale on the y axis.
FIG 3
FIG 3
Coverage of influenza virus and Hazara virus genome segments achieved by Nanopore sequencing from pooled samples (A) Data from three dilution series of pooled influenza virus-positive samples, diluted with three separate negative-sample pools to generate different titers of influenza virus. Each individual dilution was spiked with Hazara virus at 104 genome copies/ml. The proportion of genome covered at 1× depth is shown for each of the eight influenza virus genome segments (encoding PB2 [polymerase subunit 2], PB1 [polymerase subunit 1], PA [polymerase acidic protein], HA [hemagglutinin], NP [nucleocapsid protein], NA [neuraminidase], M [matrix protein], and NS [nonstructural protein]) across the three dilution series. For simplicity, the coverage of the Hazara virus genome is plotted as the total of all three genome segments. (B) Representative coverage plots of influenza A virus genome segments from the dilution series 1 sample at 104 influenza virus copies per ml.
FIG 4
FIG 4
Total and proportion of influenza virus reads derived by Nanopore sequencing of individual samples across a range of CT values. CT values were derived by testing using the GeneXpert (Cepheid) assay in a clinical diagnostic laboratory. Left, correlation between CT value and total number of influenza virus reads generated. R2 = 0.604, P = 2.47e−08. Right, correlation between CT value and number of influenza virus reads per million reads. R2 = 0.623, P = 1.07e−08.
FIG 5
FIG 5
Phylogenetic trees of consensus influenza virus HA gene derived by Nanopore and Illumina sequencing. A maximum likelihood tree was generated using 500 bootstrap replicates in the RAxML v8.2.10 software. Bootstrap values of >70 are shown. The scale bar shows the substitutions per site. Red and blue indicate sequences derived from Oxford Nanopore Technology (ONT) and Illumina sequencing, respectively. Reference sequences are shown in black.
FIG 6
FIG 6
Time course experiment showing influenza A virus infection in three laboratory ferrets. Infection was introduced at day 0. Samples were collected 3 days prior to infection and at days 1, 3 and 5 postinfection. (A and B) Influenza virus titer (log scale) (A) and proportion of total Nanopore reads (linear scale) (B) mapping to influenza A virus from metagenomic sequencing of ferret nasal washes taken before and after influenza virus challenge.

References

    1. Krammer F, Smith GJD, Fouchier RAM, Peiris M, Kedzierska K, Doherty PC, Palese P, Shaw ML, Treanor J, Webster RG, García-Sastre A. 2018. Influenza. Nat Rev Dis Primers 4:3. doi:10.1038/s41572-018-0002-y. - DOI - PMC - PubMed
    1. Joseph U, Su YCF, Vijaykrishna D, Smith G. 2017. The ecology and adaptive evolution of influenza A interspecies transmission. Influenza Other Respir Viruses 11:74–84. doi:10.1111/irv.12412. - DOI - PMC - PubMed
    1. Humphreys M. 2018. The influenza of 1918: evolutionary perspectives in a historical context. Evol Med Public Health 2018:219–229. doi:10.1093/emph/eoy024. - DOI - PMC - PubMed
    1. Smith GJD, Vijaykrishna D, Bahl J, Lycett SJ, Worobey M, Pybus OG, Ma SK, Cheung CL, Raghwani J, Bhatt S, Peiris JSM, Guan Y, Rambaut A. 2009. Origins and evolutionary genomics of the 2009 swine-origin H1N1 influenza A epidemic. Nature 459:1122–1125. doi:10.1038/nature08182. - DOI - PubMed
    1. Sutton TC. 2018. The pandemic threat of emerging H5 and H7 avian influenza viruses. Viruses 10:E461. doi:10.3390/v10090461. - DOI - PMC - PubMed

Publication types