. 2019 Oct 24:2:105.
doi: 10.1038/s41746-019-0180-3. eCollection 2019.

How the weather affects the pain of citizen scientists using a smartphone app

Affiliations

How the weather affects the pain of citizen scientists using a smartphone app

William G Dixon et al. NPJ Digit Med. .

Abstract

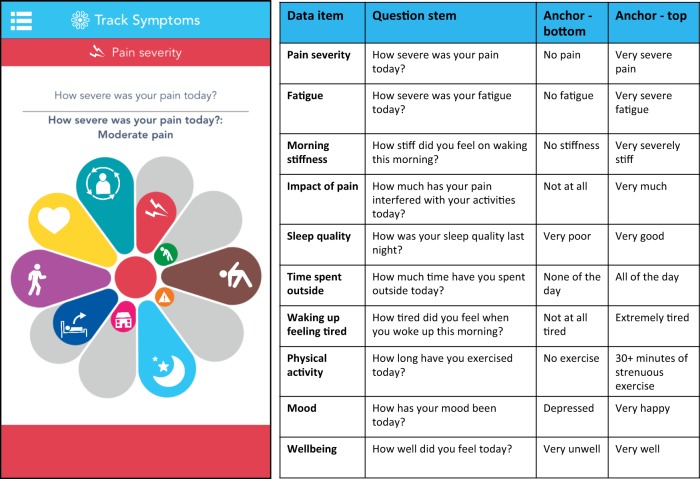
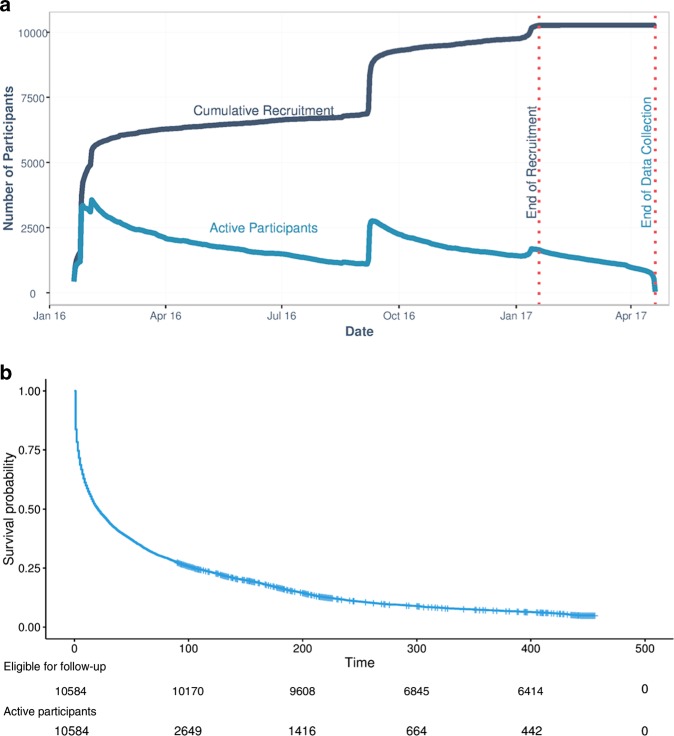
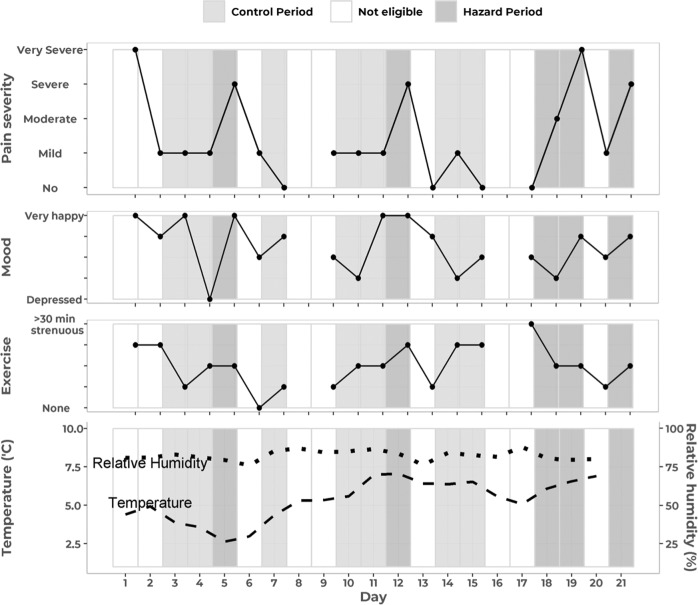
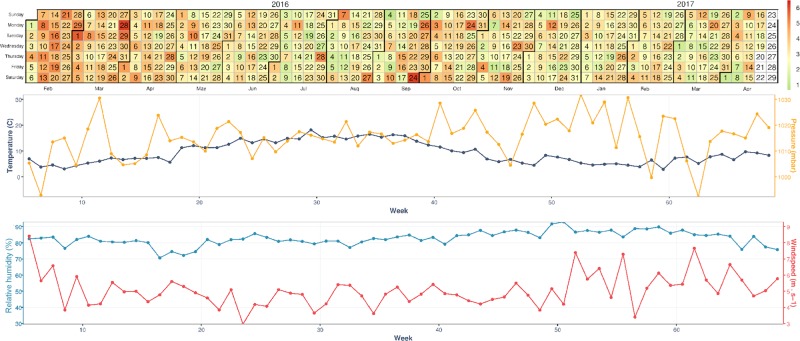
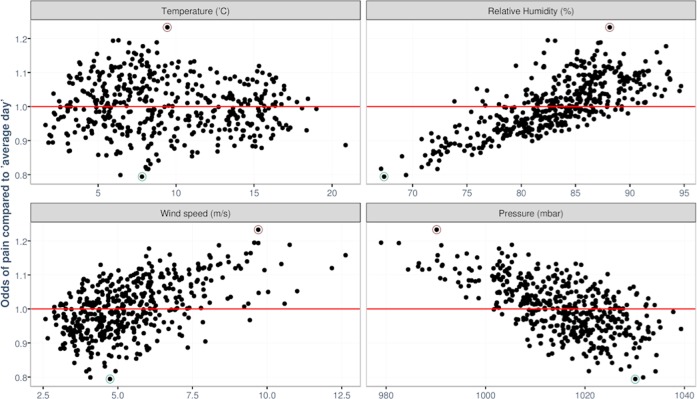
Patients with chronic pain commonly believe their pain is related to the weather. Scientific evidence to support their beliefs is inconclusive, in part due to difficulties in getting a large dataset of patients frequently recording their pain symptoms during a variety of weather conditions. Smartphones allow the opportunity to collect data to overcome these difficulties. Our study Cloudy with a Chance of Pain analysed daily data from 2658 patients collected over a 15-month period. The analysis demonstrated significant yet modest relationships between pain and relative humidity, pressure and wind speed, with correlations remaining even when accounting for mood and physical activity. This research highlights how citizen-science experiments can collect large datasets on real-world populations to address long-standing health questions. These results will act as a starting point for a future system for patients to better manage their health through pain forecasts.

Keywords: Chronic pain; Epidemiology; Risk factors.


Conflict of interest statement

Competing interestsW.G.D. has received consultancy fees from Bayer Pharmaceuticals and Google, unrelated to this study. B.J. and B.H. are co-founders of uMotif. All other authors declare no competing interests.

Figures

Fig. 1
Fig. 1
User interface of the study app (uMotif, London). Each colored segment represents one of the ten data items. Participants report their symptoms on a five-point scale by dragging the segment from the center outwards
Fig. 2
Fig. 2
Recruitment and retention. a Cumulative recruitment and number of active participants through time. The blue line represents the cumulative number of participants with a completed baseline questionnaire and at least one pain score submitted. The red line represents the current number of active participants (i.e. those who have submitted their first but not yet their last pain score in the study period). b Retention through time. The graph represents the retention of active participants through time as a survival probability from the day of their recruitment. Participants were censored when they were no longer eligible for follow-up. Eligible follow-up time ranged from 90 days (for those recruited on 20 January 2017) to 456 days (for those recruited on 20 January 2016)
Fig. 3
Fig. 3
Example participant timeline of 21 days, showing participant-reported items (here, pain severity, mood, and exercise) and weather data (here, temperature and relative humidity). Pain events with their associated hazard periods (dark grey) occur when pain severity increases by two or more ordinal categories between consecutive days (e.g. from Day 4 to Day 5). Control periods (light gray) occur on days that were eligible to be a pain event, but where pain did not increase by two or more ordinal categories. Days where there was no recorded pain on the preceding day, or where the preceding day’s pain was severe or very severe (and could thus not increase by two or more categories), were not eligible to be pain-event days or control days. The case-crossover analysis compared the weather on pain-event days to weather on control days within a risk set of a calendar month
Fig. 4
Fig. 4
The proportion of eligible active participants reporting a pain event during the study period, aligned with average UK weather data from February 2016 to April 2017. Heat map colors indicate the percentage of participants reporting a pain event on that day, ranging from 1–6% participants. The denominator per day is the number of participants who reported their pain on the day of interest and the prior day, irrespective of the level of pain on the prior day and thus their eligibility for a pain event
Fig. 5
Fig. 5
Estimated odds of a painful day for all weather days experienced during the 15 months. Estimated odds of a painful day are plotted as the odds ratio for each day compared to the average weather day in this period (temperature = 9.3 °C, relative humidity = 83%, wind speed = 4 m s–1 and pressure = 1013 mbar). Estimated odds are calculated from the output of the multivariable regression analysis. The day associated with the highest estimated odds of a pain event had a temperature of 9 °C, relative humidity 88%, wind speed 9.5 m s–1 and pressure 988 mbar. The day associated with the lowest estimated odds of a pain event was when the temperature was 7 °C, relative humidity was 67%, wind speed 4.5 m s−1 and pressure 1030 mbar

References

    1. Hippocrates. On Airs, Waters and Places. http://classics.mit.edu//Hippocrates/airwatpl.html. (400 B.C.E.).
    1. Hagglund KJ, et al. Weather, beliefs about weather, and disease severity among patients with fibromyalgia. Arthritis Rheum. 1994;7:130–135. doi: 10.1002/art.1790070306. - DOI - PubMed
    1. Timmermans, E. J. et al. Self-perceived weather sensitivity and joint pain in older people with osteoarthritis in six European countries: Results from the European Project on OSteoArthritis (EPOSA). BMC Musculoskelet. Disord., 10.1186/1471-2474-15-66 (2014). - PMC - PubMed
    1. Smedslund G, Hagen KB. Does rain really cause pain? A systematic review of the associations between weather factors and severity of pain in people with rheumatoid arthritis. Eur. J. Pain. 2011;15:5–10. doi: 10.1016/j.ejpain.2010.05.003. - DOI - PubMed
    1. Aikman H. The association between arthritis and the weather. Int. J. Biometeorol. 1997;40:192–199. doi: 10.1007/s004840050041. - DOI - PubMed