. 2019 Oct 24:2:389.
doi: 10.1038/s42003-019-0624-y. eCollection 2019.

Adipocyte browning and resistance to obesity in mice is induced by expression of ATF3

Affiliations

Adipocyte browning and resistance to obesity in mice is induced by expression of ATF3

Ching-Feng Cheng et al. Commun Biol. .

Abstract

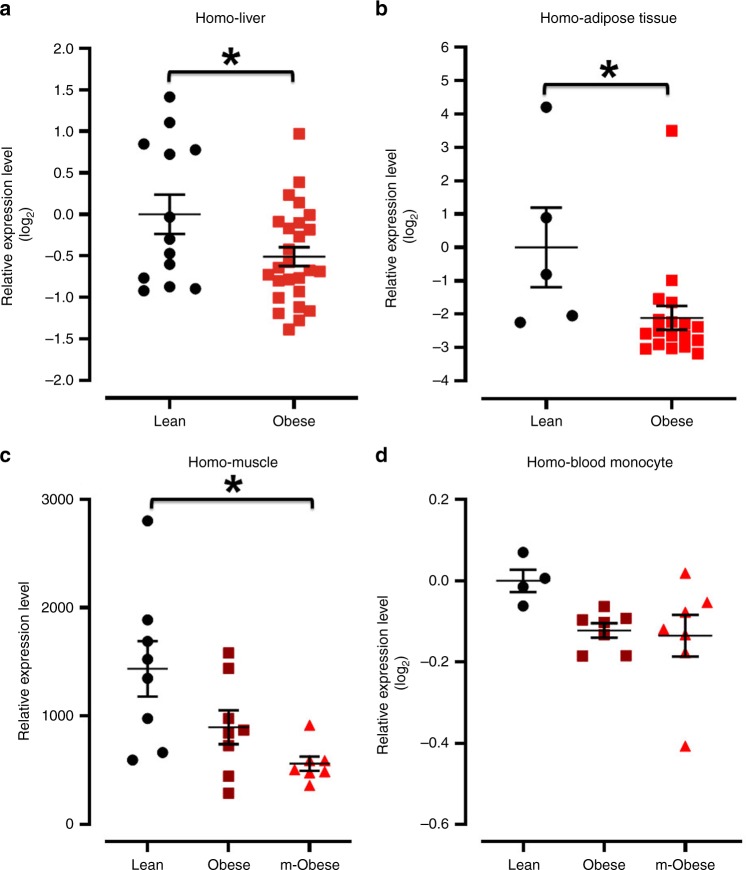
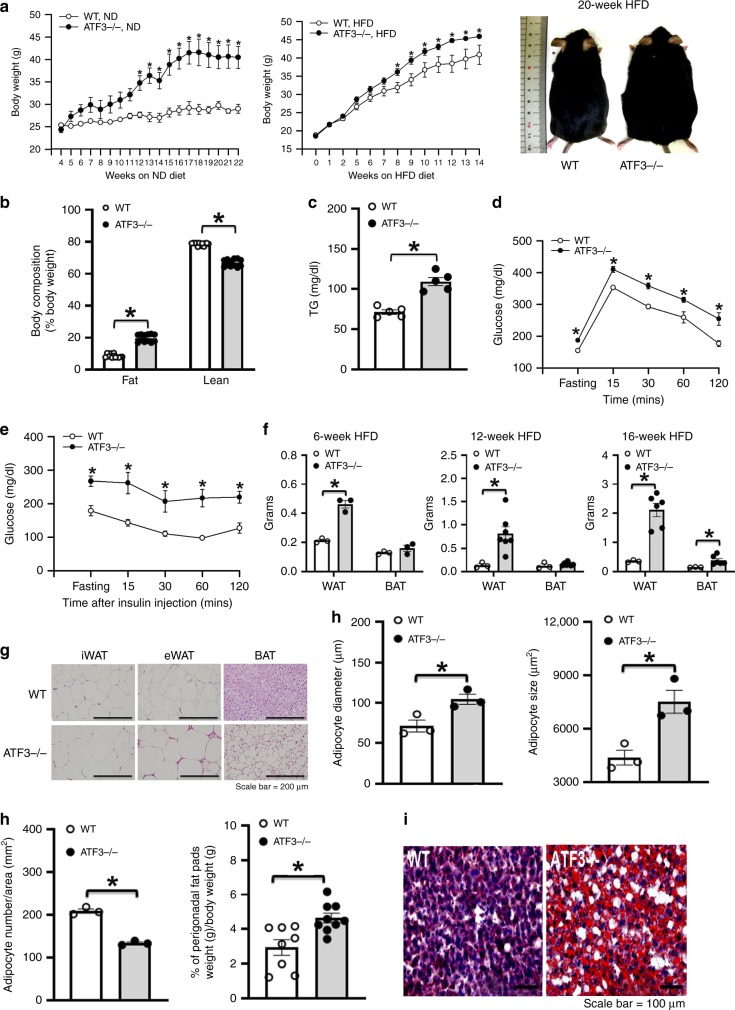
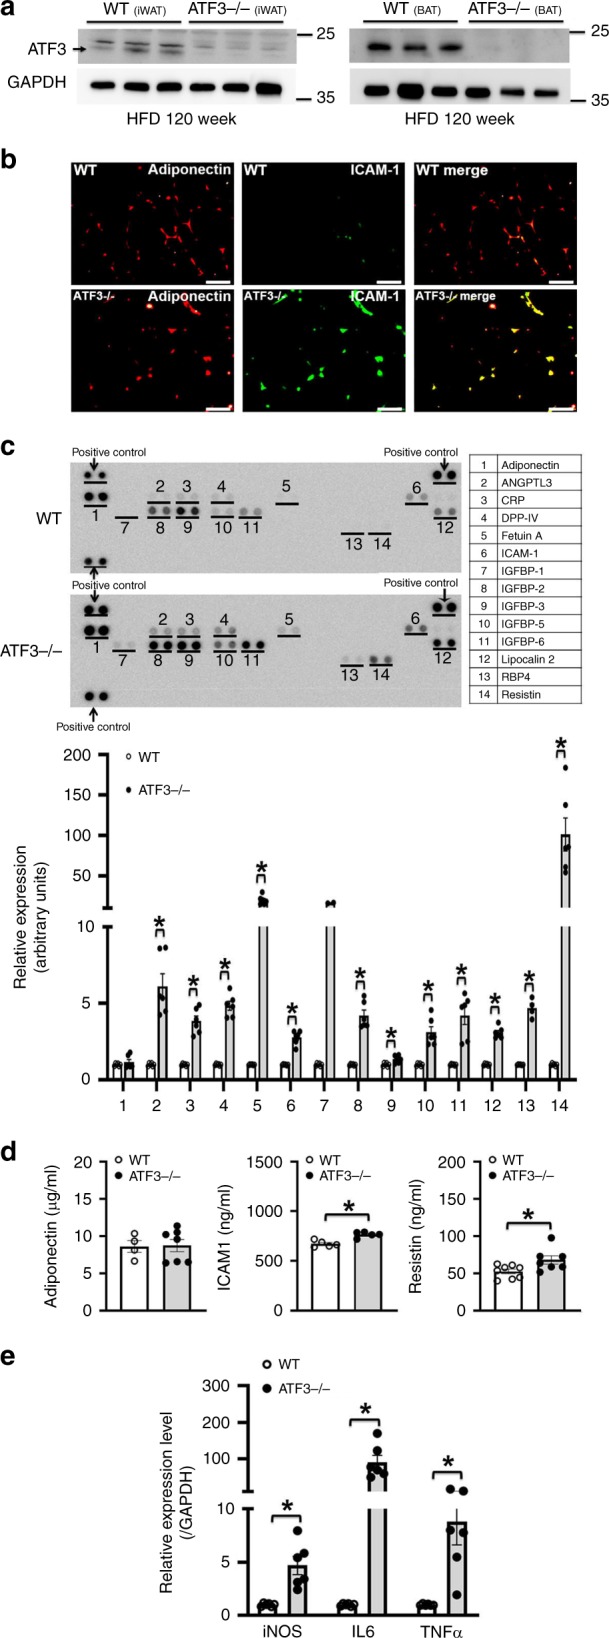
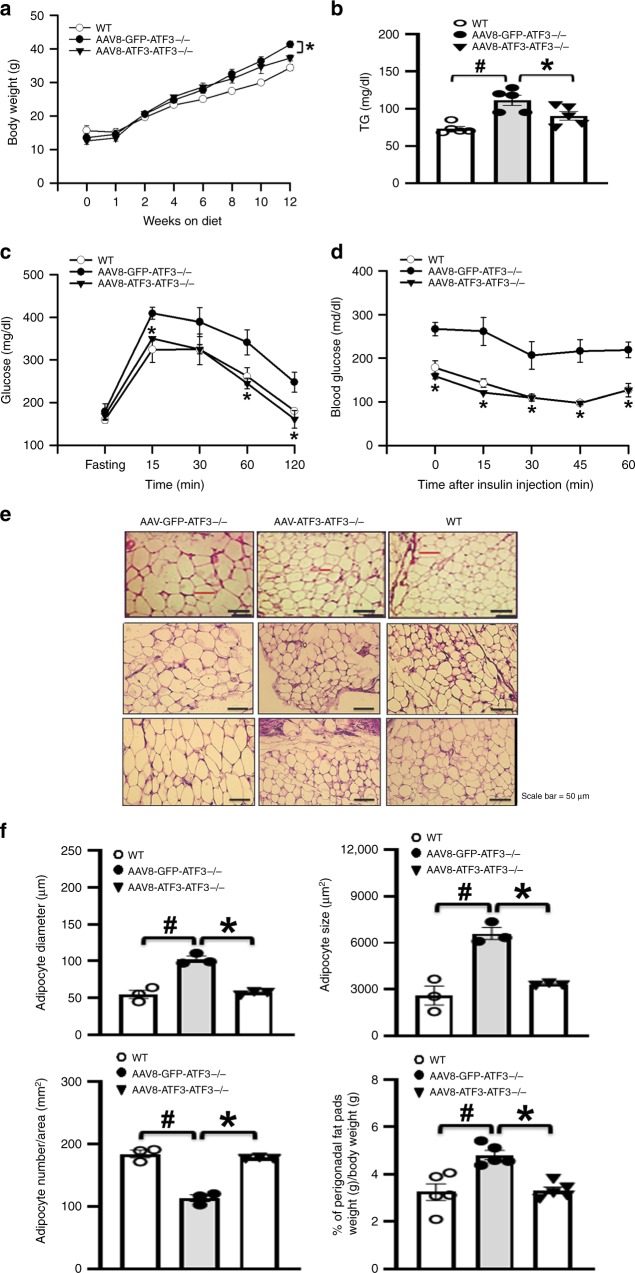
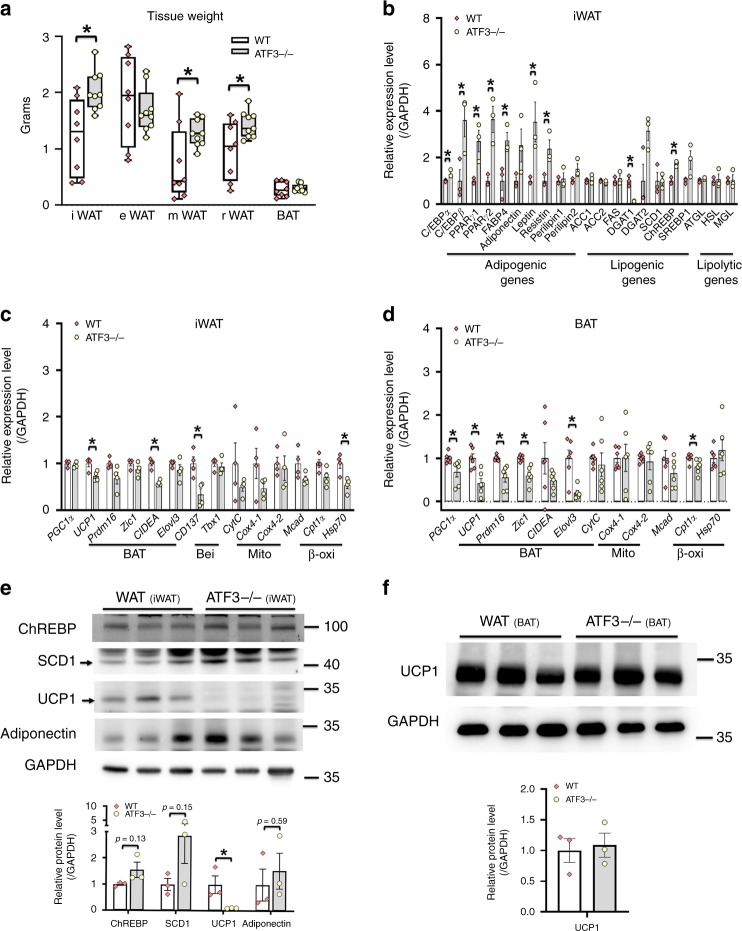
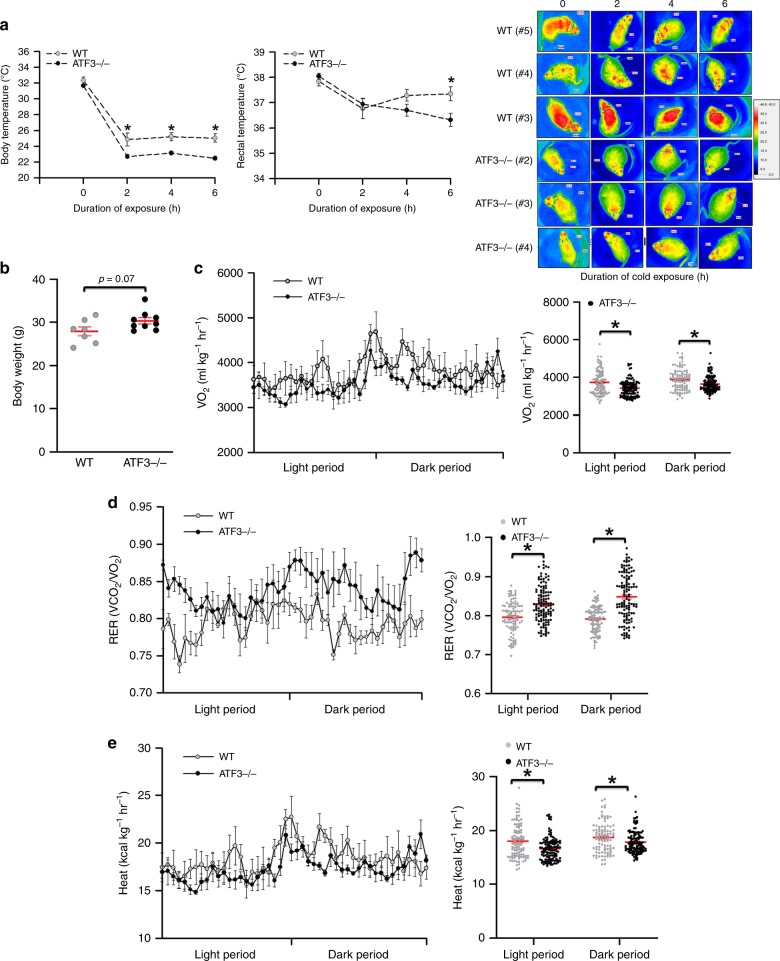
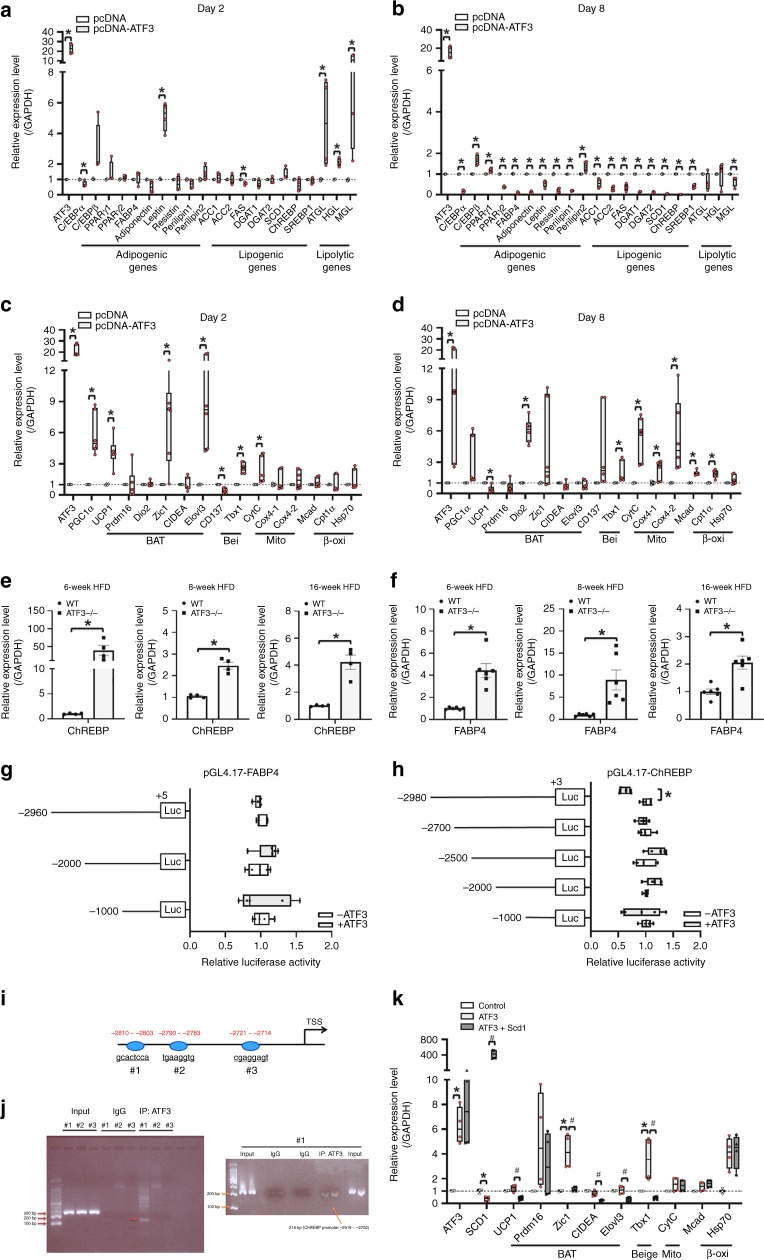
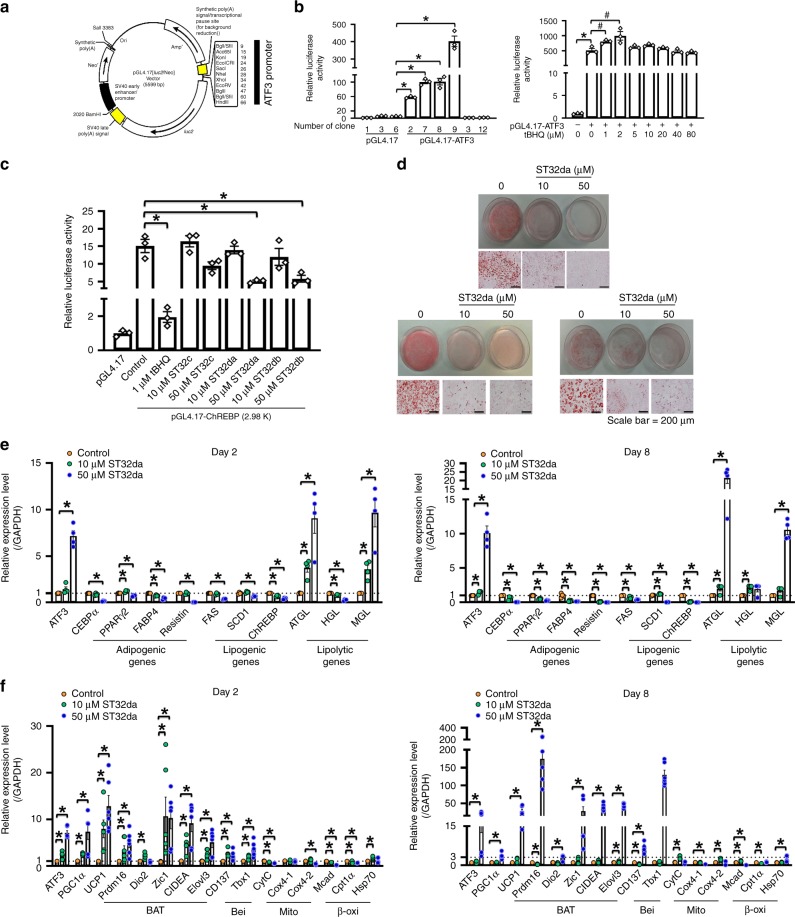
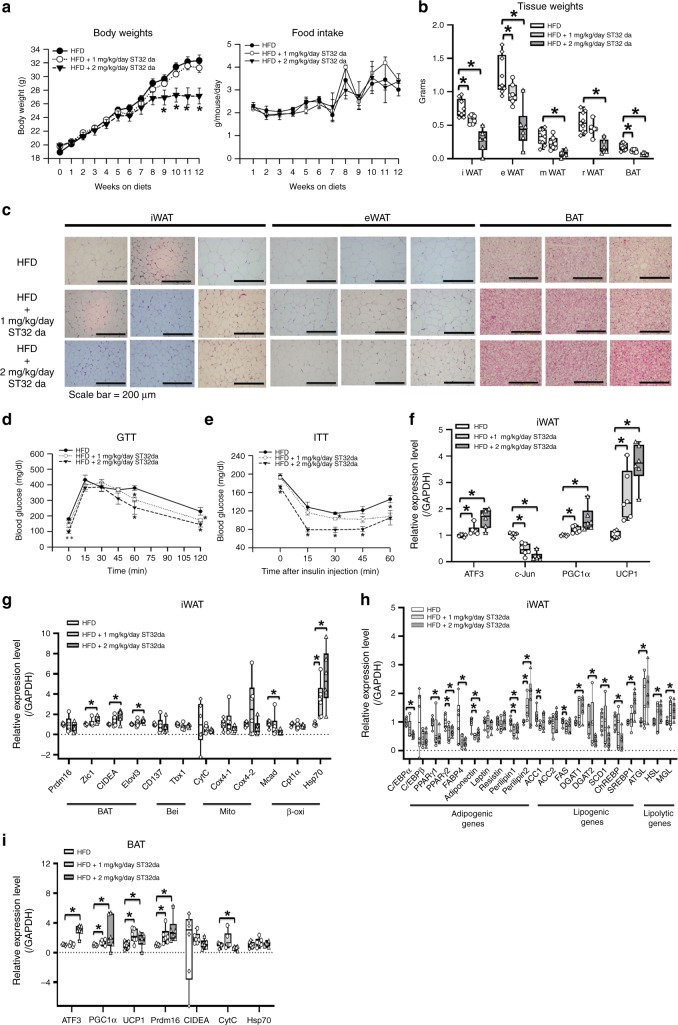
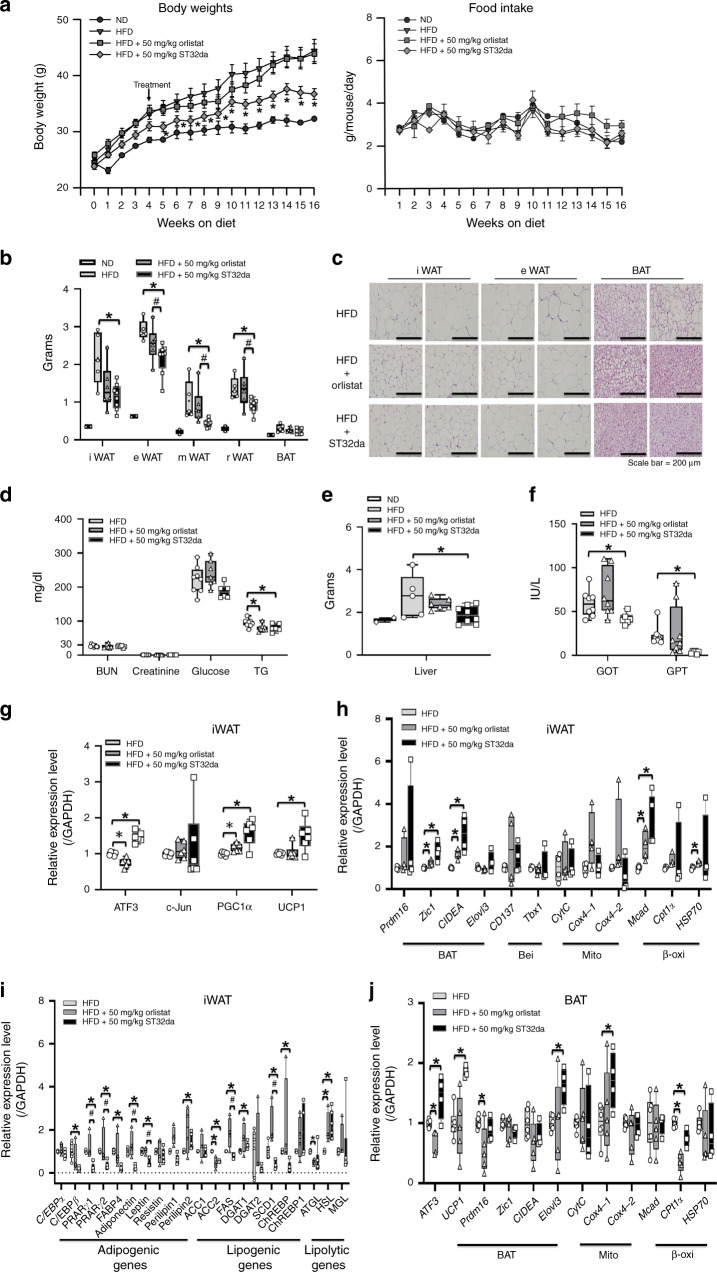
Billions of people have obesity-related metabolic syndromes such as diabetes and hyperlipidemia. Promoting the browning of white adipose tissue has been suggested as a potential strategy, but a drug still needs to be identified. Here, genetic deletion of activating transcription factor 3 (ATF3-/- ) in mice under a high-fat diet (HFD) resulted in obesity and insulin resistance, which was abrogated by virus-mediated ATF3 restoration. ST32da, a synthetic ATF3 inducer isolated from Salvia miltiorrhiza, promoted ATF3 expression to downregulate adipokine genes and induce adipocyte browning by suppressing the carbohydrate-responsive element-binding protein-stearoyl-CoA desaturase-1 axis. Furthermore, ST32da increased white adipose tissue browning and reduced lipogenesis in HFD-induced obese mice. The anti-obesity efficacy of oral ST32da administration was similar to that of the clinical drug orlistat. Our study identified the ATF3 inducer ST32da as a promising therapeutic drug for treating diet-induced obesity and related metabolic disorders.

Keywords: Diabetes; Drug discovery; Medical research; Obesity; Transcription.


Conflict of interest statement

Competing interestsThe authors declare no competing interests.

Figures

Fig. 1
Fig. 1
Analysis of ATF3 expression level among liver, adipose tissue, muscle and blood monocytes from lean, obese and morbidly obese patients by NCBI GEO DataSets. ad ATF3 expression level in different organs. a Liver. b Adipose tissue. c Muscle. d Blood monocytes. For a, Lean (n = 13), Obese (n = 26). For b, Lean (n = 5), Obese (n = 18). For c, ControlLean (n = 8), Obese (n = 8), m-Obese (n = 7). For d, Lean (n = 4), Obese (n = 7), m-Obese (n = 7). Data are mean ± SEM. and *p < 0.05 compared to control group
Fig. 2
Fig. 2
Loss of ATF3 in mice aggravated high fat diet (HFD)-induced obesity and metabolic dysfunction. ATF3 gene-deleted mice (ATF3−/−) and their wild-type littermates (WT) fed a normal diet (ND) or a HFD for 22 or 14 weeks, respectively. Measurement was performed after 12 weeks of HFD feeding for both groups. a Body weight of wild-type (WT) and ATF3−/− mice fed a normal diet (ND) or HFD and body image. b Body composition of wild-type and ATF3−/− mice. Proportion of body fat and lean mass as a percentage of their respective body weights. c Serum triglycerides (TG) level. d Glucose tolerance test. e Insulin tolerance test. f White adipose tissue (WAT) and brown adipose tissue (BAT) fat-pad weights. g Representative H&E staining of inguinal WAT (iWAT), epididymal WAT (eWAT), and BAT. h Adipocyte diameter (µm), size (μm2), number per area (mm2), and perigonadal fat pad weight per body weight (g). i Oil-red O staining in liver. For a, n = 3 per group (ND); wild-type, HFD (n = 4), ATF3−/−, HFD (n = 9). For b, n = 12 per group. For c, n = 5 per group. For d, wild-type (n = 4), ATF3−/− (n = 5). For e, n = 3 per group. For f, wild-type (n= 3), ATF3−/− (n= 3 in 6-week HFD; n= 7 in 12-week HFD; n= 6 in 16-week HFD). For gi, n = 3 per group, except wild-type (n = 8), ATF3−/− (n = 9) in % of perigonadal fat pads weight/body weight. Scale bar for images g: 200 µm; i: 100 µm. Data are mean ± SEM. and *p < 0.05 compared to wild-type
Fig. 3
Fig. 3
Loss of ATF3 aggravated the expression of inflammation-related genes in HFD-induced obese mice. a ATF3 protein level in iWAT and BAT of wild-type and ATF3−/− mice after HFD feeding for 12 weeks. b Representative immunofluorescence images of adiponectin (red IF) and ICAM-1 (green IF) in wild-type and ATF3−/− mice. Yellow scale bar indicated the size of adipocyte tissues. c Serum protein levels of adipokine and inflammation-related genes in wild-type and ATF3−/− mice after HFD feeding for 8 weeks by adipokine assays; Gel-Pro Analyzer software was used for densitometry of blots. d Serum protein level of adiponectin, ICAM-1 and resistin by ELISA assays in wild-type and ATF3−/−mice after HFD feeding for 8 weeks. e Quantified real-time PCR analysis of mRNA levels of iNOS, IL-6, and TNFα in livers of wild-type and ATF3−/− mice. For ac, n = 3 per group. For d, wild-type (n = 4 in adiponectin; n = 5 in ICAM1; n = 8 in resistin), ATF3−/− (n = 7 in adiponectin; n = 5 in ICAM1; n = 7 in resistin). For e, n = 6 per group. Scale bar for image b: 50 µm. Data are mean ± SEM; *p < 0.05 compared to wild-type
Fig. 4
Fig. 4
Adeno-associated virus 8 (AAV8)-mediated expression of ATF3 reversed metabolic dysfunction in ATF3−/− mice. Analysis of mice fed an HFD for 12 weeks: untreated wild-type mice, AAV8-GFP–treated ATF3−/− mice (AAV8-GFP- ATF3−/−), or AAV8-ATF3-treated ATF3−/− mice (AAV8-ATF3-ATF3−/−). a Body weights. b Serum TG level. c Glucose tolerance test. d Insulin tolerance test. e Representative H&E staining of epididymal WAT. f Adipocyte diameter (μm), size (μm2), number per area (mm2), and perigonadal fat pad weight per body weight (g). For a, n = 3 per group. For b, n = 5 per group. For ce, n = 3 per group. For f, n = 3 per group, except wild-type (n = 5), AAV8-GFP-ATF3−/− (n = 5), AAV8-ATF3-ATF3−/− (n = 5) in % of perigonadal fat pads weight/body weight. Scale bar for image e: 50 µm. Data are mean ± SEM; #p < 0.05 compared to wild-type. *p < 0.05 AAV8-GFP-ATF3−/ vs. AAV8-ATF3-ATF3−/
Fig. 5
Fig. 5
ATF3−/− mice showed dysregulated WAT/BAT balance. Analysis of ATF3−/− and wild-type mice after 12 weeks of HFD feeding. a Weights of brown adipose tissue (BAT) and white adipose tissue (WAT) in individual depots including inguinal WAT (iWAT), epididymal WAT (eWAT), mesenteric WAT (mWAT), and retroperitoneal WAT (rWAT) fat pads. b Analysis of gene expression of adipogenic, lipogenic, and lipolytic genes in iWAT. c Analysis of gene expression of brown (BAT), beige (Bei), mitochondria (Mito), and β-oxidation (β-oxi) markers in iWAT. d Analysis of expression of brown/mitochondria/β-oxidation markers in BAT. e Protein levels of ChREBP, SCD1, UCP1 and adiponectin in iWAT. f Protein level of UCP1 in BAT. For a, wild-type (n= 8), ATF3−/− (n= 9). For b, n = 3 per group. For c, n = 4 per group. For d, n = 6 per group. For e, f, n = 3 per group. Data are mean ± SEM; *p < 0.05 compared to wild-type
Fig. 6
Fig. 6
ATF3−/− mice showed impaired energy metabolism and thermoregulation. a Body and rectal temperature during acute cold exposure. b Body weight after 9 weeks of HFD feeding. c Measurement of oxygen consumption levels, d respiratory exchange ratio (RER), and e energy expenditure in ATF3−/− and wild-type mice after 9 weeks of HFD feeding. For a, wild-type (n= 6), ATF3−/− (n= 5). For b, wild-type (n= 7), ATF3−/− (n= 9). For ce, wild-type (n= 4), ATF3−/− (n= 5). Data are mean ± SEM; *p < 0.05 compared to wild-type
Fig. 7
Fig. 7
ATF3-overexpressing 3T3-L1 adipocytes showed suppression of lipogenesis/adipogenesis and activation of mitochondrial, brown or beige fat programs. a, b Real-time PCR analysis of mRNA levels of adipogenic, lipogenic, and lipolytic genes; c, d BAT, beige (Bei), mitochondria (Mito), and β-oxidation (β-oxi) genes after 2 and 8 days of differentiation in ATF3-overexpressing 3T3-L1 cells, normalized to GAPDH and relative to pcDNA control. e, f The expression level of ChREBPand FABP4 in iWAT of wild-type and ATF3−/− mice after 6, 8, and 16 weeks of HFD feeding. f The expression level of FABP4 in iWAT of wild-type and ATF3−/− mice after 6, 8, and 16 weeks of HFD feeding. g FABP4 promoter activity measured with or without overexpression of ATF3 in 3T3-L1 pre-adipocytes. h Overexpression of ATF3 repressed the ChREBP promoter activity of the p (−2980)/Luc reporter but not other reporters in 3T3-L1 pre-adipocytes. i The sequence of 3 potential binding sites for ATF3 in ChREBP promoter, including region #1 (–2810/–2803), region #2 (−2790/−2783) and region #3 (−2721/−2714) of the ChREBP locus. j Chromatin immunoprecipitation (ChIP) experiments with ATF3-specific antibody and primers to amplify region #1, region #2 and region #3 of the ChREBP locus, which contains one predicted ATF/CRE binding site in 3T3-L1 preadipocytes. k Real-time PCR analysis of gene levels of brown (BAT), mitochondrial (Mi), beige (Bei), and β-oxidation (β-oxi) genes in ATF3-overexpressing 3T3-L1 pre-adipocyte stable clone with or without Scd1 transfection. For a, b, n = 4 per group. For c, d, pc-DNA (n = 4), pc-DNA-ATF3 (n = 6). For e, n = 4 per group. For f, n = 6 per group. For g, h, n = 5 per group. For j, n = 3 per group. For k, control (n = 3), ATF3 (n = 4), ATF3 + SCD1 (n = 4). Data are mean ± SEM; *p < 0.05 compared to control. #p < 0.05 ATF3 vs. ATF3 + SCD1
Fig. 8
Fig. 8
Identification of ATF3 inducers and their functional assays. a Construction map of ATF3 promoter in pGL4.17 plasmid containing luciferase cassette. b Luciferase activity of stable clones of 3T3-L1 pre-adipocytes expressing pGL4.17-ATF3, with tBHQ as a positive control. c Luciferase activity measured in 3T3-L1 pre-adipocytes transfected with pGL4.17-ChREBP (p (−2980)/Luc reporter), then treated with ST32da or ST32db or ST32c. d Oil-red O staining in differentiated 3T3-L1 adipocytes with and without the ATF3 inducer ST32da (10 and 50 µM) for 8 days. e Real-time PCR analysis of mRNA levels of adipogenic, lipogenic, and lipolytic genes; f BAT, beige (Bei), mitochondria (Mito) and β-oxidation (β-oxi) genes with 2 and 8 days of ST32da treatment during 3T3-L1 differentiation normalized to GAPDH and relative to control. For bd, n = 3 per group. For e, n = 4 per group. For f, n = 6 per group. Data are mean ± SEM; *p < 0.05 compared to control. #p < 0.05 compared to pGL4.17-ATF3
Fig. 9
Fig. 9
ATF3 inducer, ST32da, protects against HFD-induced obesity and metabolic dysfunction by promoting browning in vivo. Analysis of wild-type mice fed a HFD for 12 weeks with or without i.p. ST32da 1 or 2 mg kg−1 per day. a Body weight and food intake. b Change in adipose tissue depot weight in BAT and WAT. c H&E staining of inguinal WAT, epididymal WAT, and BAT fat depots. d Glucose tolerance test (GTT). e Insulin tolerance test (ITT). f Real-time PCR analysis of mRNA levels of ATF3, c-Jun, PGC-1α and UCP1. g Real-time PCR analysis of mRNA levels of brown (BAT) and beige (Bei), mitochondria (Mito), and β-oxidation (β-oxi) genes in iWAT; h adipogenic, lipogenic, and lipolytic genes in iWAT; and i brown fat programs in BAT. For a, HFD (n= 10), HFD + 1 mg kg−1 per day ST32da (n= 8), HFD + 2 mg kg−1 per day ST32da (n= 8). For b, HFD (n= 9), HFD + 1 mg kg−1 per day ST32da (n= 7), HFD + 2 mg kg−1 per day ST32da (n= 6). For c, n = 3 per group. For d, e, HFD (n= 4), HFD + 1 mg kg−1 per day ST32da (n= 5), HFD + 2 mg kg−1 per day ST32da (n= 4). For f, g, n = 6 per group. For h, HFD (n= 6), HFD + 1 mg kg−1 per day ST32da (n= 5), HFD + 2 mg kg−1 per day ST32da (n= 6). For i, n = 6 per group. Data are mean ± SEM; *p < 0.05 compared to HFD group
Fig. 10
Fig. 10
Oral administration of ATF3 inducer, ST32da, is effective in preventing HFD-induced obesity. Analysis of wild-type mice fed a HFD for 16 weeks, either without or treated with oral orlistat (50 mg kg−1, three times per week) or oral ST32da (50 mg kg−1, three times per week). a Body weights and food intake. b Variation of adipose tissue depot weight in BAT and WAT. c H&E staining of inguinal WAT, epididymal WAT, and BAT fat depots. d Serum parameters. e Liver weight. f Liver function. g Real-time PCR analysis of mRNA levels of ATF3, c-Jun, PGC-1α and UCP1 in iWAT; h brown (BAT), beige (Bei), mitochondria (Mito), and β-oxidation (β-oxi) genes in iWAT; i adipogenic, lipogenic, and lipolytic genes in iWAT; j brown/mitochondria/β-oxidation markers in BAT. For a, ND (n = 2), HFD (n = 7), HFD + 50 mg kg−1 Orlistat (n = 7), HFD + 50 mg kg−1 ST32da (n = 7). For b, ND (n = 2), HFD (n = 5), HFD + 50 mg kg−1 Orlistat (n = 6), HFD + 50 mg kg−1 ST32da (n = 8). For c, n = 3 per group. For d, HFD (n = 8), HFD + 50 mg kg−1 Orlistat (n = 7), HFD + 50 mg kg−1 ST32da (n = 6). For e, ND (n = 2), HFD (n = 5), HFD + 50 mg kg−1 Orlistat (n = 6), HFD + 50 mg kg−1 ST32da (n = 8). For f, HFD (n = 8), HFD + 50 mg kg−1 Orlistat (n = 8), HFD + 50 mg kg−1 ST32da (n = 6). For g, n = 6 per group. For h, n = 4 per group. For i, HFD (n = 4), HFD + 50 mg kg−1 Orlistat (n = 4), HFD + 50 mg kg−1 ST32da (n = 5). For j, HFD (n = 6), HFD + 50 mg kg−1 Orlistat (n = 5), HFD + 50 mg kg−1 ST32da (n = 4). Data are mean ± SEM; *p < 0.05 compared to HFD; #p < 0.05 HFD + Orlistat vs. HFD + ST32da. GOT, glutamic oxaloacetic transaminase; GPT, glutamate pyruvate transaminase

References

    1. Tang QQ, Lane MD. Adipogenesis: from stem cell to adipocyte. Annu. Rev. Biochem. 2012;81:715–736. doi: 10.1146/annurev-biochem-052110-115718. - DOI - PubMed
    1. Kajimura S, Saito M. A new era in brown adipose tissue biology: molecular control of brown fat development and energy homeostasis. Annu Rev. Physiol. 2014;76:225–249. doi: 10.1146/annurev-physiol-021113-170252. - DOI - PMC - PubMed
    1. Rothwell NJ, Stock MJ. A role for brown adipose tissue in diet-induced thermogenesis. Nature. 1979;281:31–35. doi: 10.1038/281031a0. - DOI - PubMed
    1. Bachman ES, et al. betaAR signaling required for diet-induced thermogenesis and obesity resistance. Sci. (New Y., N. Y.) 2002;297:843–845. doi: 10.1126/science.1073160. - DOI - PubMed
    1. Feldmann HM, Golozoubova V, Cannon B, Nedergaard J. UCP1 ablation induces obesity and abolishes diet-induced thermogenesis in mice exempt from thermal stress by living at thermoneutrality. Cell Metab. 2009;9:203–209. doi: 10.1016/j.cmet.2008.12.014. - DOI - PubMed

Publication types

MeSH terms