. 2019 Oct 11;5(10):e02611.
doi: 10.1016/j.heliyon.2019.e02611. eCollection 2019 Oct.

High fat diet modulates the protein content of nutrient transporters in the small intestine of mice: possible involvement of PKA and PKC activity

Affiliations

High fat diet modulates the protein content of nutrient transporters in the small intestine of mice: possible involvement of PKA and PKC activity

Andressa Harumi Torelli Hijo et al. Heliyon. .

Abstract

Aims: Chronic high fat consumption has been shown to modulate nutrient transporter content in the intestine of obese mice; however it is unclear if this regulation occurs before or after the establishment of obesity, and the underlying molecular mechanism requires elucidation.

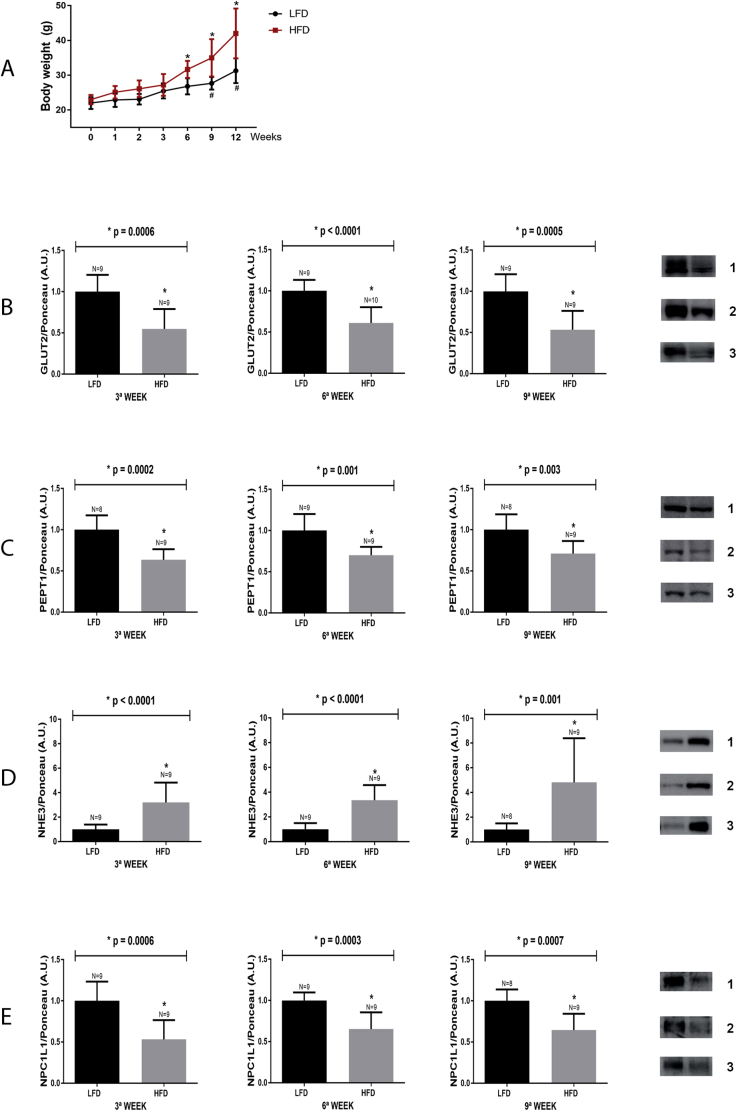
Main methods: Towards this goal C57BL/6 mice were fed a low fat diet (LFD) or high fat diet (HFD), and specific protein and gene expression levels were assessed for up to 12 weeks. Similar experiments were also performed with leptin-deficient (Ob/Ob) mice.

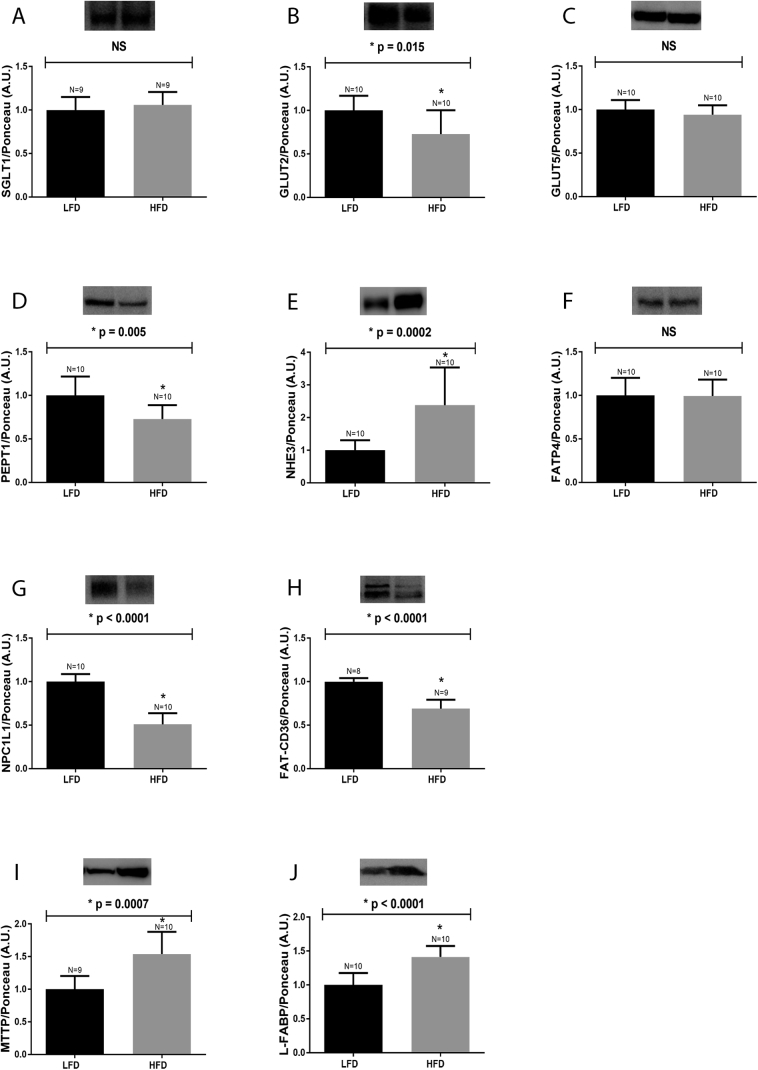
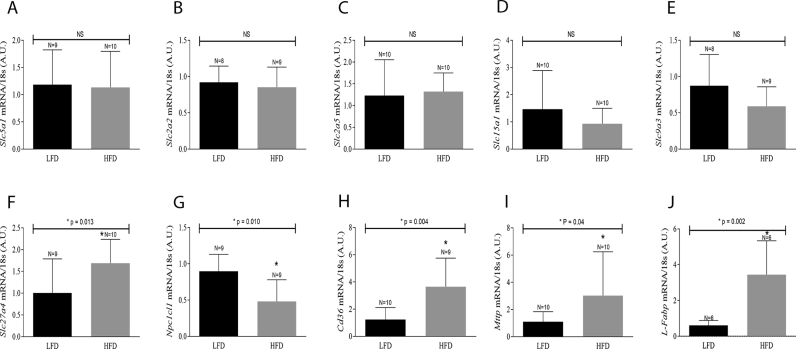
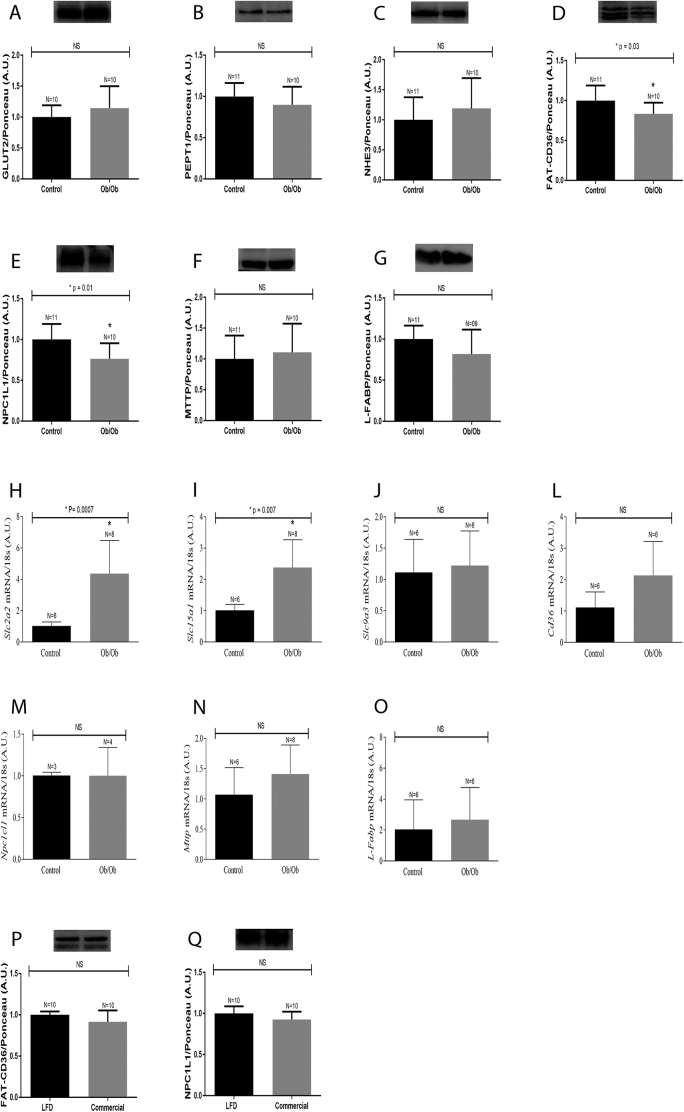
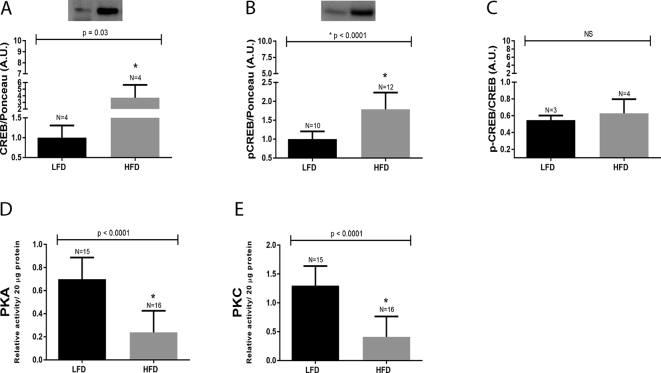
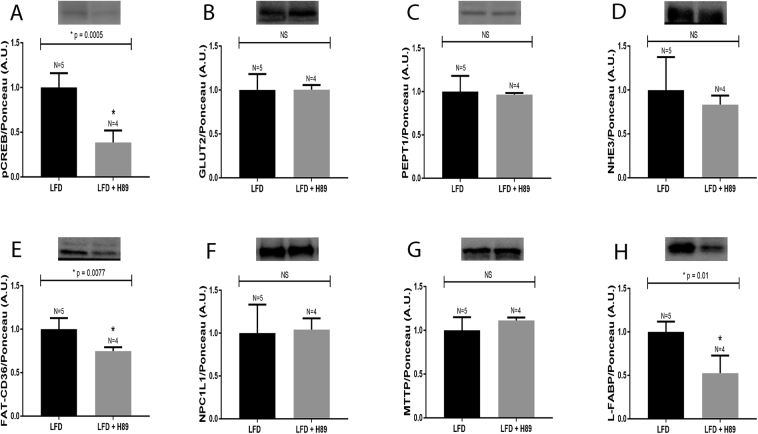
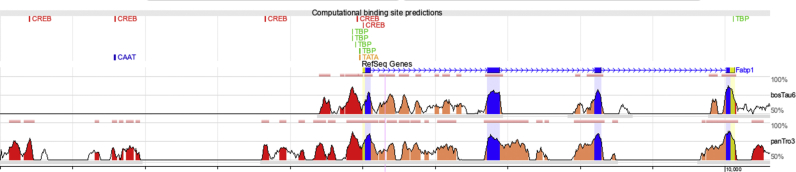
Key findings: The results showed that the HFD group presented decreased GLUT2, PEPT1, FAT/CD36 and NPC1L1, and increased NHE3, MTTP and L-FABP content. Animals fed an HFD also presented enhanced lipid transporter gene expression of Slc27a4, Npc1l1, Cd36, Mttp and L-Fabp. Additionally, FAT/CD36 and NPC1L1 protein levels were reduced in both HFD-induced obese and Ob/Ob mice. Ob/Ob mice also exhibited increased Slc2a2 and Slc15a1 mRNAs expression, but the protein expression levels remained unchanged. The HFD also attenuated PKA and PKC activities. The inhibition of PKA was associated with decreased FAT/CD36 content, whereas increased L-FABP levels likely depend on CREB activation, independent of PKA. It is plausible that the HFD-induced changes in NPC1L1, MTTP and L-FABP protein content involve regulation at the level of transcription. Moreover, the changes in GLUT2 and PEPT1 content might be associated with low PKC activity.

Significance: The results indicated that an HFD is capable of reducing nutrient transporter content, possibly attenuating nutrient uptake into the intestine, and may represent a feedback mechanism for regulating body weight. Furthermore, the elevated levels of NHE3, L-FABP and MTTP may account for the increased prevalence of hypertension and dyslipidemia in obese individuals. All of these changes are potentially linked to reduced PKA or PKC activities.

Keywords: Food science; Gastrointestinal system; High fat diet and obesity; Metabolism; Molecular biology; Nutrient transporters; Nutrition; PKA; PKC; Small intestine.


Figures

Fig. 1
Fig. 1
Protein expression in the small intestine of mice fed a HFD. Mice fed an HFD for 12 weeks were euthanized, and the intestinal epithelium was removed, homogenized and processed for detecting the followings proteins: A: SGLT1, B: GLUT2, C: GLUT5, D: PEPT1, E: NHE3, F: FATP4, G: NPC1L1, H: FAT-CD36, I: MTTP and J: L-FABP. Representative blots are displayed at the top of each graph. The number of animals analyzed for each group (N) is also displayed above each bar. Densitometry was used to measure the intensity of each band, and these values, expressed in arbitrary units (A.U.), were normalized by Ponceau-S staining intensity. The results were analyzed using the Student's “t” test. NHE3 data (E) was subjected to the non-parametric test, and all of the other proteins were evaluated using the parametric test. The p values of statistically significant results are presented above the bars of the graph; non-significant (NS) data are also indicated. The nitrocellulose membrane was cut at the level of the target proteins using a standard molecular marker as guide. The full area of the selected blots is shown in supplementary data 2.
Fig. 2
Fig. 2
mRNA expression in the small intestine of mice fed a HFD. Mice fed either LFD or HFD were euthanized after 12 weeks. The intestinal epithelium was removed, homogenized and submitted to RT-qPCR. The values obtained for each target gene were normalized with the expression levels of the housekeeping gene 18s and evaluated using Student's t test. Slc5a1 [SGLT1], Slc2a2 [GLUT2], Slc9a3 [NHE3] and Cd36 [FAT/CD36] were subjected to a parametric test, while Slc2a5 [GLUT5], Slc15a1 [PEPT1], Slc27a4 [FATP4], Npc1l1 [NPC1L1], Mttp [MTTP] and L-Fabp [L-FABP] were subjected to a non-parametric test. “N” represents the number of animals/group. The p values of statistically significant results are presented above the bars of the graph; non-significant (NS) data are also indicated.
Fig. 3
Fig. 3
Protein and mRNA expression in the small intestine of Ob/Ob mice. Five month old wild-type and Ob/Ob mice were euthanized, and the intestinal epithelium was removed, homogenized and processed for protein and mRNA expression: Panels A to G, as well as P and Q represent protein expression. Representative blots are displayed at the top of each graph. Densitometry was used to measure the intensity of each band, and these values, expressed in arbitrary units (A.U.), were normalized by Ponceau-S staining intensity. Panels H to O represent mRNA quantification as determined by RTq-PRC analyses. The number of animals analyzed for each group (N) is displayed above each bar. The results were analyzed using the Student's t-test and a non-parametric test was applied for NHE3 and MTTP protein content and for all the mRNAs evaluated. The remaining proteins were evaluated using a parametric test. The p values of statistically significant results are presented above the bars of the graph; non-significant (NS) data are also indicated. The nitrocellulose membrane was cut at the level of the target proteins using a standard molecular marker as guide. The full area of the selected blots is shown in supplementary data 2.
Fig. 4
Fig. 4
CREB protein content and PKA/PKC activities in the small intestine of mice fed a HFD. Mice were euthanized at 12th week after being fed either a LFD or HFD. The intestinal epithelium was removed, homogenized and submitted to immunoblotting against total and phosphorylated CREB (4A and 4B) as well as pCREB/CREB ratio (4C), or used for kinases activities by ELISA (4D and 4E). The number of animals analyzed for each group (N) is displayed above each bar. A representative CREB blots are displayed at the top of each panel. The total and phosphorylated CREB densitometry was normalized by Ponceau-S staining intensity. The p values are presented above the bars of the graphs. The nitrocellulose membrane was cut at the level of the target proteins using a standard molecular marker as guide. The full area of the selected blots is shown in supplementary data 2.
Fig. 5
Fig. 5
Protein expression in the small intestine of mice treated with H89. Mice fed a LFD for 12 weeks were treated with H89 or vehicle (5% DMSO), every 8 h, for 24 h. Mice were then euthanized, and the intestinal epithelium was removed, homogenized and processed for detecting the followings proteins: A: pCREB, B: GLUT2, C: PEPT1, D: NHE3, E: FAT-CD36, F: NPC1L1, G: MTTP and H: L-FABP. Representative blots are displayed at the top of each graph. The number of animals analyzed for each group (N) is also displayed above each bar. Densitometry was used to measure the intensity of each band, and these values, expressed in arbitrary units (A.U.), were normalized by Ponceau-S staining intensity. The results were analyzed using the Student's t-test. PEPT1, MTTP and L-FABP were subjected to the non-parametric test, and all the other proteins were evaluated using the parametric test. The p values of statistically significant results are presented above the bars of the graph; non-significant (NS) data are also indicated. The nitrocellulose membrane was cut at the level of the target proteins using a standard molecular marker as guide. The full area of the selected blots is shown in supplementary data 2.
Fig. 6
Fig. 6
Body weight gain and temporal analysis of nutrient transporter expression in the small intestine of mice fed a LFD or HFD. A: Body weights of mice fed either LFD or HFD were recorded at 1, 2, 3, 6, 9 and 12 weeks after starting the specific diet. Data are from two independent experiments totaling 9 to 10 mice/group. Mice from both groups were euthanized at the 3rd, 6th and 9th week, following diet initiation. The intestinal epithelium was removed, homogenized and processed for detecting the following proteins: B: GLUT2, C: PEPT1, D: NHE3, E: NPC1L1. Representative blots are displayed to the right of the graphs: 1 = 3rd week, 2 = 6th week and 3 = 9th weeks. The number of animals analyzed for each group (N) is also displayed above each bar. Densitometry was used to measure the intensity of each band, and these values, expressed in arbitrary units (A.U.), were normalized by Ponceau-S staining intensity. The p values of statistically significant results are presented above the bars of the graph; non-significant (NS) data are also indicated. The data obtained for body weight,*p < 0.05 vs 0 week HFD. #p < 0.05 vs 0 week LFD. The nitrocellulose membrane was cut at the level of the target proteins using a standard molecular marker as guide. The full area of the selected blots is shown in supplementary data 2.
Fig. 7
Fig. 7
In silico analysis: Computational binding site predictions for CREB, TBP, TATA and CAAT transcription factors on conserved regions located 5 kb upstream of the transcription start site of mouse, chimpanzee and cow L-Fabp.
Suplemmentary data 1

References

    1. Yoshikawa T., Inoue R., Matsumoto M., Yajima T., Ushida K., Iwanaga T. Comparative expression of hexose transporters (SGLT1, GLUT1, GLUT2 and GLUT5) throughout the mouse gastrointestinal tract. Histochem. Cell Biol. 2011;135:183–194. - PubMed
    1. Watanabe C., Kato Y., Ito S., Kubo Y., Sai Y., Tsuji A. Na+/H+ exchanger 3 affects transport property of H+/oligopeptide transporter 1. Drug Metab. Pharmacokinet. 2005;20:443–451. - PubMed
    1. Abumrad N.A., Davidson N.O. Role of the gut in lipid homeostasis. Physiol. Rev. 2012;92:1061–1085. - PMC - PubMed
    1. Losacco M.C., de Almeida C.F.T., Hijo A.H.T., Bargi-Souza P., Gama P., Nunes M.T., Goulart-Silva F. High-fat diet affects gut nutrients transporters in hypo and hyperthyroid mice by PPAR-a independent mechanism. Life Sci. 2018;202:35–43. - PubMed
    1. Uchida A., Slipchenko M.N., Cheng J.X., Buhman K.K. Fenofibrate, a peroxisome proliferator-activated receptor α agonist, alters triglyceride metabolism in enterocytes of mice. Biochim. Biophys. Acta. 2011;1811:170–176. - PMC - PubMed

LinkOut - more resources