. 2020 Aug;77(16):3245-3264.
doi: 10.1007/s00018-019-03350-8. Epub 2019 Oct 30.

Exocytosis of large-diameter lysosomes mediates interferon γ-induced relocation of MHC class II molecules toward the surface of astrocytes

Affiliations

Exocytosis of large-diameter lysosomes mediates interferon γ-induced relocation of MHC class II molecules toward the surface of astrocytes

Mićo Božić et al. Cell Mol Life Sci. 2020 Aug.

Abstract

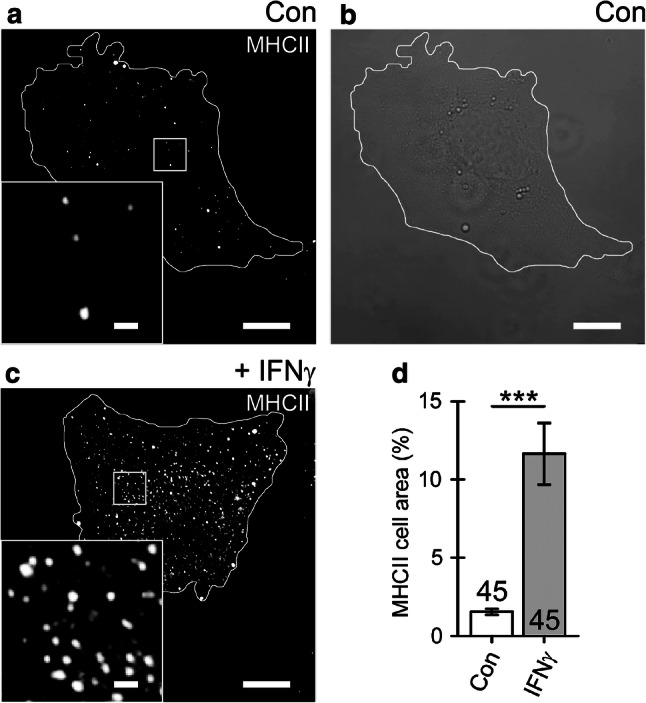
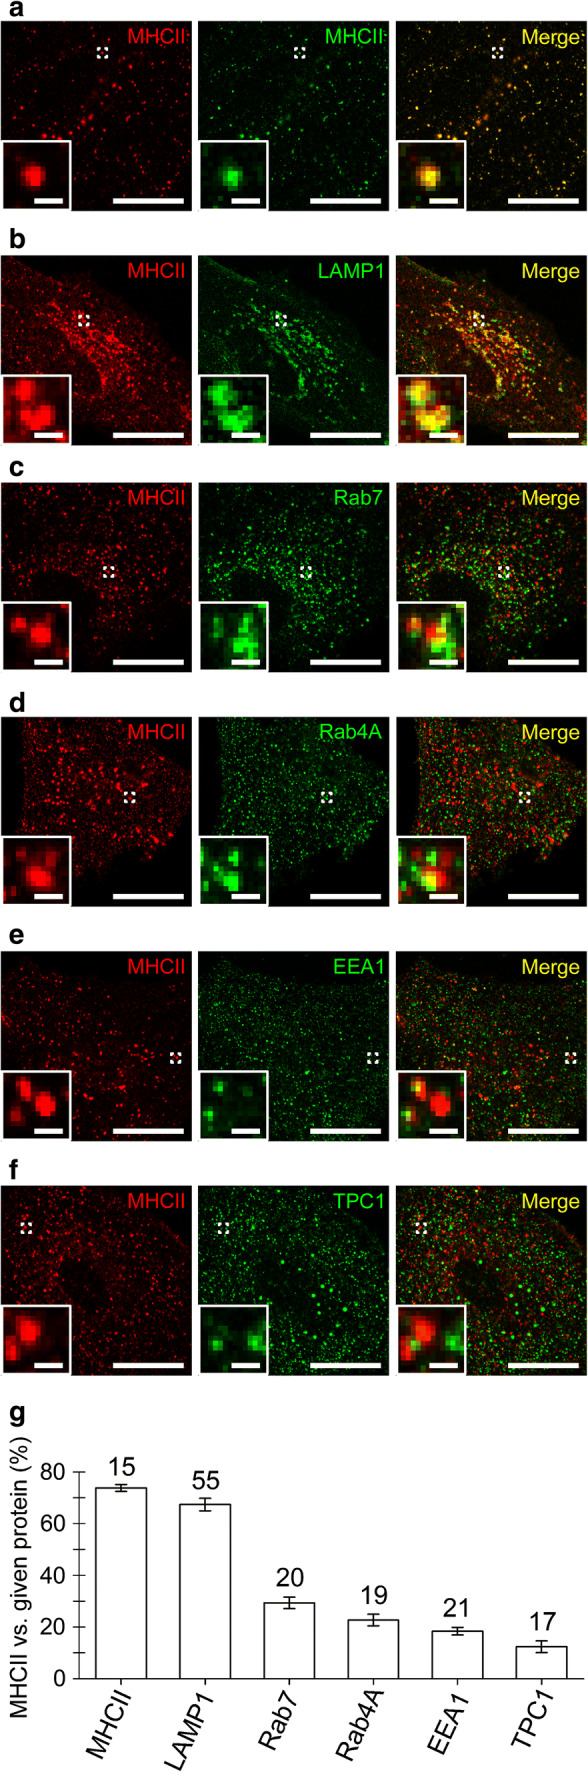
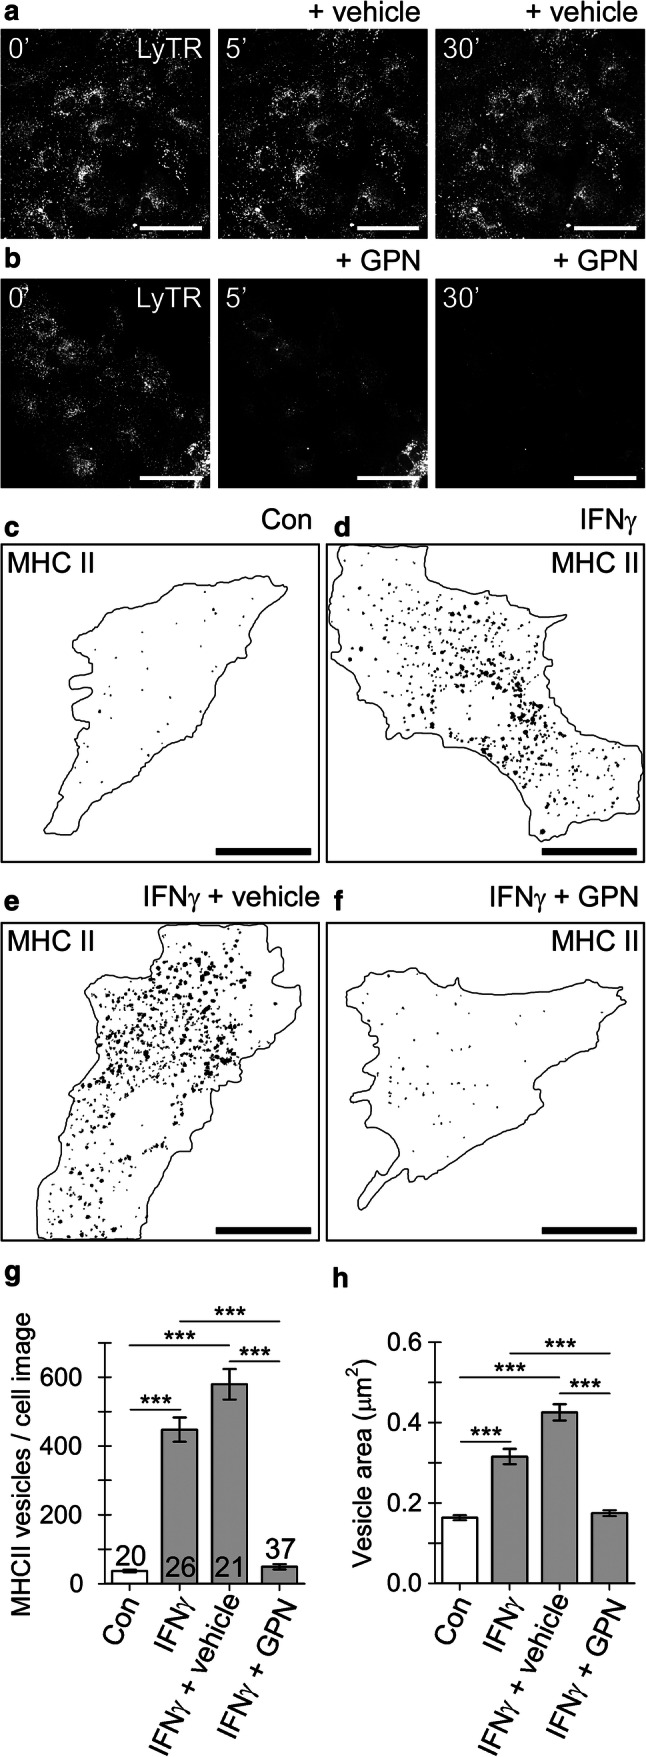
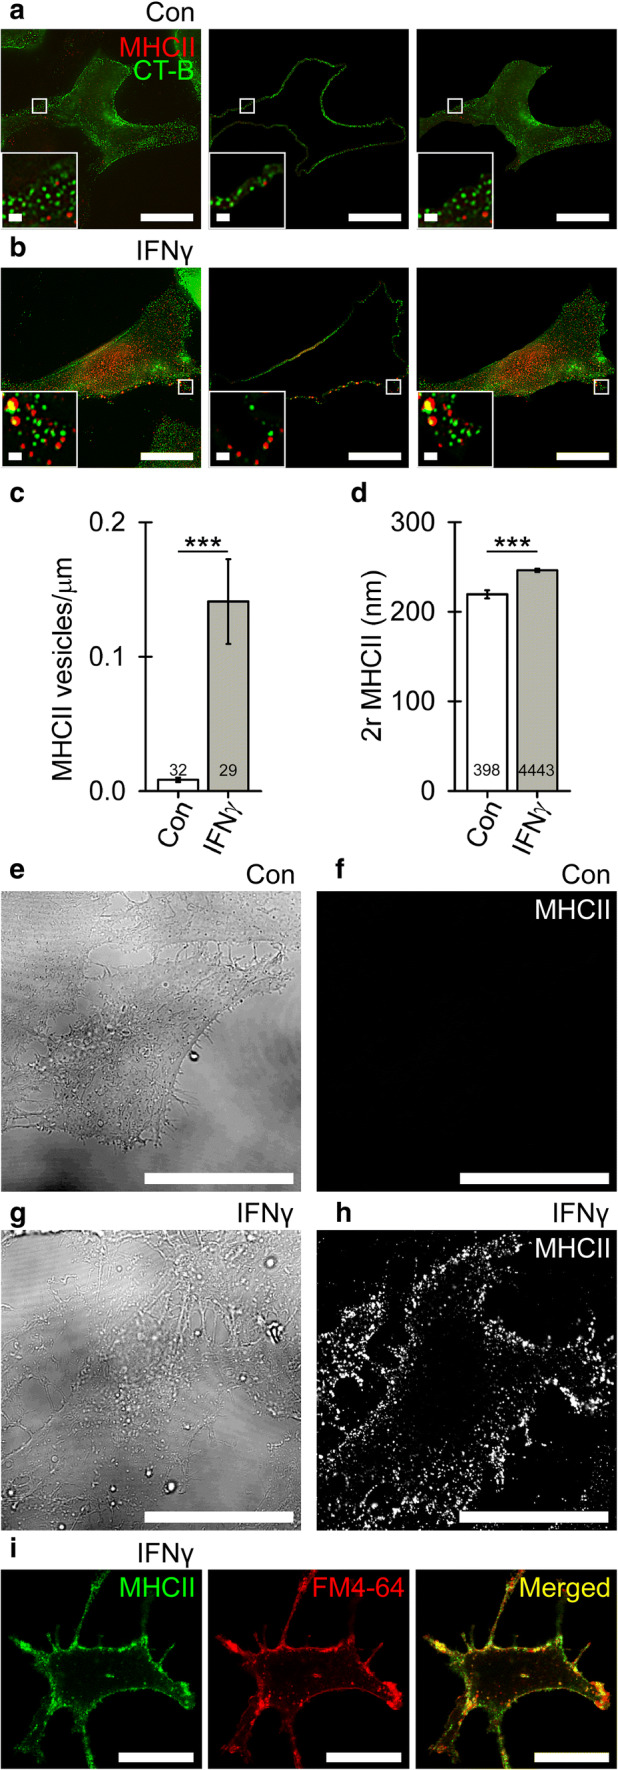
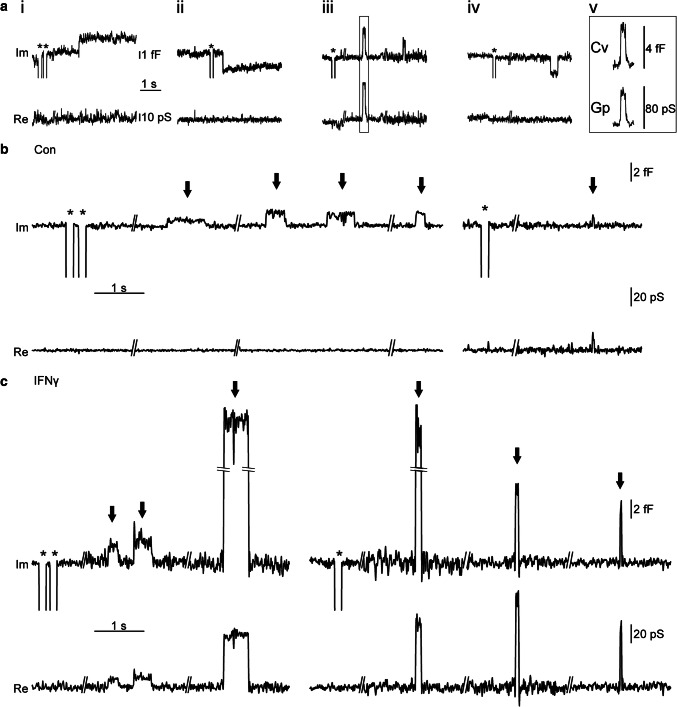
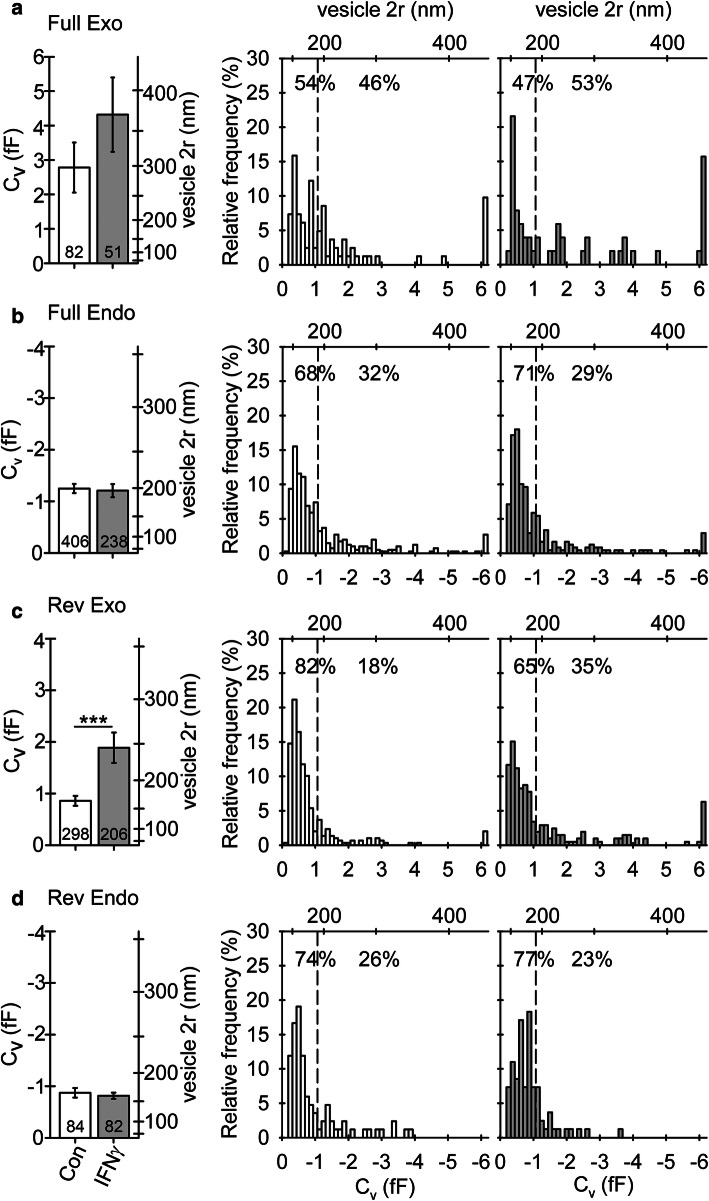
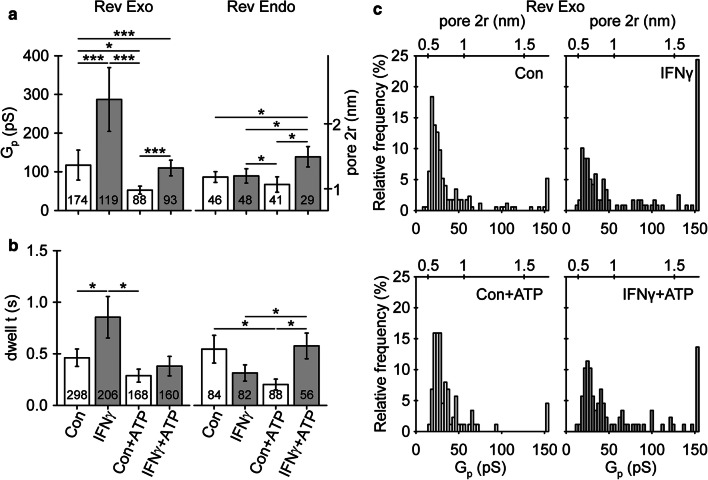
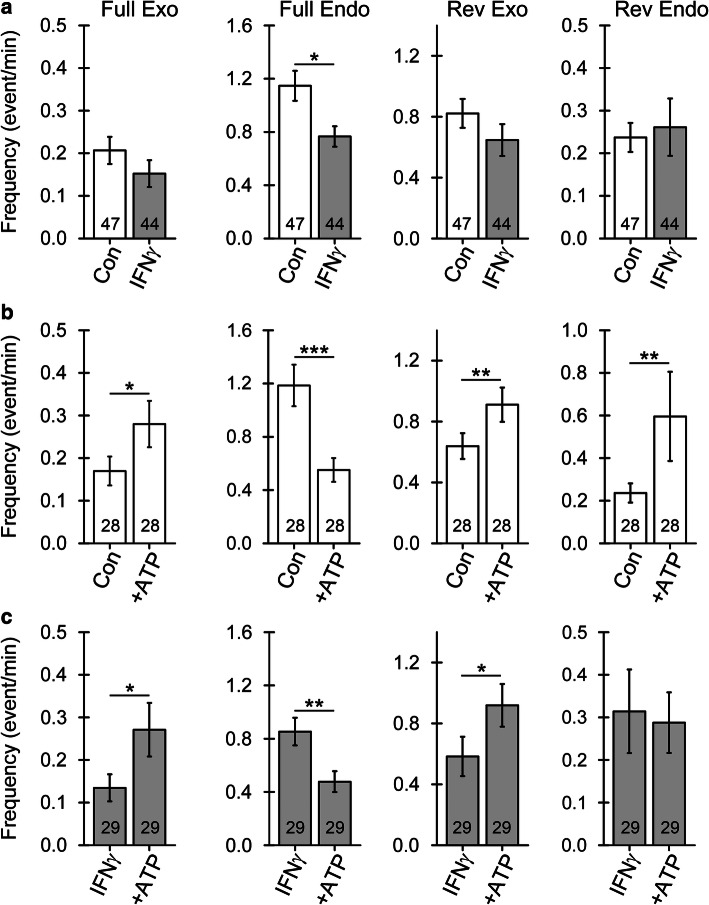
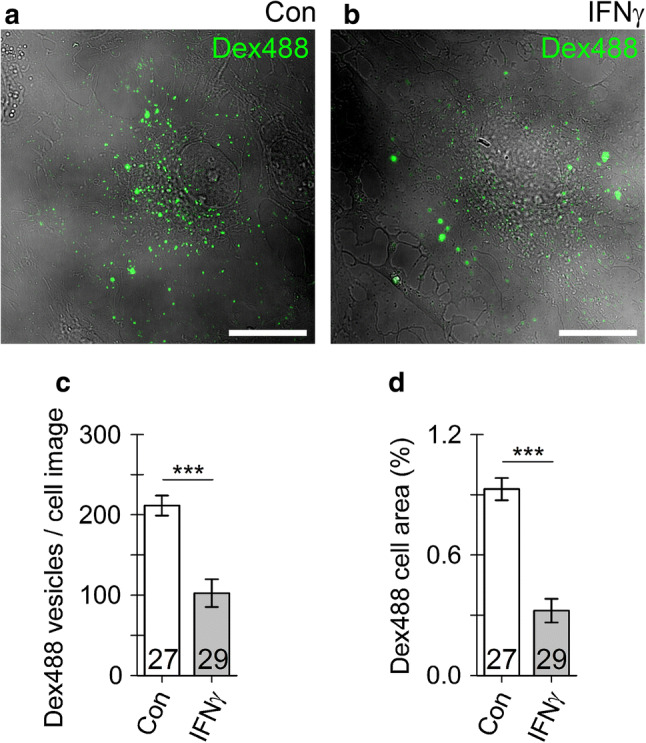
Astrocytes are the key homeostatic cells in the central nervous system; initiation of reactive astrogliosis contributes to neuroinflammation. Pro-inflammatory cytokine interferon γ (IFNγ) induces the expression of the major histocompatibility complex class II (MHCII) molecules, involved in antigen presentation in reactive astrocytes. The pathway for MHCII delivery to the astrocyte plasma membrane, where MHCII present antigens, is unknown. Rat astrocytes in culture and in organotypic slices were exposed to IFNγ to induce reactive astrogliosis. Astrocytes were probed with optophysiologic tools to investigate subcellular localization of immunolabeled MHCII, and with electrophysiology to characterize interactions of single vesicles with the plasmalemma. In culture and in organotypic slices, IFNγ augmented the astrocytic expression of MHCII, which prominently co-localized with lysosomal marker LAMP1-EGFP, modestly co-localized with Rab7, and did not co-localize with endosomal markers Rab4A, EEA1, and TPC1. MHCII lysosomal localization was corroborated by treatment with the lysosomolytic agent glycyl-L-phenylalanine-β-naphthylamide, which reduced the number of MHCII-positive vesicles. The surface presence of MHCII was revealed by immunolabeling of live non-permeabilized cells. In IFNγ-treated astrocytes, an increased fraction of large-diameter exocytotic vesicles (lysosome-like vesicles) with prolonged fusion pore dwell time and larger pore conductance was recorded, whereas the rate of endocytosis was decreased. Stimulation with ATP, which triggers cytosolic calcium signaling, increased the frequency of exocytotic events, whereas the frequency of full endocytosis was further reduced. In IFNγ-treated astrocytes, MHCII-linked antigen surface presentation is mediated by increased lysosomal exocytosis, whereas surface retention of antigens is prolonged by concomitant inhibition of endocytosis.

Keywords: Adaptive immunity; Astroglia; Fusion pore; Inflammatory cytokines; Lysosomes; Patch clamp.


Figures

Fig. 1
Fig. 1
Cell treatment with IFNγ enhances the expression of MHCII that localize to vesicle-like structures in cultured rat astrocytes. a Confocal image of control (Con) astrocyte immunolabeled by anti-MHCII and secondary Alexa-546-conjugated antibody. b Differential interference contrast image of the same cell as in (a). c Confocal image of an astrocyte treated with IFNγ for 48 h. The white curve outlines the cell perimeter (ac). Note numerous MHCII-positive vesicles in an IFNγ-treated astrocyte observed as bright fluorescent puncta. Insets display a magnified view of the MHCII-positive vesicles in control and IFNγ-treated cells. Scale bars: 10 μm (large images ac) and 1 μm (insets a, c). d The relative proportion of MHCII-positive cell area (%; surface area of MHCII-positive pixels with fluorescence above 20% of maximal fluorescence) normalized to cell image area (surface area of all pixels delimited by the cell perimeter). The MHCII-positive cell area is substantially higher in IFNγ-treated astrocytes. The numbers at the bottom of the bars indicate the number of cell images analyzed. ***P < 0.001 versus control (Mann–Whitney U test)
Fig. 2
Fig. 2
MHCII localize predominantly to lysosomes, but not early and recycling endosomes. af Confocal micrographs of fixed double-fluorescent IFNγ-treated astrocytes displaying immunolabeled MHCII (red, left) and compartments labeled by the primary antibody against MHCII (a), LAMP1-EGFP (b), primary antibodies against Rab7 (c), Rab4A (d), EEA1 (e), TPC1 (f), and the corresponding fluorescent secondary antibodies (green, middle). The merged images display co-localized pixels (yellow, right); insets display a magnified view of the selected vesicles (white open frame). Scale bars: 20 μm (large images) and 1 μm (insets) (af). (g) Graph displaying quantitative co-localization (%, mean ± SEM) of anti-MHCII fluorescence versus anti-MHCII, LAMP1-EGFP, anti-Rab7, anti-Rab4A, anti-EEA1, and anti-TPC1 fluorescence. The numbers above the bars indicate the number of cell images analyzed
Fig. 3
Fig. 3
IFNγ-induced localization of MHC II into astrocyte lysosomes is disrupted by a lysosomolytic agent glycyl-l-phenylalanine-β-naphthylamide (GPN). a and b Confocal images of live astrocytes labeled with LysoTracker red DND-99 (LyTR) before (left), 5 min (middle), and 30 min (right) after addition of vehicle (0.5‰ v/v DMSO) (a) or 200 µM GPN (b). Scale bar: 50 µm. cf Binarized images of control astrocyte (Con), IFNγ-treated astrocyte (IFNγ), IFNγ-treated astrocyte exposed to vehicle (IFNγ + vehicle), and IFNγ-treated astrocyte exposed to 200 µM GPN for 30 min (IFNγ + GPN). Numerous black puncta in the mask images depict individual MHCII-positive vesicles composed of ≥ 3 adjacent pixels with mean fluorescence intensity > 20% of maximal fluorescence. Note the diminished number of MHCII-positive vesicles in the IFNγ-treated astrocyte exposed to GPN. The black curve outlines the cell perimeter (cf). Scale bar: 20 µm. gh Number (mean ± SEM) of MHCII-positive vesicles (g) and the mean vesicle surface area per imaged cell (h) in non-treated controls (Con), IFNγ-treated astrocytes (IFNγ), IFNγ-treated astrocytes exposed to vehicle (IFNγ + vehicle), and IFNγ-treated astrocytes exposed to 200 µM GPN for 30 min (IFNγ + GPN). Numbers at the base of the bars indicate the number of cells analyzed. ***P < 0.001 versus respective comparison (ANOVA on ranks followed by Dunn’s test)
Fig. 4
Fig. 4
IFNγ treatment induces the formation of large MHCII-positive vesicles in the vicinity of the plasmalemma (a and b) Super-resolution SIM images of double-fluorescent astrocytes labeled with cholera toxin subunit B Alexa 488 conjugate (CT-B; green) and anti-MHCII tagged with fluorescent secondary antibody (MHCII; red) in controls (a) and IFNγ-treated cells (b). The number of MHCII-positive vesicles was quantified in a region-dependent manner in images of the cell periphery (middle) and cell interior (right); for details see “Materials and methods”. Scale bars: 20 µm (large image) and 1 μm (insets). c Number of MHCII-positive vesicles in the cell periphery per micrometer of plasmalemma in control and IFNγ-treated astrocytes (mean ± SEM). d Diameter (2r) of MHCII vesicles in control and IFNγ-treated astrocytes. Numbers at the bottom of the bars indicate the number of cells (c) or vesicles (d) analyzed. ***P < 0.001 (Mann–Whitney U test). e and g differential interference contrast images of live control (Con; e) and IFNγ-treated astrocytes (IFNγ, g), and the corresponding confocal images displaying MHCII-positive immunofluorescence at the cellular surface (f and h). Note abundant MHCII-positive immunofluorescence at the surface of IFNγ-treated (h) but not control cells (f). Scale bar: 20 µm. (i) Confocal micrographs of double-fluorescent, non-permeabilized, IFNγ-treated astrocytes labeled with anti-MHCII tagged with fluorescent secondary antibody (MHCII, green, left) and styryl dye FM4-64 (red, middle). The merged image displays co-localized pixels (yellow, right). Scale bar: 20 µm
Fig. 5
Fig. 5
Types of vesicle–plasmalemma interactions measured by high-resolution patch-clamp membrane capacitance measurements in cultured rat astrocytes. a Representative examples of upward and downward steps in the imaginary (Im) and real (Re) component of the admittance signal represent elementary events of exo- and endocytosis: (i) full exocytosis (ii) full endocytosis (iii) reversible exocytosis (iv) reversible endocytosis; (v) an event of reversible exocytosis that exhibited projection to the Re trace, indicating the formation of a highly resistive narrow fusion pore enabling measurement of fusion pore conductance (Gp). Asterisks denote calibration pulses. For details, see “Materials and methods”. b and c Individual events of reversible exocytosis in control (b) and IFNγ-treated astrocytes (c) marked by the arrows in Im component of the admittance trace signal
Fig. 6
Fig. 6
Astrocyte treatment by IFNγ favors reversible fusion of exocytotic vesicles with larger diameter (a–d) Plots depicting vesicle diameter (2r; mean ± SEM, left) and relative frequency distribution of vesicle capacitance (Cv, bottom right) and vesicle diameter (2r, top right) in vesicles undergoing full exocytosis (a), full endocytosis (b), reversible exocytosis (c), and reversible endocytosis (d) in controls and IFNγ-treated astrocytes. Numbers at the bottom of the bars indicate the number of vesicles analyzed. In IFNγ-treated astrocytes, note an increase in vesicle diameter in exocytotic vesicles undergoing transient exocytosis. ***P < 0.001 (Mann–Whitney U test)
Fig. 7
Fig. 7
Astrocyte treatment with IFNγ alters fusion pore geometry and pore kinetics in reversible exocytosis. a Fusion pore conductance (Gp) and diameter (2r) of reversible exo- (Rev Exo) and endocytotic vesicles (Rev Endo) establishing a narrow fusion pore at rest and after ATP stimulation of controls and IFNγ-treated astrocytes. b Fusion pore dwell time (dwell t) measured in reversible exo- and endocytotic vesicles at rest and after ATP stimulation in controls and IFNγ-treated astrocytes. Numbers at the bottom of the bars denote the number of vesicles (a), and exo- and endocytotic events examined (b). Note an increase in fusion pore diameter and open pore dwell time in vesicles undergoing transient exocytosis at rest and after ATP stimulation in IFNγ-treated astrocytes. *P < 0.05, **P < 0.01, ***P < 0.001 (Mann–Whitney U test). c Plots depicting the relative frequency distribution of fusion pore conductance (Gp) and pore diameter (pore 2r) in reversible exocytotic vesicles establishing a narrow fusion pore at rest and after ATP stimulation in controls and IFNγ-treated astrocytes
Fig. 8
Fig. 8
Astrocyte treatment by IFNγ affects the frequency of elementary exo- and endocytosis at rest and after ATP stimulation. a Frequency of elementary events (mean ± SEM) of full exocytosis (Full Exo), full endocytosis (Full Endo), reversible exocytosis (Rev Exo), and reversible endocytosis (Rev Endo) in controls and IFNγ-treated astrocytes. Note the decreased frequency of full endocytotic events in IFNγ-treated astrocytes. b and c Frequency of elementary events of exo- and endocytosis (as in a) before and after 100 µM ATP stimulation in controls (b) and IFNγ-treated astrocytes (c). Note that ATP stimulation similarly affects the frequency of exo- and endocytotic events in controls and IFNγ-treated astrocytes *P < 0.05, **P < 0.01, ***P < 0.001 (Wilcoxon signed-rank test). Numbers at the bottom of the bars indicate the number of cells analyzed
Fig. 9
Fig. 9
Fluid-phase endocytosis is suppressed in IFNγ-treated astrocytes. a, b Representative confocal images of an control astrocyte (a) and IFNγ-treated astrocytes (b) incubated for 3 h with 10 kDa dextran Alexa 488 conjugates (Dex488, green). Note individual Dex488-laden vesicles visible as bright fluorescent puncta (green). Scale bar: 20 µm. c, d Graphs displaying the number (mean ± SEM) of Dex488-laden vesicles per cell (c) and the relative proportion of Dex488-positive cell area normalized to cell image area (analogous to Fig. 1d) in controls (Con) and IFNγ-treated astrocytes. The numbers at the bottom of the bars indicate the number of cell images analyzed. ***P < 0.001 versus control (Mann–Whitney U test)

Similar articles

Cited by

References

    1. Verkhratsky A, Nedergaard M. Physiology of astroglia. Physiol Rev. 2018;98(1):239–389. doi: 10.1152/physrev.00042.2016. - DOI - PMC - PubMed
    1. Sofroniew MV. Molecular dissection of reactive astrogliosis and glial scar formation. Trends Neurosci. 2009;32(12):638–647. doi: 10.1016/j.tins.2009.08.002. - DOI - PMC - PubMed
    1. Pekny M, Pekna M. Astrocyte reactivity and reactive astrogliosis: costs and benefits. Physiol Rev. 2014;94(4):1077–1098. doi: 10.1152/physrev.00041.2013. - DOI - PubMed
    1. Verkhratsky A, Zorec R, Parpura V. Stratification of astrocytes in healthy and diseased brain. Brain Pathol. 2017;27(5):629–644. doi: 10.1111/bpa.12537. - DOI - PMC - PubMed
    1. Sofroniew MV. Astrocyte barriers to neurotoxic inflammation. Nat Rev Neurosci. 2015;16(5):249–263. doi: 10.1038/nrn3898. - DOI - PMC - PubMed

MeSH terms