. 2020 May;23(2):159-177.
doi: 10.1007/s10456-019-09688-8. Epub 2019 Oct 30.

Cancer-associated fibroblast-derived WNT2 increases tumor angiogenesis in colon cancer

Affiliations

Cancer-associated fibroblast-derived WNT2 increases tumor angiogenesis in colon cancer

Daniela Unterleuthner et al. Angiogenesis. 2020 May.

Abstract

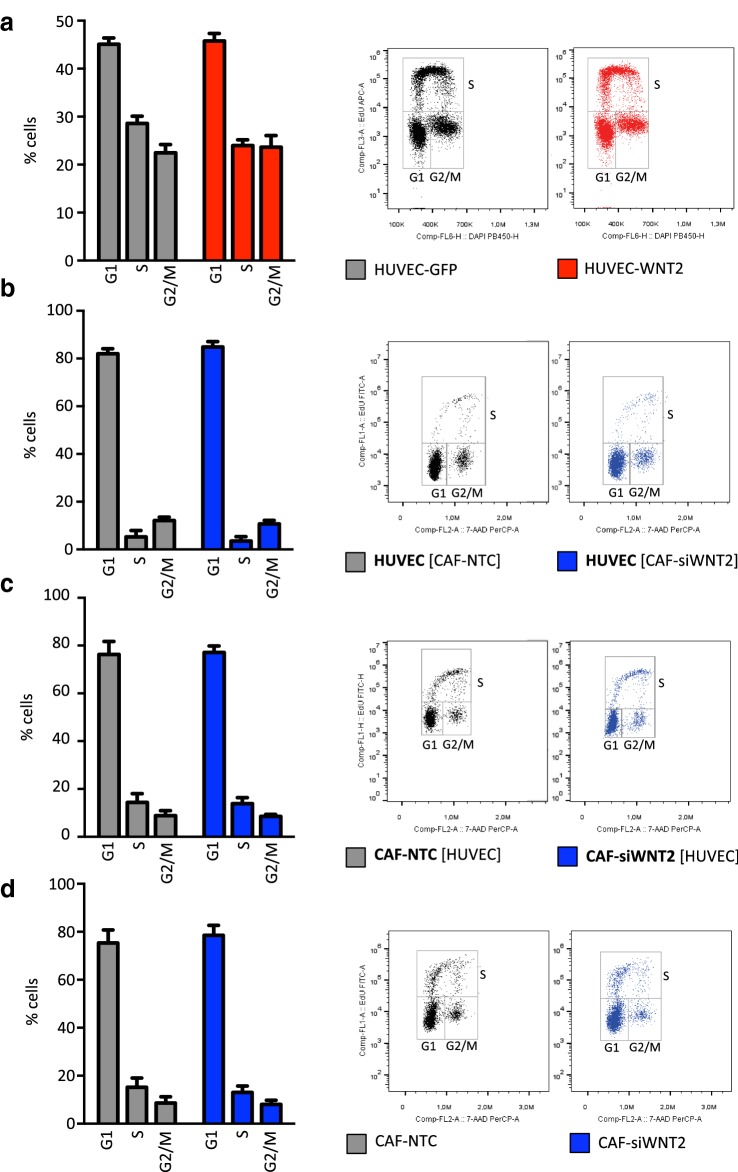
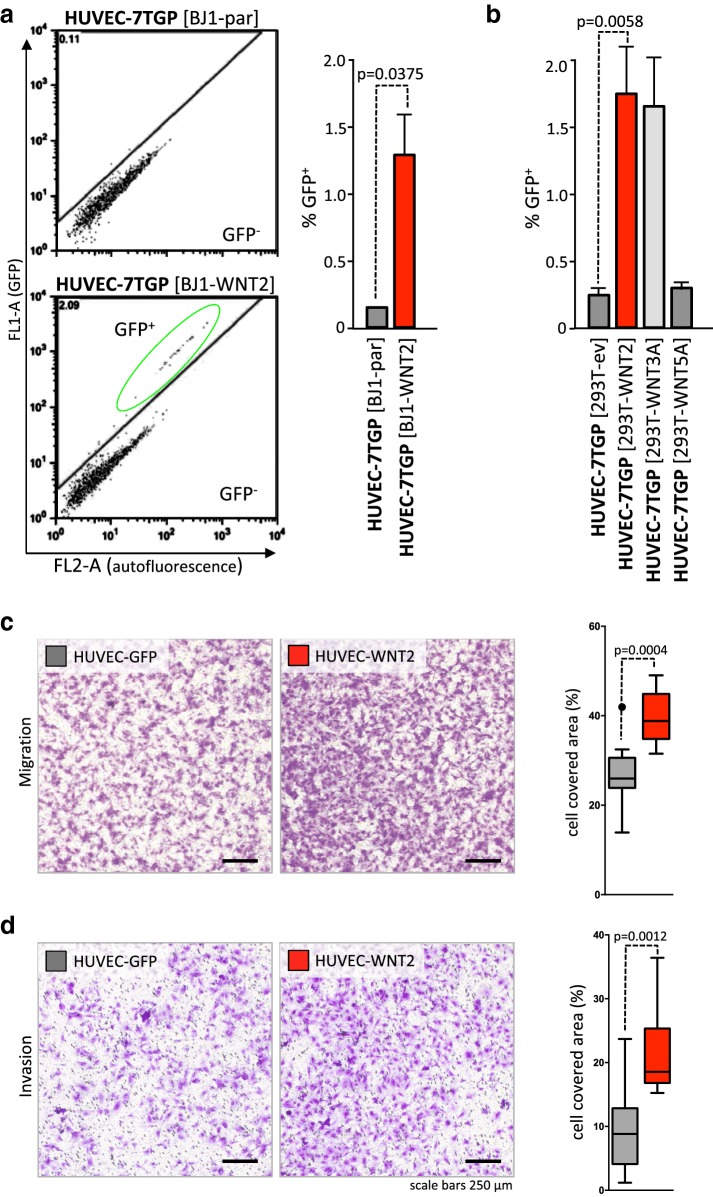
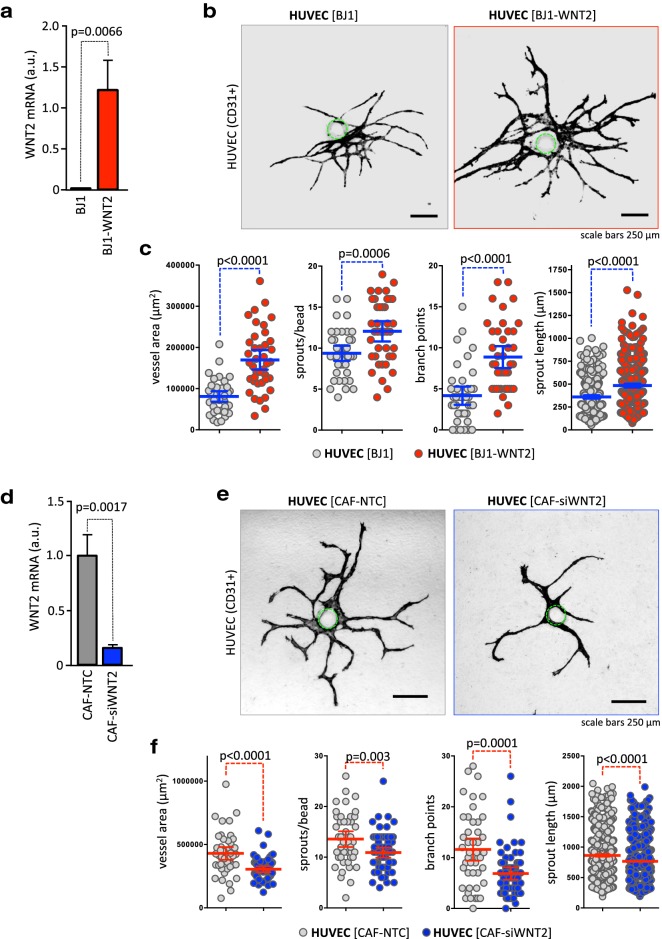
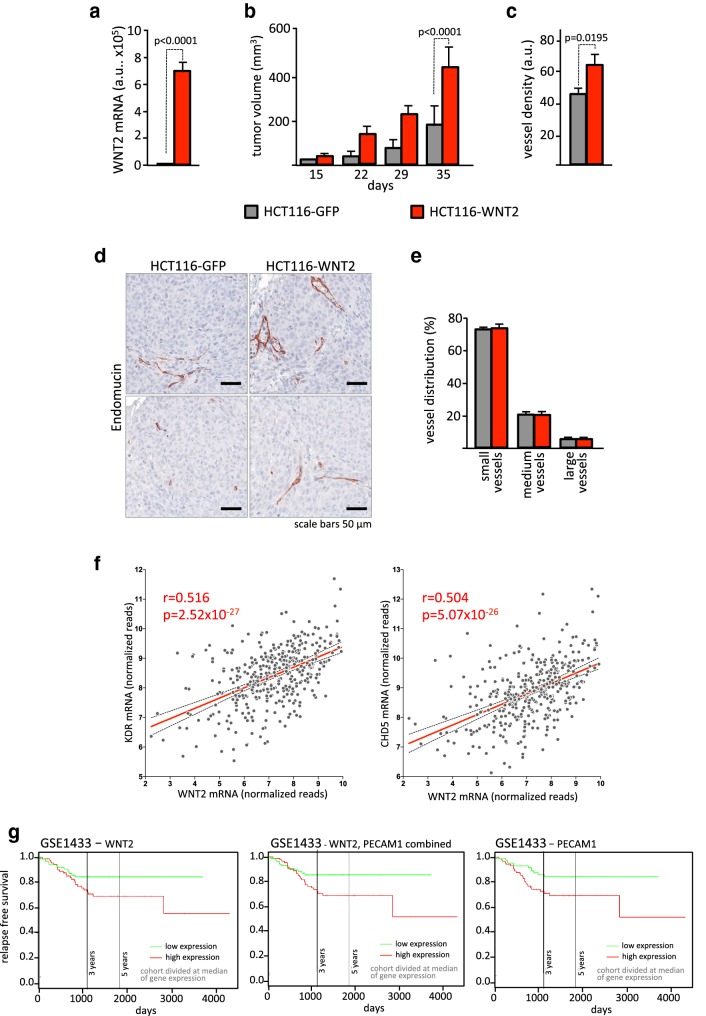
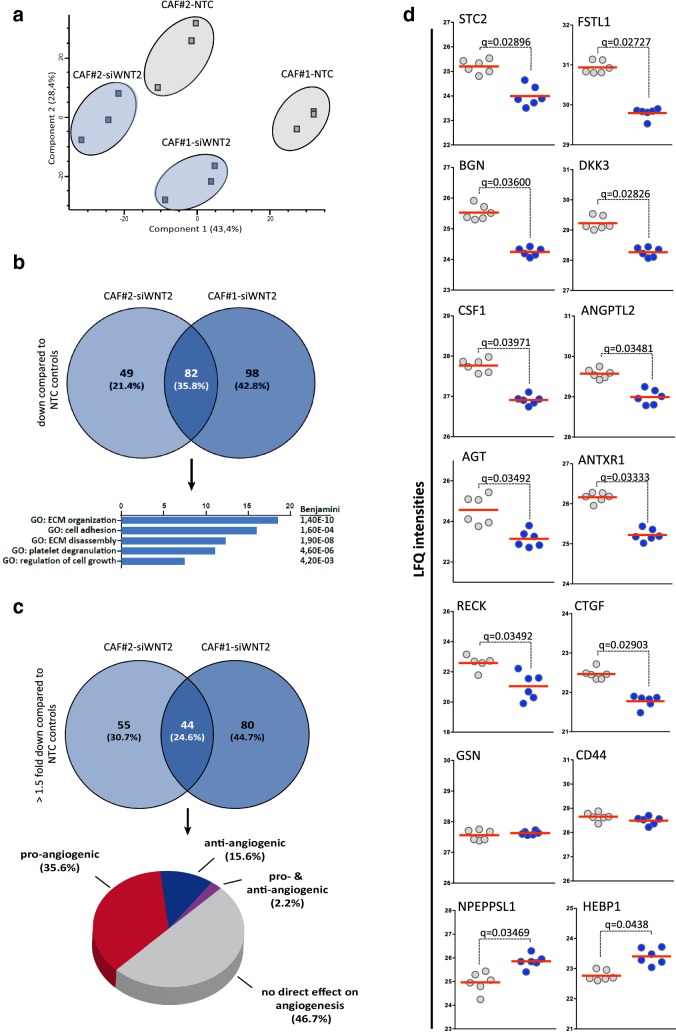
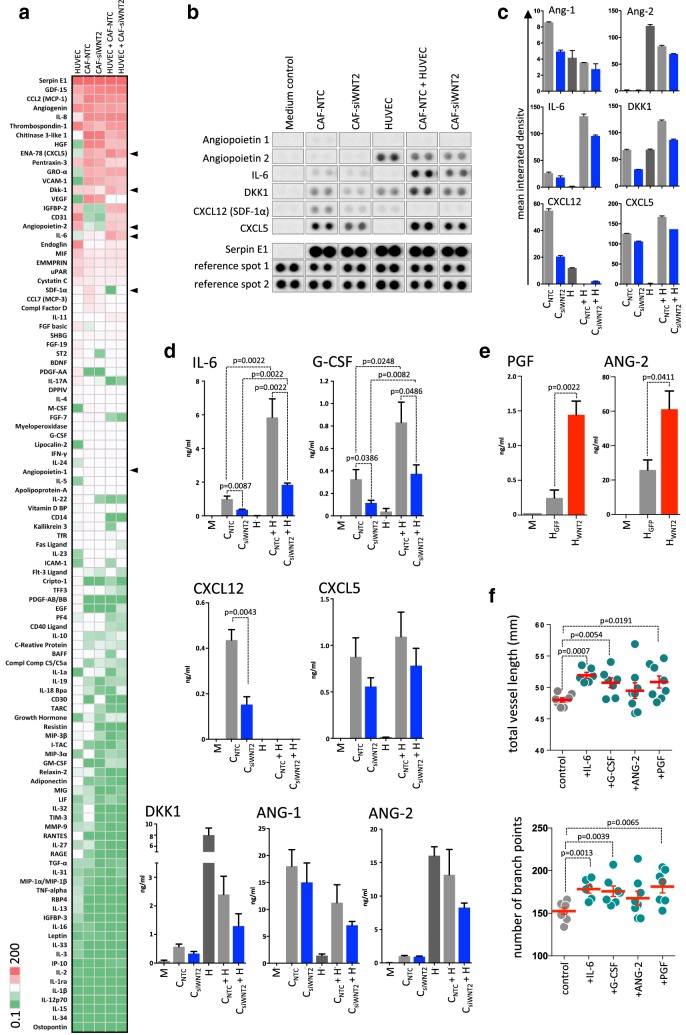
WNT2 acts as a pro-angiogenic factor in placental vascularization and increases angiogenesis in liver sinusoidal endothelial cells (ECs) and other ECs. Increased WNT2 expression is detectable in many carcinomas and participates in tumor progression. In human colorectal cancer (CRC), WNT2 is selectively elevated in cancer-associated fibroblasts (CAFs), leading to increased invasion and metastasis. However, if there is a role for WNT2 in colon cancer, angiogenesis was not addressed so far. We demonstrate that WNT2 enhances EC migration/invasion, while it induces canonical WNT signaling in a small subset of cells. Knockdown of WNT2 in CAFs significantly reduced angiogenesis in a physiologically relevant assay, which allows precise assessment of key angiogenic properties. In line with these results, expression of WNT2 in otherwise WNT2-devoid skin fibroblasts led to increased angiogenesis. In CRC xenografts, WNT2 overexpression resulted in enhanced vessel density and tumor volume. Moreover, WNT2 expression correlates with vessel markers in human CRC. Secretome profiling of CAFs by mass spectrometry and cytokine arrays revealed that proteins associated with pro-angiogenic functions are elevated by WNT2. These included extracellular matrix molecules, ANG-2, IL-6, G-CSF, and PGF. The latter three increased angiogenesis. Thus, stromal-derived WNT2 elevates angiogenesis in CRC by shifting the balance towards pro-angiogenic signals.

Keywords: 3D co-culture; Angiogenesis; Colorectal cancer; Heterotypic cell–cell interactions; Tumor stroma; WNT2.


Conflict of interest statement

The authors declare no potential conflicts of interest.

Figures

Fig. 1
Fig. 1
WNT2 does not change cell cycle progression in HUVECs and CAFs. Cell cycle profiles were obtained by flow cytometry analysis (right panels show one representative result) of monolayer cells by EdU incorporation (20 min pulse) and 7AAD staining. Percentages of G1, S, G2/M phase were determined (n = 3). Bars are mean ± SEM; data are from three biological replicates. a HUVECs either expressing GFP (HUVEC-GFP) or ectopically expressing WNT2 (HUVEC-WNT2) in monoculture. b, c HUVECs in co-culture with CAF either depleted of WNT2 by siRNA-mediated knockdown (CAF-siWNT2) or transfected with non-targeting control (CAF-NTC). The EC marker CD31 was used to distinguish the two cell types in the co-cultures. Cell cycle distribution of HUVEC cells (gated as CD31+) is shown in b, whereas the profiles of the CAFs (CD31) are shown in c. Co-cultures are indicated by listing both cell types, and bold letters indicate cells analyzed; square brackets indicate the cells not being analyzed. d Monoculture of CAFs grown in monolayers.
Fig. 2
Fig. 2
WNT2 induces canonical signaling only in a small subset of HUVEC, but significantly induces migration and invasion of HUVEC. HUVECs stably transfected with a 7TGP reporter plasmid were co-cultured with different WNT-molecule-producing cells for 72 h and WNT-induced GFP expression was monitored by flow cytometry. a HUVEC-7TGP co-cultured with parental BJ1 fibroblasts or BJ1 ectopically expressing WNT2. GFP+ gating strategy is shown (left). Mean percentage of GFP expressing HUVECs (CD31+) is shown right (HUVEC-7TGP [BJ1-par], n = 3; HUVEC-7TGP [BJ1-WNT2], n =  5). b HUVEC-7TGP co-cultured with 293T cells engineered to express WNT2, WNT3A, or WNT5A or containing empty vector control (ev). Bars indicate mean percentages of GFP+ cells, n = 4; error bars indicate SEM. P values are indicated. c, d Migration and invasion of HUVEC-WNT2 (red) from factor-free basal medium towards full EGM™-2MV in comparison to HUVEC-GFP (gray) was assessed using transwell migration inserts with 5.0 µm and 8.0 µm pore sizes, respectively (representative data of three [migration, 6 h] or two [invasion, 8 h] biological replicates performed in technical duplicates are depicted). Representative pictures of crystal violet stained migrated cells at the lower surface of the transwell membrane are shown in c (left). Quantification of migration. Membrane coverage data of HUVECs are shown in Whisker-box plots (right). Representative pictures of crystal violet stained HUVECs invading through EBM-coated inserts are depicted in d (left). Quantification of invasion (right). Horizontal lines in the plots indicate the median, boxes represent the interquartile range (IQR) between the 25th and 75th percentile, and whiskers extend to 1.5 times the IQR. Outliers are displayed by dots; P values are indicated.
Fig. 3
Fig. 3
Fibroblast-derived WNT2 induces vessel growth and sprouting in a 3D angiogenesis co-culture assay. a Skin fibroblasts ectopically expressing WNT2 (BJ1WNT2, red) or with parental BJ1 (gray) were co-cultivated with HUVEC-coated microcarrier beads. WNT2 overexpression was evaluated by RT-qPCR. b After 14 days of co-culture, endothelial structures were stained with CD31 and representative images are depicted. The position of the bead is indicated by a green dotted line. c Image processing was used to quantify vessel areas, sprout numbers, branch points, and sprout length per bead [40]. Blue horizontal lines indicate the mean, error bars are SEM, endothelial structures derived from 40 beads were analyzed for each condition, and P values are indicated. d CAFs (CAF#1) endogenously expressing WNT2 (CAF-NTC, gray) or with a WNT2 knockdown (CAF-siWNT2, blue) were co-cultivated with HUVEC-coated microcarrier beads. WNT2 depletion was evaluated by RT-qPCR. e After 14 days of co-culture, CD31+ endothelial structures were evaluated and representative images are depicted. The position of the bead is indicated by a green dotted line. f Vessel areas, sprout numbers, branch points, and sprout length per bead were measured. Red horizontal lines indicate the mean; error bars are SEM; CAF-NTC, n = 45; CAF-siWNT2, n  = 63; P values are given.
Fig. 4
Fig. 4
WNT2 overexpression is associated with increased angiogenesis in vivo. a WNT2 expression was assessed in HCT116 cells either expressing GFP (HCT116-GFP, gray) or WNT2 (HCT116-WNT2, red) by RT-qPCR analysis. b 1 × 105 cells were subcutaneously injected into SCID mice and tumor growth was measured. c Vessel density was quantified by Endomucin IHC staining and image analysis using Tissue Studio. d Two representative images are shown. Vessels (Endomucin+) are stained with AEC (brown). e The distribution of small, medium, and large vessels within the two groups was assessed with Tissue Studio. b, cn = 4 for HCT116-GFP and nn =  3 for HCT116-WNT2, and bars are means; error bars represent SEM. P values are indicated. f Correlation of WNT2 and VEGFR2 (KDR) as well as VE-cadherin (CDH5) mRNA expression in 382 CRC patients using the TCGA COADREAD RNASeq dataset. Gray dots represent individual samples; red line illustrates linear regression. Confidence interval (95%) is shown (dotted lines). Pearson’s correlations and P values are indicated. g Survival analysis of 290 CRC patients using the Sieber (GSE14333) dataset. Data were bifurcated for high and low WNT2, PECAM1, or WNT2/PECAM1 expression at the median and a Kaplan–Meier plot was generated with SurvExpress [74]. Red, high; green, low expression of WNT2, PECAM1, or WNT2/PECAM1.
Fig. 5
Fig. 5
Secretome profiling of CAFs in the presence (CAF-NTC) or absence of WNT2 (CAF-siWNT2). a Principal component analysis of the secreted fractions of CAFs derived from two different patients treated with either non-targeting control (NTC) siRNA or with WNT2-specific siRNA. A clear distinction between the controls and the siWNT2-treated samples can be observed for both CAFs. Data were generated from three biological replicates, analyzed via LC-MS in technical duplicates. b Venn diagram of secreted proteins downregulated in CAFs upon WNT2 knockdown and functional annotation of the proteins with significant lower expression in both CAFs performed using the DAVID functional annotation tool. c Venn diagram taking only proteins significantly downregulated with a minimum fold change of 1.5 taken into account. The 44 proteins with significantly lower expression in both groups displayed in a pie chart showing the percentage of proteins reported in the literature to be directly involved in angiogenesis or not. The list of the proteins with the according references is shown in Table 1. d Scatter dot plots of LFQ intensities of examples for significantly down- or upregulated and not-regulated proteins in upon knockdown of WNT2 (CAF-siWNT2) compared to NTC-siRNA-treated controls (CAF-NTC) as determined by LC-MS-based secretome profiling. Data from all biological and technical replicates of CAF#1 are depicted. Red lines represent the mean. Q-values of multi-parameter corrected significance tests are indicated.
Fig. 6
Fig. 6
Cytokine profiling identifies IL-6, G-CSF, and PGF as WNT2-regulated genes, which support angiogenesis. a Semi-quantitative membrane-based cytokine array analysis (Proteome Cytokine XL Profiler) of HUVEC- and CAF-secreted factors in monocultures of HUVEC, CAF-NTC, and CAF-siWNT2 as well as in HUVEC-CAF co-cultures. Arbitrary mean expression values after densitometric quantification were ranked on average expression of all conditions from high to low and visualized as heatmap. High levels of cytokine signals are indicated in red, intermediate in white, and low or absent molecules are displayed in green. Arrowheads indicate robust differences between CAF-NTC and CAF-siWNT2 in mono- or co-cultures. b Actual signals of the six identified cytokines/growth factors in comparison to unchanged Serpin E1 expression and the positive controls (reference spots). c Mean integrated density blot of the two signals per cytokine shown in b. Error bars indicate range. d, e Quantitative determination of cytokines/growth factors from CAF-NTC (CNTC), CAF-siWNT2 (CsiWNT2), HUVEC (H) mono- and co-cultures as well as HUVEC-WNT2 (HWNT2) and HUVEC-GFP (HGFP) cells released within 24 h into serum-free medium by a multiplex flow cytometry bead array. Mean values are shown; error bars represent SEM; P values are indicated for statistically significant changes. f Matrigel tube formation assay of HUVECs cultivated in control medium (gray) or in the presence of the indicated recombinant human factors (green; IL-6, G-CSF, PGF: 20 ng/ml; ANG-2: 100 ng/ml) for 11 h. Vessel length and the number of branch points were detected with the AngioTool software. Red horizontal lines designate the mean, and error bars are SEM; P values are indicated for significant changes.

References

    1. Bray F, et al. Global cancer statistics 2018: GLOBOCAN estimates of incidence and mortality worldwide for 36 cancers in 185 countries. CA Cancer J Clin. 2018;68(6):394–424. - PubMed
    1. Castells M, et al. Implication of tumor microenvironment in chemoresistance: tumor-associated stromal cells protect tumor cells from cell death. Int J Mol Sci. 2012;13(8):9545–9571. - PMC - PubMed
    1. Tlsty TD, Coussens LM. Tumor stroma and regulation of cancer development. Annu Rev Pathol. 2006;1:119–150. - PubMed
    1. Quail DF, Joyce JA. Microenvironmental regulation of tumor progression and metastasis. Nat Med. 2013;19(11):1423–1437. - PMC - PubMed
    1. Isella C, et al. Stromal contribution to the colorectal cancer transcriptome. Nat Genet. 2015;47(4):312–319. - PubMed

Publication types

MeSH terms