. 2019 Dec 17;51(6):1012-1027.e7.
doi: 10.1016/j.immuni.2019.10.001. Epub 2019 Oct 24.

Amino Acids License Kinase mTORC1 Activity and Treg Cell Function via Small G Proteins Rag and Rheb

Affiliations

Amino Acids License Kinase mTORC1 Activity and Treg Cell Function via Small G Proteins Rag and Rheb

Hao Shi et al. Immunity. .

Abstract

Regulatory T (Treg) cells are critical mediators of immune tolerance whose activity depends upon T cell receptor (TCR) and mTORC1 kinase signaling, but the mechanisms that dictate functional activation of these pathways are incompletely understood. Here, we showed that amino acids license Treg cell function by priming and sustaining TCR-induced mTORC1 activity. mTORC1 activation was induced by amino acids, especially arginine and leucine, accompanied by the dynamic lysosomal localization of the mTOR and Tsc complexes. Rag and Rheb GTPases were central regulators of amino acid-dependent mTORC1 activation in effector Treg (eTreg) cells. Mice bearing RagA-RagB- or Rheb1-Rheb2-deficient Treg cells developed a fatal autoimmune disease and had reduced eTreg cell accumulation and function. RagA-RagB regulated mitochondrial and lysosomal fitness, while Rheb1-Rheb2 enforced eTreg cell suppressive gene signature. Together, these findings reveal a crucial requirement of amino acid signaling for licensing and sustaining mTORC1 activation and functional programming of Treg cells.

Keywords: RagA; RagB; Rheb; Treg cells; amino acids; autoimmunity; eTreg cells; mTOR; metabolism.


Conflict of interest statement

DECLARATION OF INTERESTS

K.-L.G. is a co-founder and has an equity interest in Vivace Therapeutics, Inc.

Figures
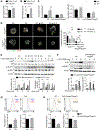
Figure 1.
Figure 1.. Amino acids and RagA/B signaling license TCR-inducible mTORC1 activity
(A and B) CD98 (A; n = 8) or Slc7a1 (B; n = 4) expression on naïve CD4+ T cells and Foxp3+ Treg cells. (C) Quantification of phosphorylated S6 (p-S6) or p-4E-BP1 (n = 3) in Treg cells from WT or Cd4CreRragafl/flRragbfl/fl mice stimulated with amino acid-deficient (AA−) or amino acid-sufficient (AA+) medium. (D) Imaging analysis of mTOR localization with lysosome in WT or RagA/B-deficient aTreg cells (isolated from the indicated mice and stimulated overnight with α-CD3-CD28 mAb and IL-2) under the selective conditions. Right, quantification of lysosomal mTOR in WT or RagA/B-deficient aTreg cells (> 30 cells per condition from 2 biological replicates). Scale bar: 5 μm. (E) Immunoblot analysis of phosphorylated and total S6 and 4E-BP1 in Treg cells pretreated with or without amino acids, followed by α-CD3-CD28 mAb crosslinking in the presence or absence of amino acids. Bottom, quantification of p-S6 and p-4E-BP1 normalized to β-actin (n = 6). (F) Immunoblot analysis of p-S6 and p-4E-BP1 in Treg cells from WT or Cd4CreRragafl/flRragbfl/fl mice after stimulation with α-CD3-CD28 mAb crosslinking. Bottom, quantification of p-S6 and p-4E-BP1 normalized to β-actin (n > 2). (G) CD71 expression and cell size (FSC-A) in Treg cells stimulated with α-CD3-CD28 mAb overnight in the presence or absence of amino acids. Bottom, quantification of CD71 expression and FSC-A (n = 5). (H) Treg cells from WT or Cd4CreRragafl/flRragbfl/fl mice were stimulated with α-CD3-CD28 mAb overnight for analysis of CD71 expression and cell size. Bottom, quantification of CD71 expression and FSC-A (n = 3). Numbers in histograms show the mean fluorescence intensity. Data in graphs represent mean ± SEM. ns, not significant; *p < 0.05; **p < 0.01; ***p < 0.001; ****p < 0.0001; two-tailed Student’s t-test (A, B, F, G, H), one-way ANOVA (C, D), or two-way ANOVA (E). Data are representative of one (H), two (D, RagA/B-deficient Treg cells; F, 5 min timepoint), three (D, WT Treg cells), five (F, RagA/B-deficient Treg cells at 0 or 15 min; H) or six (E, F, WT Treg cells at 0 or 15 min), or pooled from two (A–C, F, 5 min timepoint) or three (E, F, 0 and 15 min timepoints; G) independent experiments. See also Figure S1.
Figure 2.
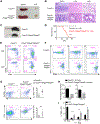
Figure 2.. Development of fatal autoimmunity upon Treg cell-specific deletion of RagA/B
(A) Representative image of the spleen and peripheral lymph nodes (pLN) from 1.5-month-old Foxp3Cre or Foxp3CreRragafl/flRragbfl/fl mice. (B) H&E staining of the colon, liver and lung of Foxp3Cre or Foxp3CreRragafl/flRragbfl/fl mice. Scale bar: 200 μm. (C) Image of Foxp3Cre or Foxp3CreRragafl/flRragbfl/fl mice. (D) Survival of Foxp3Cre or Foxp3CreRragafl/flRragbfl/fl mice. (E) FACS analysis of CD44 and CD62L expression on splenic CD4+Foxp3 (depicted as CD4+) and CD8+ T cells from Foxp3Cre or Foxp3CreRragafl/flRragbfl/fl mice. (F) FACS analysis of IFN-γ, IL-4, and IL-17 expression in splenic CD4+Foxp3 cells from Foxp3Cre or Foxp3CreRragafl/flRragbfl/fl mice. (G) FACS analysis of PD-1+CXCR5+ T cells (top) and GL-7+FAS+FH GC B cells (bottom). Right, Quantification of TFH cell and GC B cell numbers (n ≥ 5). (H) Quantification of ICOS and CTLA4 expression in CD45.2+YFP+ Treg cells from Foxp3Cre or Foxp3CreRragafl/flRragbfl/fl mixed BM chimeras (n = 3 for CTLA4; n = 7 for ICOS). (I) Suppressive activity of Treg cells from WT or Cd4CreRragafl/flRragbfl/fl mice (n = 3). Numbers on plots are the frequency of cells in indicated gates. Data in graphs represent mean ± SEM. ns, not significant; *p < 0.05; **p < 0.01; ***p < 0.001; ****p < 0.0001; two-tailed Student’s t-test. Data are representative of two (B) or three (A, C, E–G, I), or pooled from two (H) or four (G) independent experiments. See also Figure S2.
Figure 3.
Figure 3.. RagA promotes eTreg cell accumulation and function
(A) FACS analysis of CD44 and CD62L expression on CD45.2+ Foxp3-YFP+ Treg cells from Foxp3Cre or Foxp3CreRragafl/flRragbfl/fl mixed BM chimeras. Right, quantification of frequency and number of CD44hiCD62Llo eTreg cells in the spleen (n ≥ 3). (B) FACS analysis of Foxp3-YFP+ Treg cells in the colon lamina propria (cLP) of Foxp3Cre or Foxp3CreRragafl/flRragbfl/fl chimeras. Right, quantification of the frequency and number of Treg cells in the cLP (n ≥ 4). (C) Quantification of the frequency and number of Treg cells in the cLP of Foxp3Cre or Foxp3CreRragafl/flRragbfl/fl mice (n ≥ 3). (D–H) Foxp3Cre/DTR or Foxp3Cre/DTRRragafl/fl mice were treated with diphtheria toxin (DT). (D) Image of spleen and peripheral lymph nodes (pLN). (E) Quantification of splenic Foxp3-YFP+ Treg cell frequency (n = 8). (F) Quantification of CD44hiCD62LloFoxp3-YFP+ eTreg cell frequency (n = 8). (G) Quantification of CD44+CD62L CD4+Foxp3 T cell frequency in the spleen and pLN (n = 8). (H) Quantification of the frequencies of IFN-γ +, IL-4+, and IL-17+ CD4+Foxp3 T cells (n = 8). Numbers on plots are the frequency of cells in indicated gates. Data in graphs represent mean ± SEM. ns, not significant; *p < 0.05; **p < 0.01; ***p < 0.001; ****p < 0.0001; two-tailed Student’s t-test. Data are representative of four (D), or pooled from three (C) or four (A, B, E–H) independent experiments. See also Figure S3.
Figure 4.
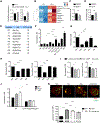
Figure 4.. Amino acids maintain mTORC1 activity in aTreg cells
(A) CD98 (n = 3) or Slc7a1 (n = 5) expression on Treg cells stimulated with IL-2 or α-CD3-CD28 mAb plus IL-2 overnight (aTreg cells). (B) Heatmap showing the relative accumulation of amino acids in Treg cells stimulated with or without α-CD3-CD28 mAb. (C and D) p-S6 in aTreg cells rested for 1 h in complete medium in the presence of DMSO, bafilomycin A1 (BafA1) (C), or cycloheximide (CHX) (D) (n = 4). (E) Fold-change (FC) of p-S6 signals upregulated by 1.5-fold or more in aTreg cells cultured in PM-M2 amino acid screening plates for 30 min. (F) p-S6 signals in aTreg cells that were rested in amino-acid free (AA−) medium for 1 h, and then restimulated for 30 min under the indicated conditions. Leu, leucine; Gln, glutamine; Arg, arginine; AA+, full amino acids (n > 6). (G) p-S6 signals in aTreg cells incubated for 1 h with amino acid-sufficient medium (AA+) or medium lacking Arg (Arg−), Leu (Leu−), Gln (Gln−), or all amino acids (AA−). (H) Treg cells were stimulated for three days in AA+, Arg−, Leu−, or Gln− medium. Quantification of the normalized CTLA4 and ICOS expression (n = 4). (I) Normalized CTLA4 and ICOS expression in Treg cells isolated from mice fed L-amino acid control, arginine-deficient (Arg– diet), or leucine-deficient (Leu– diet) diets (n = 8). (J) Treg cells from WT or Cd4CreRragafl/flRragbfl/fl mice were activated to generate aTreg cells, following by resting and restimulation for 30 min under the indicated conditions for quantification of p-S6 signals (n = 2). (K) Imaging analysis of Tsc2 and LAMP1 in aTreg cells incubated with amino acids for 90 min (AA+), without amino acids (AA−) or Arg (Arg−) for 90 min, or starved for amino acids for 60 min followed by amino acid refeeding for 30 min (AA− [barb2right] AA+). Scale bar: 5 mm (n = 2 biological replicates and > 30 cells per condition). Data in graphs represent mean ± SEM. ns, not significant; *p < 0.05; **p < 0.01; ***p < 0.001; ****p < 0.0001; two-tailed Student’s t-test (A, C, D) or one-way ANOVA (F–K). Data are representative of one (B, J) or two (A, CD98; E, K), or pooled from two (A, Slc7a1; C, D, G, H), four (I) or five (F) independent experiments. See also Figure S4.
Figure 5.
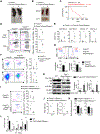
Figure 5.. Rheb1/2 deletion disrupts eTreg cell accumulation and function
(A) Image of 1.5-month-old Foxp3Cre or Foxp3CreRhebfl/flRhebl1−/− mice. Arrows indicate skin inflammation and alopecia. (B) Image of the spleen and peripheral lymph nodes (pLN) from Foxp3Cre or Foxp3CreRhebfl/flRhebl1−/− mice. (C) Survival of Foxp3Cre or Foxp3CreRhebfl/flRhebl1−/− mice. (D) FACS analysis of CD44 and CD62L expression on splenic CD4+Foxp3 and CD8+ T cells from Foxp3Cre or Foxp3CreRhebfl/flRhebl1−/− mice. Right, quantification of the frequencies of CD44+CD62LCD4+Foxp3 and CD44+CD62LCD8+ T cells in the spleen (n = 4). (E) Quantification of the frequencies of the indicated cytokine-producing CD44hiCD8+ and CD44hiCD4+Foxp3 (depicted as CD4+) T cells in the spleen of Foxp3Cre or Foxp3CreRhebfl/flRhebl1−/− mice (n ≥ 5). (F) FACS analysis of PD-1+CXCR5+ TFH cells (top) and GL-7+FAS+ GC B cells (bottom). Right, Quantification of TFH and GC B cell numbers (n = 5). (G) Splenic Foxp3-YFP+ Treg from Foxp3Cre or Foxp3CreRhebfl/flRhebl1−/− mice were stimulated with α-CD3-CD28 mAb for 4 h. Top, FACS analysis of p-S6 and p-4E-BP1. Bottom, quantification of p-S6 and p-4E-BP1 signals (n > 4). (H) Immunoblot analysis of phosphorylated and total S6 or 4E-BP1 in Treg cells from WT or Cd4CreRhebfl/flRhebl1−/− mice after stimulation with α-CD3-CD28 mAb crosslinking for the indicated times. The space indicates removal of irrelevant lanes. Right, quantification of p-S6 and p-4E-BP1 normalized to β-actin (n = 4). (I) FACS analysis of CD44 versus CD62L expression on splenic Foxp3-YFP+ Treg cells from Foxp3Cre/+Rhebl1+/− or −/− or Foxp3Cre/+Rhebfl/flRhebl1−/− mice. Right, quantification of the numbers of splenic CD44hiCD62Llo eTreg cells (n ≥ 4). (J) Quantification of the frequency and number of Foxp3-YFP+ Treg cells in the colon lamina propria (cLP) of Foxp3Cre/+Rhebl1−/− or Foxp3Cre/+Rhebfl/flRhebl1−/− mice (n ≥ 2). (K) Quantification of ICOS and CTLA4 expression in splenic Foxp3-YFP+ Treg cells from Foxp3Cre/+Rhebl1+/− or −/− or Foxp3Cre/+Rhebfl/flRhebl1−/− mice (n > 4). (L) Suppressive activity of Treg cells from WT or Cd4CreRhebfl/flRhebl1−/− mice (n = 6). Numbers on plots are the frequency of cells in indicated gates. Numbers in histograms show the mean fluorescence intensity. Data in graphs represent mean ± SEM. ns, not significant; *p < 0.05; **p < 0.01; ***p < 0.001; two-tailed Student’s t-test. Data are representative of one (H, L) or more than four (A, B), or pooled from one (J), two (I, K), three (D, G) or four (E, F) independent experiments. See also Figure S5.
Figure 6.
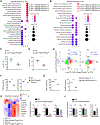
Figure 6.. Regulation of transcriptional and metabolic programs by RagA/B and Rheb1/2
(A and B) Treg cells from WT or Cd4CreRragafl/flRragbfl/fl (A) and WT or Cd4CreRhebfl/flRhebl1−/− mice (B) were stimulated with α-CD3-CD28 mAb for 0 or 8 h. Gene set enrichment analysis identified upregulated (red) and downregulated (blue) Hallmark pathways in RagA/B-deficient Treg cells (A) or Rheb1/2-deficient Treg cells (B), as shown on bubble plots. (C and D) Quantification of the frequency of splenic Ki-67+ Treg cells from WT or Cd4CreRragafl/flRragbfl/fl (C; n = 4) or WT or Cd4CreRhebfl/flRhebl1−/− mice (D; n ≥ 3). (E) Fold-change (FC) versus FC plot analysis of genes expressed by RagA/B-deficient Treg cells with Rheb1/2-deficient Treg cells (versus WT controls in each case) at 0 h (left) and 8 h (right). R, Pearson’s correlation coefficient. Colors indicate regions where genes are only differentially-expressed (DE) in RagA/B- or Rheb1/2-deficient Treg cells. (F and G) Treg cells from WT or Cd4CreRragafl/flRragbfl/fl mice (F) or WT or Cd4CreRhebfl/flRhebl1−/− mice (G) were stimulated with α-CD3-CD28 mAb for 16 h, followed by Seahorse metabolic flux analysis of mitochondrial oxygen consumption rate (OCR) and extracellular acidification rate (ECAR) (n = 3). (H) Heatmap showing DE mitochondrial genes in WT or RagA/B-deficient Treg cells at 0 and 8 h. (I) Quantification of TMRM, CellROX, and Mitotracker in splenic Treg cells from WT or Cd4CreRragafl/flRragbfl/fl mice (n = 6 for TMRM and CellROS; n = 3 for Mitotracker). (J) Quantification of TMRM, CellROX, and Mitotracker in splenic Treg cells from WT or Cd4CreRhebfl/flRhebl1−/− mice (n = 3). Data in graphs represent mean ± SEM. ns, not significant; **p < 0.01; ***p < 0.001; two-tailed Student’s t-test. Data are representative of one (A, B, E, H, I, Mitotracker; J) or three (F, G), or pooled from three (C, D, I, TMRM and CellROX) independent experiments. See also Figure S6.
Figure 7.
Figure 7.. eTreg cell signatures are differentially regulated by RagA/B and Rheb1/2
(A) Functional enrichment of Hallmark pathways in genes upregulated in the absence of RagA/B or Rheb1/2 at 0 or 8 h, as shown on bubble plots. (B and C) Quantification of CD25 expression on Treg cells from WT or Cd4CreRragafl/flRragbfl/fl mice (B; n = 5), or WT or Cd4CreRhebfl/flRhebl1−/− mice (C; n > 4). (D) Fold-change (FC) versus FC plot analysis (x-axis, 0 h; y-axis, 8 h) of genes expressed by RagA/B-deficient Treg cells versus WT (left), or Rheb1/2-deficient Treg cells versus WT (right). The blue dots show downregulated and the red dots show upregulated eTreg cell signature genes. The numbers show differentially-expressed genes. The p-value indicates enrichment for eTreg cell signature genes. (E and F) WT and RagA/B-deficient Treg cells were transduced with indicated vectors and stimulated with α-CD3-CD28 mAb for 3 h for quantification of p-S6 (E) or FSC-A (F) in pmCherry+ Treg cells transduced with the indicated vectors (n = 6). Data in graphs represent mean ± SEM. ns, not significant; *p < 0.05; **p < 0.01; ***p < 0.001; two-tailed Student’s t-test (B, C) or one-way ANOVA (E, F). Data are representative of one (A, D), or pooled from two (F) or three (B, C, E) independent experiments. See also Figure S7.

References

    1. Abu-Remaileh M, Wyant GA, Kim C, Laqtom NN, Abbasi M, Chan SH, Freinkman E, and Sabatini DM (2017). Lysosomal metabolomics reveals V-ATPase- and mTOR-dependent regulation of amino acid efflux from lysosomes. Science 358, 807–813. - PMC - PubMed
    1. Bae S, Park J, and Kim JS (2014). Cas-OFFinder: a fast and versatile algorithm that searches for potential off-target sites of Cas9 RNA-guided endonucleases. Bioinformatics 30, 1473–1475. - PMC - PubMed
    1. Baixauli F, Acin-Perez R, Villarroya-Beltri C, Mazzeo C, Nunez-Andrade N, Gabande-Rodriguez E, Ledesma MD, Blazquez A, Martin MA, Falcon-Perez JM, et al. (2015). Mitochondrial Respiration Controls Lysosomal Function during Inflammatory T Cell Responses. Cell Metab 22, 485–498. - PMC - PubMed
    1. Buck MD, Sowell RT, Kaech SM, and Pearce EL (2017). Metabolic Instruction of Immunity. Cell 169, 570–586. - PMC - PubMed
    1. Calvo SE, Clauser KR, and Mootha VK (2016). MitoCarta2.0: an updated inventory of mammalian mitochondrial proteins. Nucleic Acids Res 44, D1251–1257. - PMC - PubMed

Publication types

MeSH terms