. 2020 Mar-Apr;13(2):287-301.
doi: 10.1016/j.brs.2019.10.014. Epub 2019 Oct 18.

Direct current stimulation boosts hebbian plasticity in vitro

Affiliations

Direct current stimulation boosts hebbian plasticity in vitro

Greg Kronberg et al. Brain Stimul. 2020 Mar-Apr.

Abstract

Background: There is evidence that transcranial direct current stimulation (tDCS) can improve learning performance. Arguably, this effect is related to long term potentiation (LTP), but the precise biophysical mechanisms remain unknown.

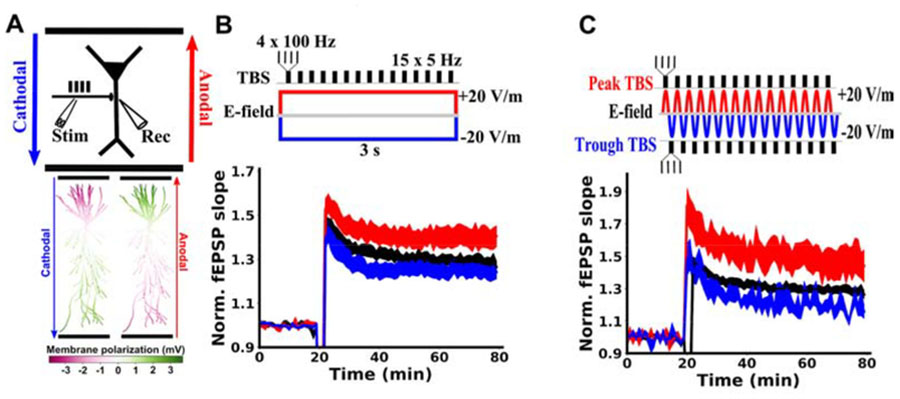
Hypothesis: We propose that direct current stimulation (DCS) causes small changes in postsynaptic membrane potential during ongoing endogenous synaptic activity. The altered voltage dynamics in the postsynaptic neuron then modify synaptic strength via the machinery of endogenous voltage-dependent Hebbian plasticity. This hypothesis predicts that DCS should exhibit Hebbian properties, namely pathway specificity and associativity.

Methods: We studied the effects of DCS applied during the induction of LTP in the CA1 region of rat hippocampal slices and using a biophysical computational model.

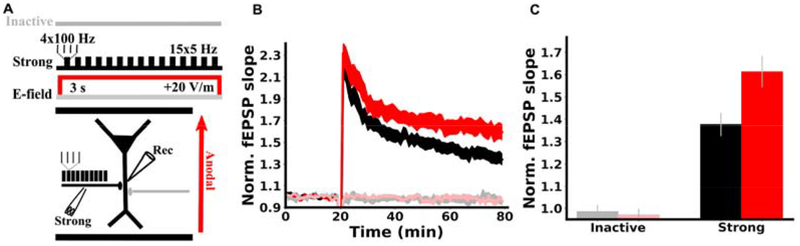
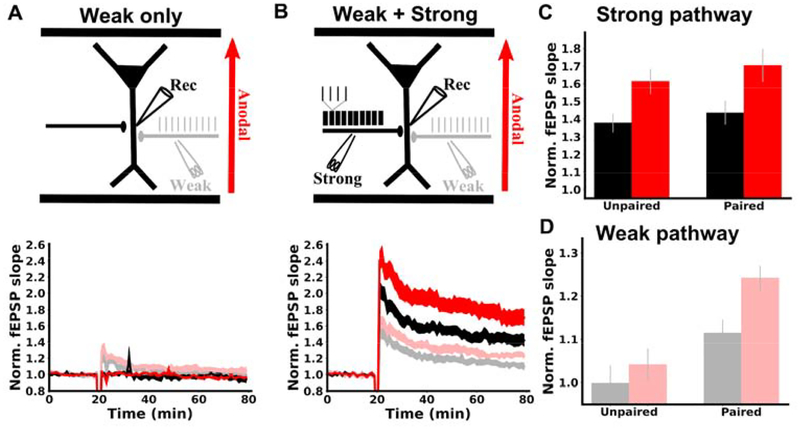
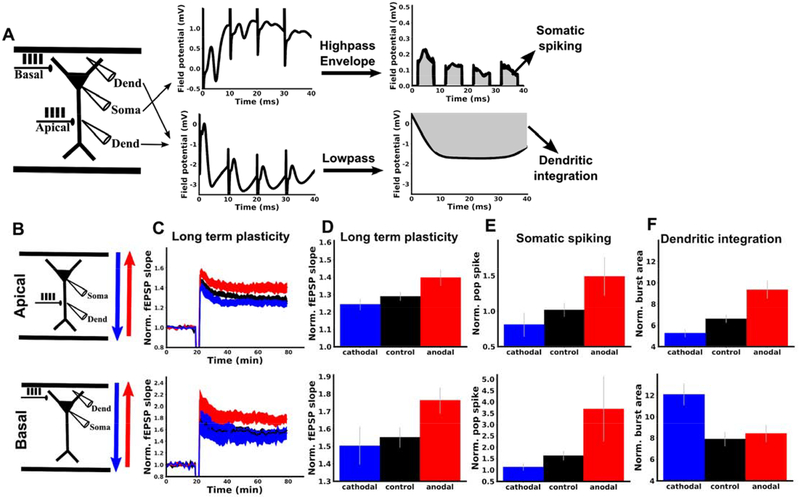
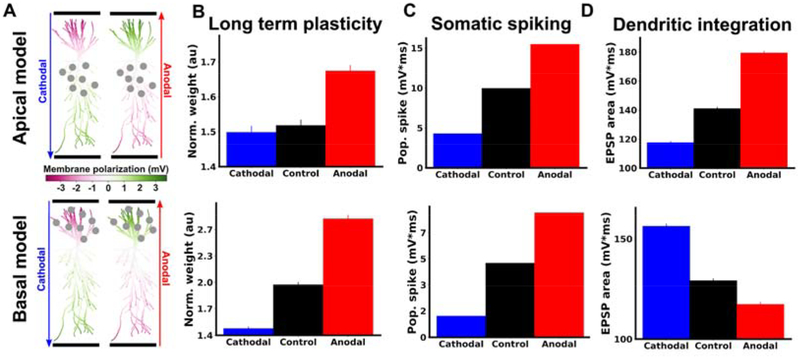
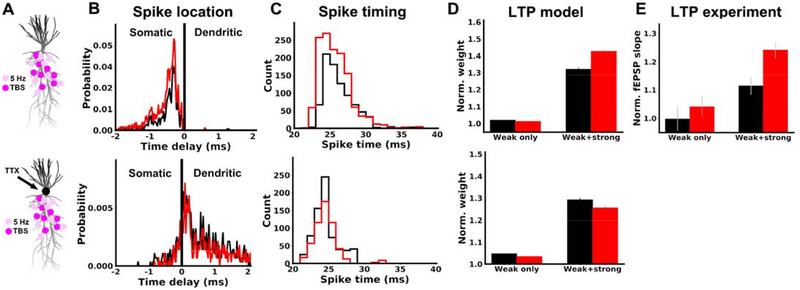
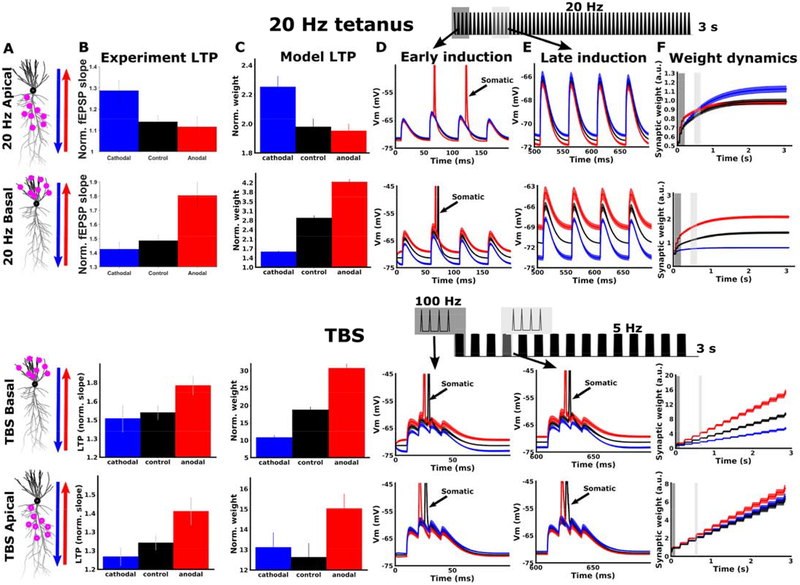
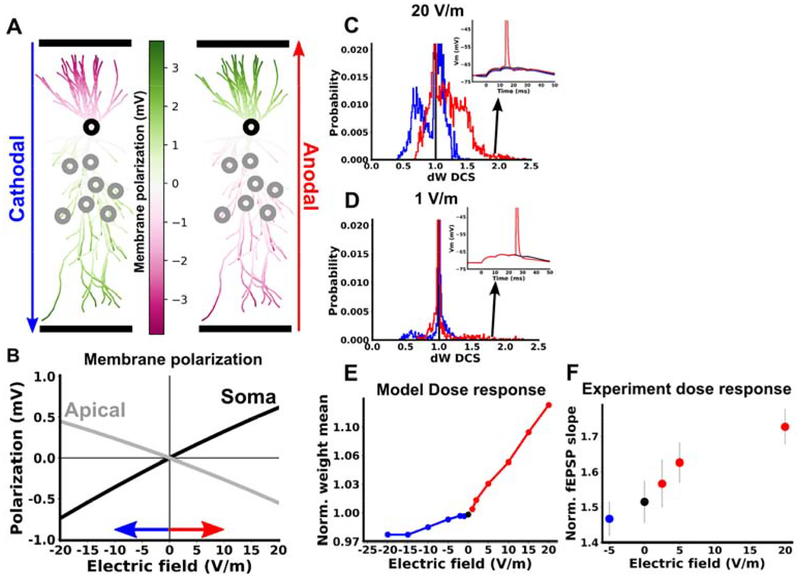
Results: DCS enhanced LTP, but only at synapses that were undergoing plasticity, confirming that DCS respects Hebbian pathway specificity. When different synaptic pathways cooperated to produce LTP, DCS enhanced this cooperation, boosting Hebbian associativity. Further slice experiments and computer simulations support a model where polarization of postsynaptic pyramidal neurons drives these plasticity effects through endogenous Hebbian mechanisms. The model is able to reconcile several experimental results by capturing the complex interaction between the induced electric field, neuron morphology, and endogenous neural activity.

Conclusions: These results suggest that tDCS can enhance associative learning. We propose that clinical tDCS should be applied during tasks that induce Hebbian plasticity to harness this phenomenon, and that the effects should be task specific through their interaction with endogenous plasticity mechanisms. Models that incorporate brain state and plasticity mechanisms may help to improve prediction of tDCS outcomes.

Keywords: Hebbian; LTP; Synaptic plasticity; Transcranial direct current stimulation; Transcranial electrical stimulation; tDCS.


Conflict of interest statement

Declaration of competing interest LCP and MB have shares in Soterix Medical Inc and are listed as inventors in patents of the City University of New York related to high-definition tDCS.

Figures

Figure 1.
Figure 1.. Soma-depolarizing electric fields enhance TBS-induced LTP in hippocampal Schaffer Collateral pathway.
A) Top: Schematic of the experimental setup, showing the orientation of anodal (red) and cathodal (blue) electric fields generated by parallel wires (black horizontal lines). Location of stimulation (Stim) with TBS and recording (Rec) of field excitatory postsynaptic potentials (fEPSP) are indicated relative to a CA1 pyramidal neuron soma (black triangle). Bottom: Membrane polarization throughout a model pyramidal neuron in response to 20 V/m anodal (red) or cathodal (blue) DCS. Green compartments are depolarized due to DCS, while magenta compartments are hyperpolarized by DCS. B) Constant current stimulation applied during TBS modulates the resulting LTP measured as a change in fEPSP normalized to baseline. C) Alternating current stimulation (5Hz) was applied and TBS bursts were timed to either the peak (red) or the trough (blue) of the sinusoidal alternating current. Note that the applied electric field at the peak of the alternating current is identical to anodal constant current, as is the case for the trough of the alternating current and cathodal constant current. The effects of alternating currents are similar to those of the analogous constant current paradigm, indicating that plasticity modulation is consistent with the instantaneous incremental membrane polarization on a millisecond timescale. LTP induction is applied at the 20 minute mark. All data are normalized to the mean of the 20 baseline responses before induction and are represented as mean±s.e.m across slices.
Figure 2.
Figure 2.. DCS effect is specific to the potentiated pathway.
A) Schematic of the experimental setup. Two synaptic pathways are monitored before and after plasticity induction. During induction, one pathway is activated with TBS (black, strong), while the other pathway is inactive (grey), and anodal DCS is applied across the slice throughout the duration of induction (3 s, red). B) Plasticity is pathway specific and so are DCS effects. LTP was observed only in the pathway that received TBS (black trace), demonstrating pathway specificity. Anodal DCS enhanced LTP only in the potentiated pathway (red vs black) and had no effect on the inactive pathway (light red vs. gray), upholding Hebbian specificity. fEPSP slopes are normalized to the mean of the 20 of baseline responses prior to induction. Induction is applied at the 20 minute mark. C) Summary of pathway specific effects of DCS. The mean of the last 10 normalized slopes (51–60 min after induction) are used for each slice. Data are represented as mean±s.e.m across slices.
Figure 3.
Figure 3.. DCS enhances associativity between synaptic pathways.
A) Top: schematic of experimental design. Two synaptic pathways were monitored. During induction, one pathway was weakly activated at 5 Hz with 15 pulses (grey), while the other pathway was inactive (black). Anodal DCS was applied throughout induction (3 s, red). Bottom: weak synaptic activation had no lasting effect on synaptic strength in either pathway with DCS (red, light red) or without DCS (grey, black). B) Top: schematic of experimental design. Again, two synaptic pathways were monitored. Now during induction, one pathway was activated with a TBS protocol (strong, black). The other pathway was activated with 15 pulses at 5 Hz (weak, grey). Weak pathway pulses were temporally aligned to the second pulse in each TBS burst. Bottom: without DCS, the strong pathway was potentiated (black) and the weak pathway was now also potentiated (grey), demonstrating associative plasticity between these pathways. With DCS, LTP was enhanced in the strong pathway (red) and the weak pathway (light red), demonstrating that the associativity between pathways was enhanced. C) Summary of LTP experiments in the strong pathway. Pairing with the weak pathway did not increase strong pathway LTP, and DCS had a similar effect on LTP in both cases. D) Summary of LTP experiments in the weak pathway. fEPSP slopes are normalized to the mean of the 20 of baseline responses prior to induction. Induction is applied at the 20 minute mark in panels A,B. The mean of the last 10 normalized slopes (51–60 min after induction) are used for each slice in panels C,D. Data are represented as mean±s.e.m. across slices.
Figure 4.
Figure 4.. DCS modulation of TBS-LTP is consistent with modulation of somatic spiking rather than dendritic integration.
LTP was induced with TBS in either apical (top row, B-F) or basal (bottom row, B-F) dendritic regions of CA1. TBS induction was paired with anodal (red), cathodal (blue), or no DCS (black). A) Schematic of experiments and methods for deriving somatic and dendritic activity metrics. For both apical and basal protocols, one recording electrode was placed in the dendrites (Dend) near the bipolar stimulating electrode (Apical or Basal) and one electrode was placed near the CA1 somatic layer (Soma). Examples of raw voltage traces from each recording electrode during a single burst of the induction protocol are displayed in the middle panel. To derive a measure of dendritic integration, the dendritic recording was low-pass filtered, and the integral of this filtered signal was taken for each burst during TBS (gray area). To derive a measure of somatic population spiking, the somatic recording was high-pass filtered, and the integral of this signal’s envelope during each burst was used (gray area; excludes periods of stimulation artefacts; see Methods). B) Schematic of apical (top row) and basal (bottom row) experiments. C) Anodal DCS (red) boosts LTP in both and apical and basal dendrites compared to control (black). Cathodal DCS (blue) had no significant effect in either apical of basal dendrites. TBS was applied with or without DCS at the 20 minute mark. Note that the top panel is identical to Figure 1A (shown again here for comparison). D) Summary of the data in C. The mean of the last ten normalized responses were used for each slice. E) Population spiking measured for the first bipolar input pulse of the last burst (see Supplemental Figure S2C for all pulses during induction). F) Population dendritic integration for the last burst of TBS (see Supplemental Figure S2F for all bursts during induction). All data normalized to the mean of the 20 baseline responses before induction and error bars represent standard error of the mean.
Figure 5.
Figure 5.. Model captures the effects of DCS on long term potentiation, somatic spiking and dendritic integration.
A) Membrane polarization throughout model pyramidal neuron in response to 20 V/m anodal (red) or cathodal (blue) DCS. Green compartments are depolarized due to DCS, while magenta compartments are hyperpolarized by DCS. Gray circles indicate the location of synapses in apical (top row) or basal (bottom row) compartments that are activated with TBS. B) Model predictions of changes in synaptic weights qualitatively match LTP experiments (c.f. Figure 4D). The vertical axis (Norm. weight) is the average weight of all activated synapses at the end of simulation, calculated offline using the learning rule (41). C) Effects of DCS on somatic activity qualitatively match experimental measurements (c.f. Figure 4E). The vertical axis is the average across all neuron somas of the integral of the high-pass filtered voltage envelope (see Methods). D) Effects of DCS on dendritic integration qualitatively match experimental measurements (c.f. Figure 4F). The vertical axis is the average across all recorded dendritic locations of the high-pass filtered envelope of the voltage (see Methods).
Figure 6.
Figure 6.. Boost of associative LTP is also explained by the effect of DCS on somatic spikes in computational model.
Top row: A) Simulated neuron morphology, showing an example of how synapses are distributed in the weak (5 Hz, light pink) and strong (TBS, magenta) pathways. B) Distribution of time delays between spikes observed in the soma and at weak pathway synapses for 20 V/m anodal stimulation (red) or control (black). Negative time delays correspond to spikes that occur in the soma first. Due to variable propagation delays between synapses, it is possible for a spike initiated in the dendrite to reach the soma before other synapses. This produces a negative delay between the soma and these delayed synapses, even though the spike was dendritically initiated. It is not possible however, for a spike initiated in the soma to show a positive delay. C) Distribution of spike times recorded at all weak pathway synapses. Spike times are shown relative to the onset of the corresponding burst. D) Model prediction comparing plasticity in the weak pathway when it is unpaired (weak only) and paired (weak+strong). The vertical axis (Norm. weight) is the average weight of all weak pathway synapses at the end of simulation, calculated offline using the voltage-based learning rule (41). E) Experimental data (same as Figure 3D) shown again for comparison with panel D here. Both model and experiment show that anodal DCS increases LTP in the weak pathway only when it is paired with strong pathway activation. Bottom row: simulations and methods are identical to the top row, with two exceptions. First, we emulated the application of locally applied somatic TTX by setting voltage-gated sodium conductance to zero in the soma and axon, preventing the initiation of spikes in these compartments. Second, the number of synapses in each pathway was doubled, increasing the likelihood of spike generation, which now occurred in the dendrite. The testable prediction of the model is that in the presence of TTX now DCS will no longer boost LTP.
Figure 7.
Figure 7.. Model captures interaction between dendritic location and induction protocol.
A) Simulated neuron morphology, showing distribution of activated synapses for 20 Hz (top two rows) and TBS (bottom two rows). Arrows indicate the direction of the DC fields for anodal (red) and cathodal (blue) stimulation. B) Experimental LTP results for each condition. The vertical axis is the average of the last ten normalized fEPSP responses. The top two panels are reproduced from data in (14). The bottom two panels are identical to figure 4D, shown again here for comparison. C) Model LTP predictions qualitatively match experimental LTP results (c.f. C; same direction of DCS effect). The vertical axis (Norm. weight) is the average weight of all activated synapses at the end of simulation, calculated offline using the learning rule of (41). D) Example simulated voltage traces for individual cells recorded only at activated synapses during the first four input pulses. Traces are averaged over all activated synapses for the example cell. Spikes that back-propagate from the soma are indicated with arrows. E) Same as D, but at a later time point in the simulation (pulses 10–13 for 20 Hz tetanic stimulation; pulses 13–16 for TBS simulations). Note that for 20 Hz stimulation synaptic depolarization is reduced due to short term depression and somatic spiking ceases very early in the simulation. During this subthreshold period, DCS causes a small shift in membrane potential and the resulting plasticity. Since DCS causes opposite subthreshold polarization in apical and basal dendrites, the effect on LTP is also opposite in apical and basal dendrites (C, top two rows). For TBS simulations, recovery from short term depression between bursts allows bursts later in the simulation to produce somatic spikes. Plasticity throughout the simulation is controlled by somatic spikes, and is similar in apical and basal dendrites (C, bottom two rows) F) Dynamics of synaptic weights during the full simulation, averaged over the entire population of activated synapses. For TBS simulations, the weight change is approximately linear in the number of bursts, as each successive burst is equally effective at inducing plasticity. For 20 Hz stimulation, the weight change saturates with the number of pulses, as each successive pulse is weaker due to short term depression. Only the weight at the end of the simulation is used to predict the resulting LTP in experiments (C). Gray boxes in F indicate time periods for early (dark gray) and late induction (light gray) that are plotted in D and E, respectively. A schematic of the input pulse train and relative timing of early (dark gray) and late (light gray) induction pulses are shown at the top. All data are represented as mean±s.e.m.
Figure 8.
Figure 8.. Dose response for computational model of TBS in apical dendrites.
A) Membrane polarization of a CA1 pyramidal cell in response to 20 V/m cathodal (left) and anodal (right) electric field. B) Membrane polarization in response to varying electric field magnitude. On the horizontal axis positive values correspond to anodal DCS and negative values correspond to cathodal DCS. The gray curve is averaged over all segments in the apical dendrite, and the black curve is measured at the soma. C,D) Distribution of DCS effects on synaptic weight in response to TBS in apical dendrites. The horizontal axis is the the final synaptic weight during a simulation with DCS divided by the final synaptic weight in the same cell under control conditions. ΔWDCS therefore measures the change in weight caused by DCS for each synapse. Inset shows example voltage traces for synapses in the tail of the distribution. These synapses correspond to cases where the control simulation brought the cell to slightly below threshold, such that DCS was able to cause firing and produce a large change in the weight. E) Mean of the synaptic weight change (ΔWDCS) due to TBS, averaged over all simulated apical synapses, as a function of DCS electric field. F) Experimental LTP as a function of DCS electric field. All data are represented as mean±s.e.m.

References

    1. Mancuso LE, Ilieva IP, Hamilton RH, Farah MJ. Does Transcranial Direct Current Stimulation Improve Healthy Working Memory?: A Meta-analytic Review. J Cogn Neurosci. 2016. April 7;28(8):1063–89. - PubMed
    1. Kekic M, Boysen E, Campbell IC, Schmidt U. A systematic review of the clinical efficacy of transcranial direct current stimulation (tDCS) in psychiatric disorders. J Psychiatr Res. 2016. March 1;74:70–86. - PubMed
    1. Dedoncker J, Brunoni AR, Baeken C, Vanderhasselt M-A. A Systematic Review and Meta-Analysis of the Effects of Transcranial Direct Current Stimulation (tDCS) Over the Dorsolateral Prefrontal Cortex in Healthy and Neuropsychiatric Samples: Influence of Stimulation Parameters. Brain Stimulat. 2016. July 1;9(4):501–17. - PubMed
    1. Tedesco Triccas L, Burridge JH, Hughes AM, Pickering RM, Desikan M, Rothwell JC, et al. Multiple sessions of transcranial direct current stimulation and upper extremity rehabilitation in stroke: A review and meta-analysis. Clin Neurophysiol. 2016. January 1;127(1):946–55. - PubMed
    1. Santarnecchi E, Brem A-K, Levenbaum E, Thompson T, Kadosh RC, Pascual-Leone A. Enhancing cognition using transcranial electrical stimulation. Curr Opin Behav Sci. 2015. August 1;4:171–8.

Publication types