Review
. 2020 Feb:131:115107.
doi: 10.1016/j.bone.2019.115107. Epub 2019 Oct 24.

Development of protocols for the first serial block-face scanning electron microscopy (SBF SEM) studies of bone tissue

Affiliations
Review

Development of protocols for the first serial block-face scanning electron microscopy (SBF SEM) studies of bone tissue

Patricia Goggin et al. Bone. 2020 Feb.

Abstract

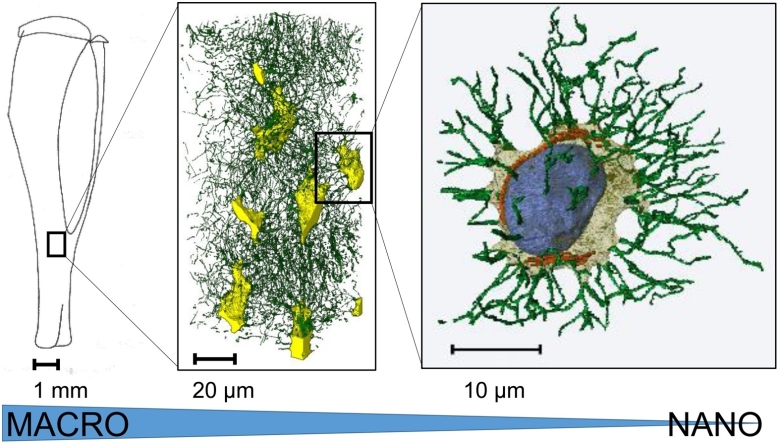
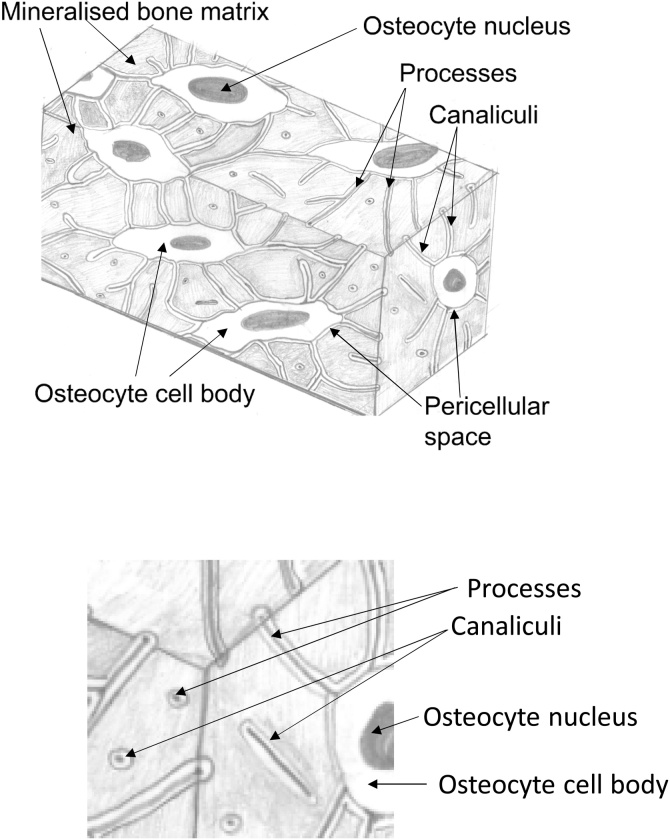
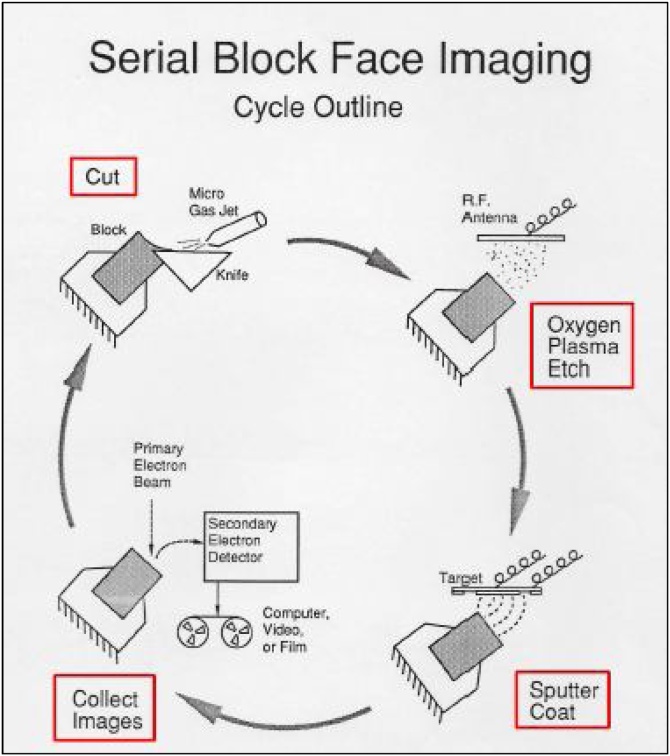
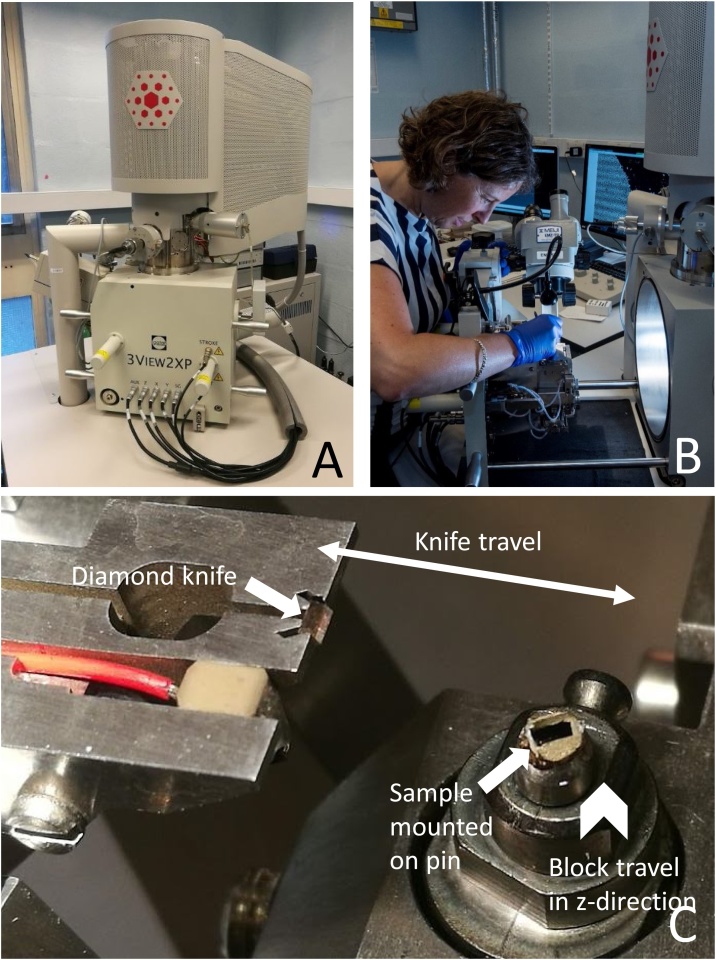
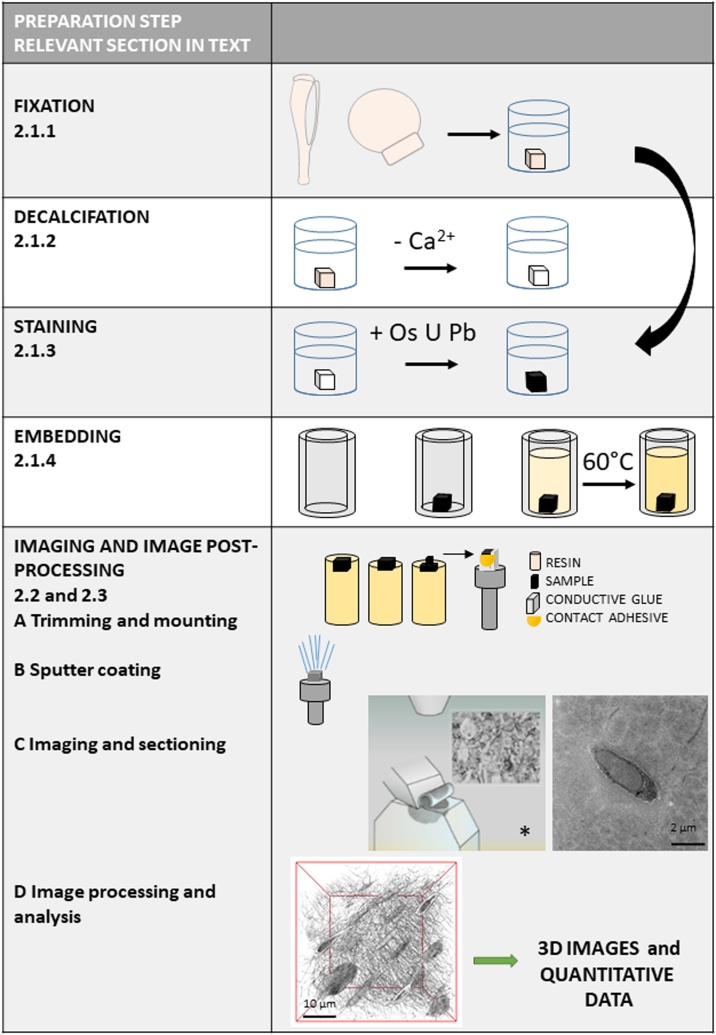
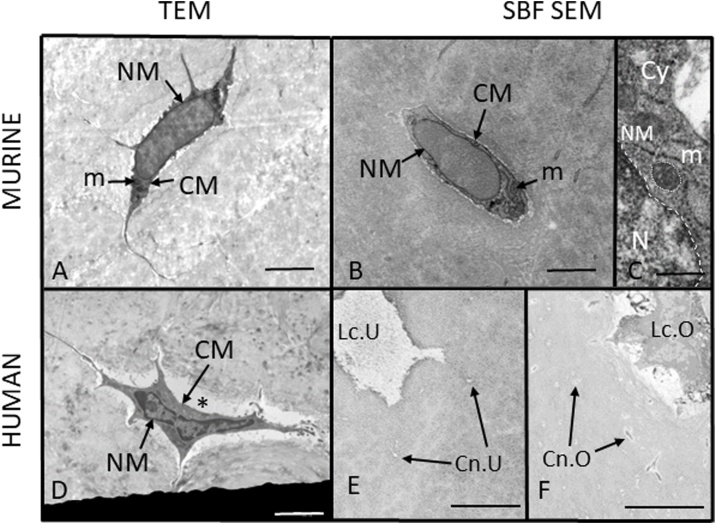
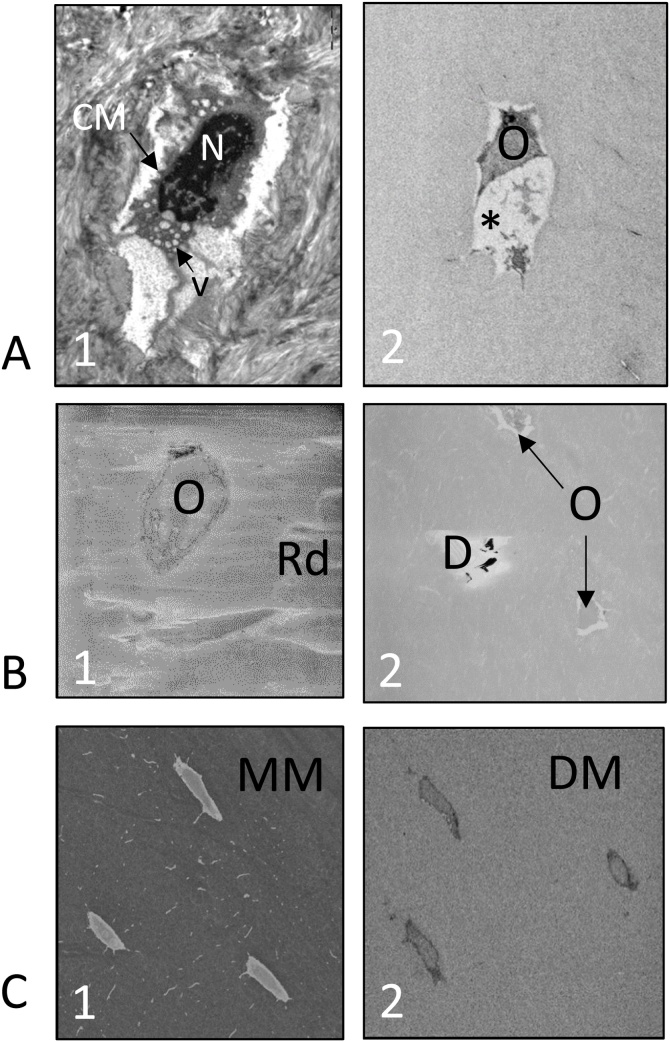
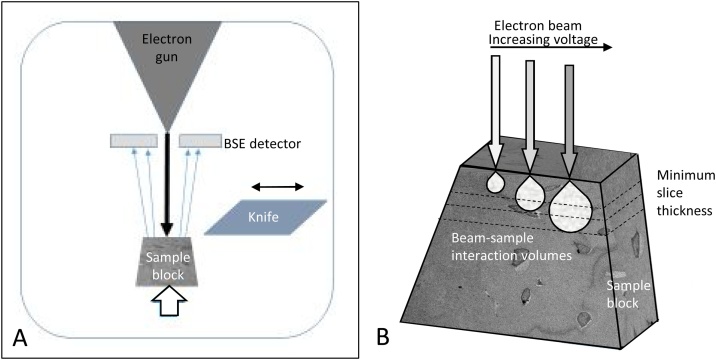
There is an unmet need for a high-resolution three-dimensional (3D) technique to simultaneously image osteocytes and the matrix in which these cells reside. In serial block-face scanning electron microscopy (SBF SEM), an ultramicrotome mounted within the vacuum chamber of a microscope repeatedly sections a resin-embedded block of tissue. Backscattered electron scans of the block face provide a stack of high-resolution two-dimensional images, which can be used to visualise and quantify cells and organelles in 3D. High-resolution 3D images of biological tissues from SBF SEM have been exploited considerably to date in the neuroscience field. However, non-brain samples, in particular hard biological tissues, have appeared more challenging to image by SBF SEM due to the difficulties of sectioning and rendering the samples conductive. We have developed and propose protocols for bone tissue preparation using SBF SEM, for imaging simultaneously soft and hard bone tissue components in 3D. We review the state of the art in high-resolution imaging of osteocytes, provide a historical perspective of SBF SEM, and we present first SBF SEM proof-of-concept studies for murine and human tissue. The application of SBF SEM to hard tissues will facilitate qualitative and quantitative 3D studies of tissue microstructure and ultrastructure in bone development, ageing and pathologies such as osteoporosis and osteoarthritis.

Keywords: 3D imaging; Bone; High resolution; Osteocyte; SBF SEM; Serial block-face scanning electron microscopy.


Conflict of interest statement

At the time of this work SS was employed by Gatan UK, which manufactures the 3View® attachment for SBF SEM. He is now co-founder of ConnectomX, which manufactures the Katana Microtome. HG is employed by Diatome, a company manufacturing diamond knives for ultramicrotomy.

Figures

None
Graphical abstract
Fig. 1
Fig. 1
Schematic views of the osteocyte and lacuno-canalicular networks (ON&LCN). The osteocytes and their processes are housed within the mineralised bone matrix in a system formed of (osteocyte) lacunae and interconnecting canaliculi.
Fig. 2
Fig. 2
Cycle of SBF SEM imaging in the prototype apparatus by Leighton and Kuzirian. In a high-vacuum SEM chamber sections were cut from a resin block using a tungsten-coated glass knife, then the block face was etched with oxygen plasma, improving visualisation of tissue and cellular components. The block face was sputter-coated with gold to render it conductive and allow charge-free imaging before a secondary electron image was recorded and the cycle begun again. The best cycle time for sectioning, etching, coating and imaging was 10 min. Reproduced with the permission of Alan Kuzirian.
Fig. 3
Fig. 3
Modern SBF SEM system. (A) Gatan 3View® 2XP system fitted in an FEI Quanta 250 field emission gun SEM. The original door supplied with the microscope is replaced by the 3View® system. (B) Loading the block into the 3View® system on the opened microscope door. (C) Detail of sample block mounted on a pin (arrow right) and diamond knife (arrow left) in situ. The double-headed arrow shows the travel directions of the knife and the chevron the vertical movement of the block. During operation the diamond knife moves laterally over the sample block (double-headed arrow), which travels upwards for a pre-determined increment (chevron), allowing the removal of a section when the knife returns to its original (‘clear’) position on the left. The block face is imaged while the knife is in this position.
Fig. 4
Fig. 4
Workflow diagram for SBF SEM imaging. Workflow diagram showing the sample processing stages for SBF SEM imaging and subsequent image processing and analysis. The curved arrow shows where decalcification may be omitted. The relevant subsections in the manuscript that cover these individual steps are indicated. * Image with permission from Gatan Inc.
Fig. 5
Fig. 5
Assessment of bone sample preparation quality for EM imaging and lacunar occupancy. (A) TEM image of a murine osteocyte in perfusion-fixed, decalcified bone showing sufficient spatial resolution and image contrast for visualisation of cell ultrastructure. The cell membrane (CM) and nuclear membrane (NM) are intact and regular, the mitochondria (m) show neither swelling nor shrinkage, and there is no cell shrinkage evident. (B) SBF SEM image of a murine osteocyte in perfusion-fixed, decalcified bone showing sufficient spatial resolution and image contrast for visualisation of cell ultrastructure. The cell membrane (CM) and nuclear membrane (NM) are intact and regular, the mitochondria (m) show neither swelling nor shrinkage, and there is no cell shrinkage evident. (C) Detail of cell nucleus (N), nuclear membrane (NM, dashed outline), cytoplasm (Cy) and mitochondria (m, dotted outline) from an SBF SEM image of a murine osteocyte. (D) TEM image of a human osteocyte in immersion-fixed, decalcified tissue showing intact cell membrane (CM) and nuclear membrane (NM). The pericellular space (*) is enlarged, probably due to cell shrinkage. (E, F) SBF SEM images of immersion-fixed, decalcified human bone tissue showing unoccupied (Lc.U) and occupied (Lc.O) osteocyte lacunae and unoccupied (Cn.U) and occupied (Cn.O) osteocyte canaliculi. Scale bars A, B and D = 2 μm, C = 200 nm, E and F = 5 μm.
Fig. 6
Fig. 6
The effects of sample preparation for EM imaging. (A) Preservation of cell ultrastructure: (A1) TEM image of a murine osteocyte showing poor preservation of cell ultrastructure. The cell membrane is distorted, the cytoplasm contains vesicles (v) and the nuclear material (N) is clumped; (A2) SBF SEM image of a human osteocyte showing poor preservation of cell ultrastructure and a large shrinkage artefact (*). (B) Problems caused by resin: (B1) TAAB resin-embedded murine bone tissue showing an osteocyte (O) and surface resin damage (Rd); (B2) ALV resin-embedded murine bone tissue showing osteocytes (O) and debris (D) on the surface. Both images, B1 and B2, exhibit reduced contrast. (C) SBF SEM images of decalcified and undecalcified bone tissue: (C1) Undecalcified murine bone tissue, showing osteocytes within the mineralised matrix (MM); (C2) Decalcified murine bone tissue, showing osteocytes within the decalcified matrix (DM).
Fig. 7
Fig. 7
Empirical relationships between SBF SEM imaging conditions and electron dose. Varying the operating conditions has an impact on the BSE signal/image quality and the electron dose. Dose is a function of volume (pixel size and slice thickness), energy (accelerating voltage) and beam current (controlled by spot size). Compromises must be made to achieve optimal imaging settings for maximised image quality and optimum cutting quality. kV = accelerating voltage.
Fig. 8
Fig. 8
Beam/sample interactions during SBF SEM imaging. (A) The incident electron beam (black arrow) interacts with the sample and BSEs (blue arrows) are detected. The block moves upwards (white arrow) and the knife moves horizontally (double-headed arrow) to remove a slice of tissue before the cycle restarts. (B) Increasing accelerating voltages (grey arrows) lead to a greater depth of electron penetration and associated tissue damage. Slice thickness (dotted lines) should be greater than the penetration depth of the beam in order to remove resin which has been affected by the beam and thus, to avoid surface damage in the subsequent image. (For interpretation of the references to colour in this figure legend, the reader is referred to the web version of this article.)
Fig. 9
Fig. 9
Effects of varying spot size and accelerating voltage on SBF SEM image quality. Images were taken using SBF SEM at a pixel size of 3.8 nm, 4k × 4k image size, a dwell time of 4 μs and a chamber pressure of 60.0 Pa. Images captured at lower accelerating voltage showed lower image contrast, while increased accelerating voltage and larger spot size led to damage on the block surface and charging, shown by dark patches in the image and lost detail within the cell. The image on the left shows neither charging nor surface damage and exhibits adequate image contrast to distinguish details of the cell ultrastructure. All scale bars = 2 μm.
Fig. 10
Fig. 10
An osteocyte reconstructed from SBF SEM data of perfusion-fixed, decalcified murine bone, prepared using the sample preparation protocol and imaging conditions described in this publication. Segmentation and volume rendering were carried out using Avizo. The cell body is shown in pale yellow, processes in green, the nucleus in blue and mitochondria in orange. An interactive .pdf version of this figure is available as a supplementary file (Supplementary 2). Scale bar = 5 μm. (For interpretation of the references to colour in this figure legend, the reader is referred to the web version of this article.)

References

    1. Knothe Tate M.L., Adamson J.R., Tami A.E., Bauer T.W. The osteocyte. Int. J. Biochem. Cell Biol. 2004;36:1–8. - PubMed
    1. Dallas S.L., Bonewald L.F. Dynamics of the transition from osteoblast to osteocyte. Ann. N. Y. Acad. Sci. 2010;1192:437–443. - PMC - PubMed
    1. You L., Cowin S.C., Schaffler M.B., Weinbaum S. A model for strain amplification in the actin cytoskeleton of osteocytes due to fluid drag on pericellular matrix. J. Biomech. 2001;34:1375–1386. - PubMed
    1. Bonivtch A.R., Bonewald L.F., Nicolella D.P. Tissue strain amplification at the osteocyte lacuna: a microstructural finite element analysis. J. Biomech. 2007;40:2199–2206. - PMC - PubMed
    1. Goggin P.M., Zygalakis K.C., Oreffo R.O., Schneider P. High-resolution 3D imaging of osteocytes and computational modelling in mechanobiology: insights on bone development, ageing, health and disease. Eur. Cell. Mater. 2016;31:264–295. - PubMed

Publication types